The Demand for Medical Insurance Professor Vivian Ho Health
41 Slides1.44 MB
The Demand for Medical Insurance Professor Vivian Ho Health Economics Fall 2009 These slides draw from material in Santerre & Neun, Health Economics: Theories, Industries and Insights, Thomson, 2007
Topics to cover: A theoretical model of health insurance When theory meets the real world.
Logic The consumer pays insurer a premium to cover medical expenses in coming year – For any one consumer, the premium will be higher or lower than medical expenses But the insurer can pool or spread risk among many insurees The sum of premiums will exceed the sum of medical expenses
Characterizing Risk Aversion Recall the consumer maximizes utility, with prices and income given – Utility U (health, other goods) – health h (medical care) Insurance doesn’t guarantee health, but provides to purchase health care We assumed diminishing marginal utility of “health” and “other goods”
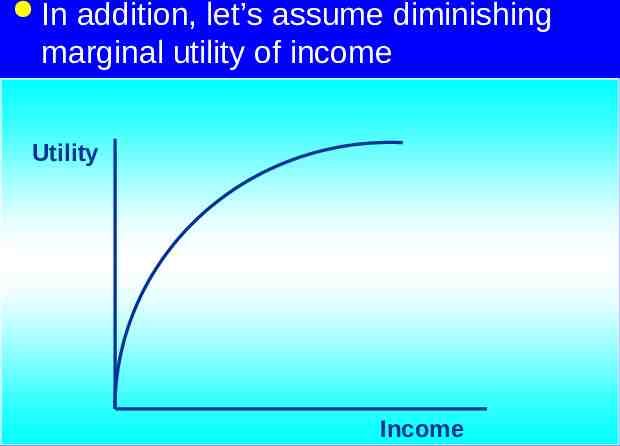
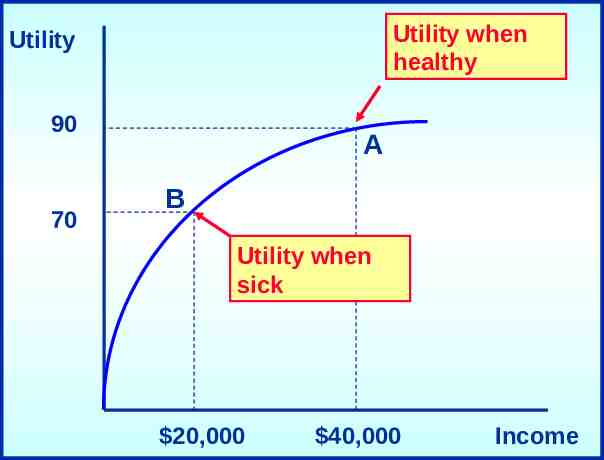
In addition, let’s assume diminishing marginal utility of income Utility Income
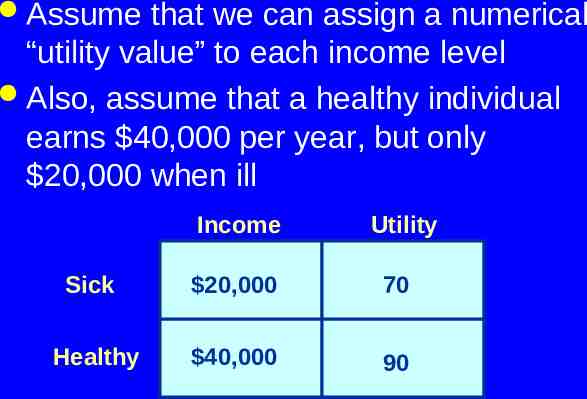
Assume that we can assign a numerical “utility value” to each income level Also, assume that a healthy individual earns 40,000 per year, but only 20,000 when ill Income Utility Sick 20,000 70 Healthy 40,000 90
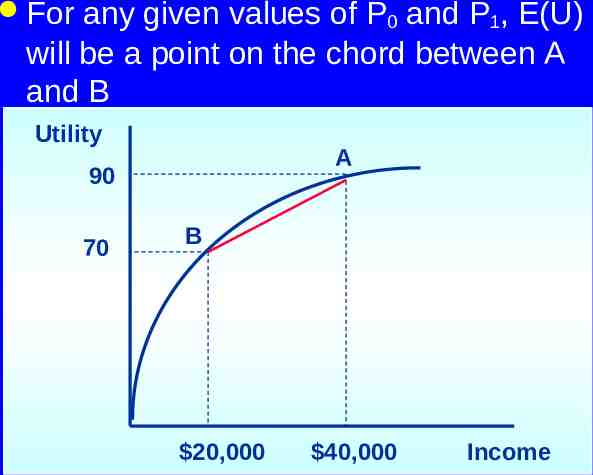
Utility when healthy Utility 90 70 A B Utility when sick 20,000 40,000 Income
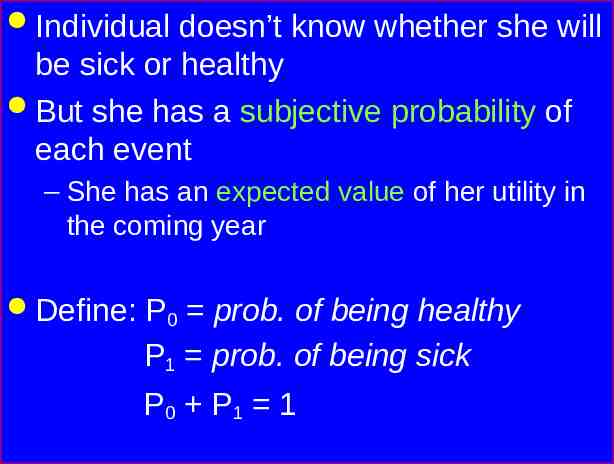
Individual doesn’t know whether she will be sick or healthy But she has a subjective probability of each event – She has an expected value of her utility in the coming year Define: P0 prob. of being healthy P1 prob. of being sick P0 P1 1
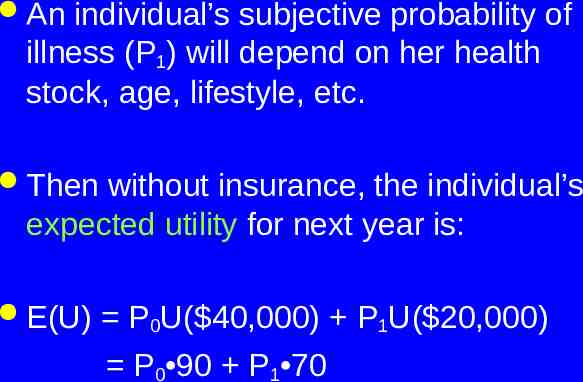
An individual’s subjective probability of illness (P1) will depend on her health stock, age, lifestyle, etc. Then without insurance, the individual’s expected utility for next year is: E(U) P0U( 40,000) P1U( 20,000) P0 90 P1 70
For any given values of P0 and P1, E(U) will be a point on the chord between A and B Utility A 90 70 B 20,000 40,000 Income
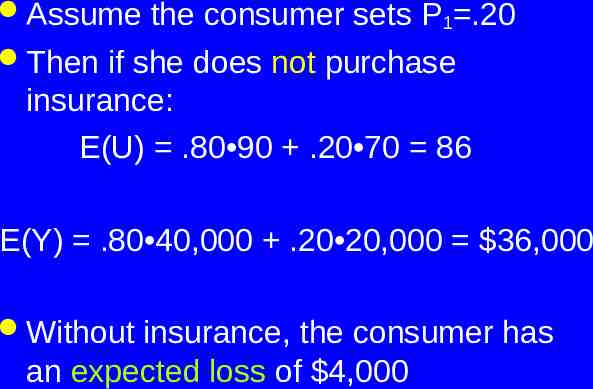
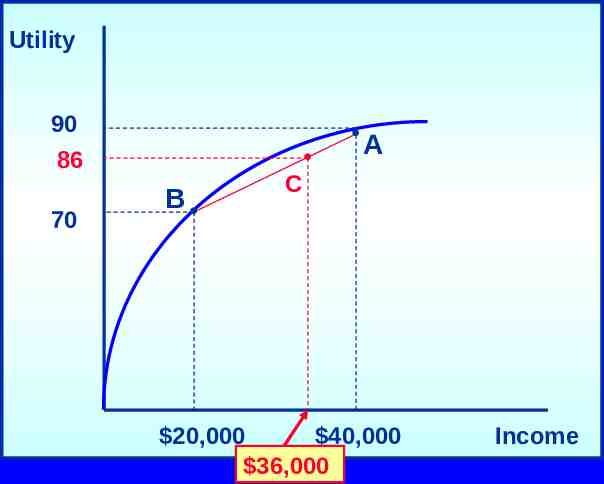
Assume the consumer sets P1 .20 Then if she does not purchase insurance: E(U) .80 90 .20 70 86 E(Y) .80 40,000 .20 20,000 36,000 Without insurance, the consumer has an expected loss of 4,000
Utility 90 86 70 B C A 20,000 40,000 36,000 Income
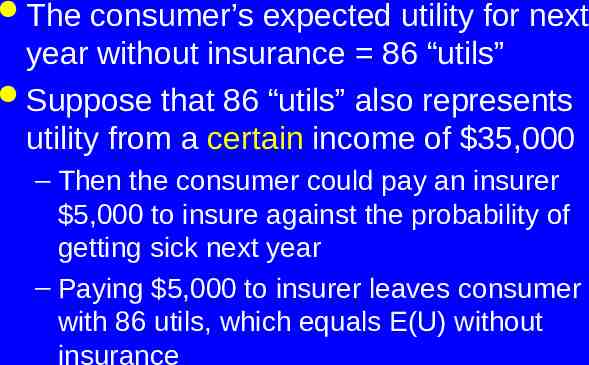
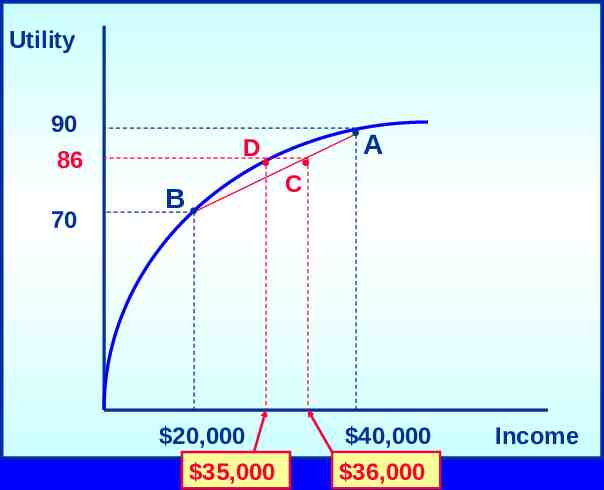
The consumer’s expected utility for next year without insurance 86 “utils” Suppose that 86 “utils” also represents utility from a certain income of 35,000 – Then the consumer could pay an insurer 5,000 to insure against the probability of getting sick next year – Paying 5,000 to insurer leaves consumer with 86 utils, which equals E(U) without insurance
Utility 90 86 70 D B 20,000 35,000 A C 40,000 36,000 Income
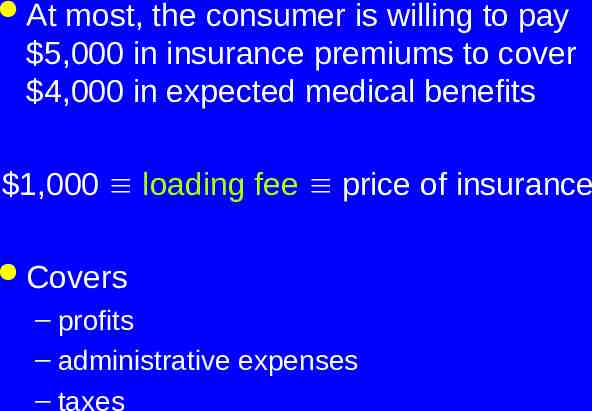
At most, the consumer is willing to pay 5,000 in insurance premiums to cover 4,000 in expected medical benefits 1,000 loading fee price of insurance Covers – profits – administrative expenses – taxes
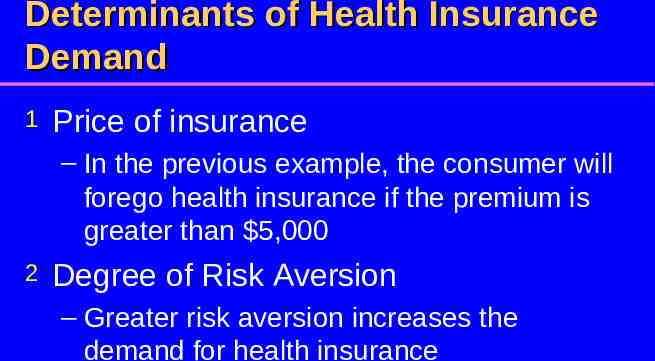
Determinants of Health Insurance Demand 1 Price of insurance – In the previous example, the consumer will forego health insurance if the premium is greater than 5,000 2 Degree of Risk Aversion – Greater risk aversion increases the demand for health insurance
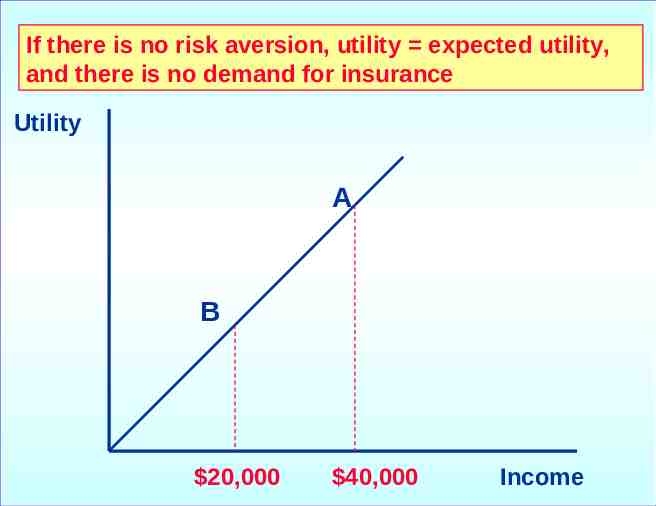
If there is no risk aversion, utility expected utility, and there is no demand for insurance Utility A B 20,000 40,000 Income
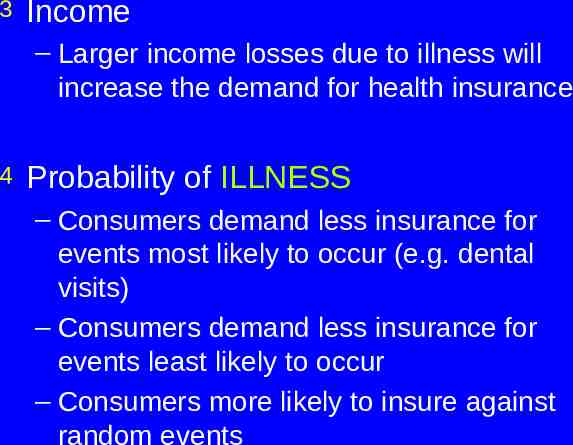
3 Income – Larger income losses due to illness will increase the demand for health insurance 4 Probability of ILLNESS – Consumers demand less insurance for events most likely to occur (e.g. dental visits) – Consumers demand less insurance for events least likely to occur – Consumers more likely to insure against random events
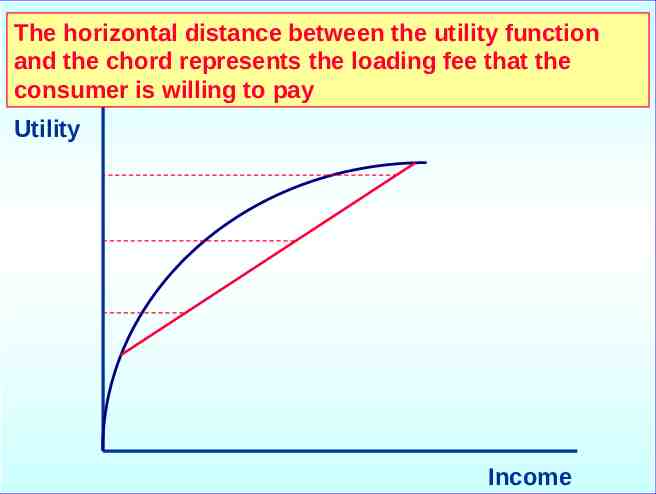
The horizontal distance between the utility function and the chord represents the loading fee that the consumer is willing to pay Utility Income
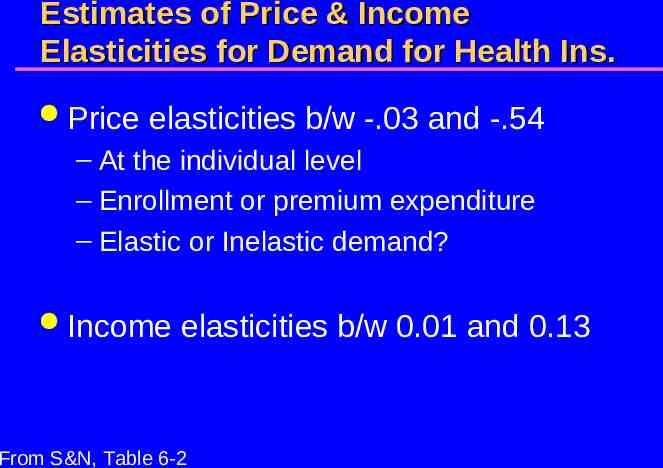
Estimates of Price & Income Elasticities for Demand for Health Ins. Price elasticities b/w -.03 and -.54 – At the individual level – Enrollment or premium expenditure – Elastic or Inelastic demand? Income elasticities b/w 0.01 and 0.13 From S&N, Table 6-2
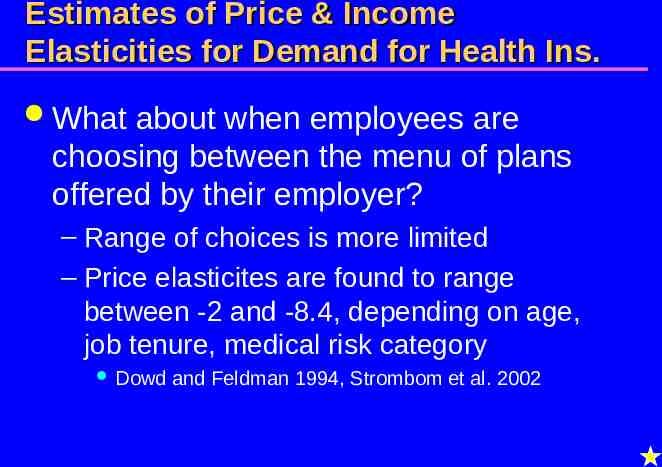
Estimates of Price & Income Elasticities for Demand for Health Ins. What about when employees are choosing between the menu of plans offered by their employer? – Range of choices is more limited – Price elasticites are found to range between -2 and -8.4, depending on age, job tenure, medical risk category Dowd and Feldman 1994, Strombom et al. 2002
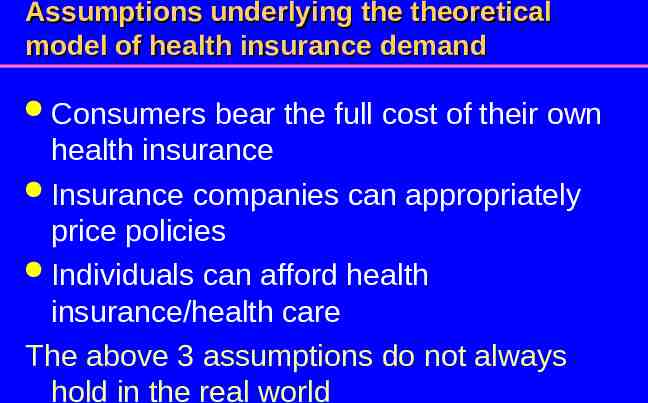
Assumptions underlying the theoretical model of health insurance demand Consumers bear the full cost of their own health insurance Insurance companies can appropriately price policies Individuals can afford health insurance/health care The above 3 assumptions do not always hold in the real world
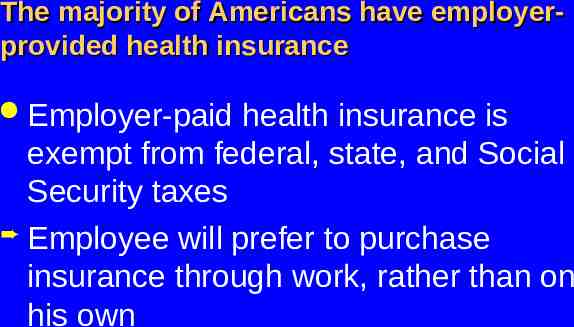
The majority of Americans have employerprovided health insurance Employer-paid health insurance is exempt from federal, state, and Social Security taxes Employee will prefer to purchase insurance through work, rather than on his own
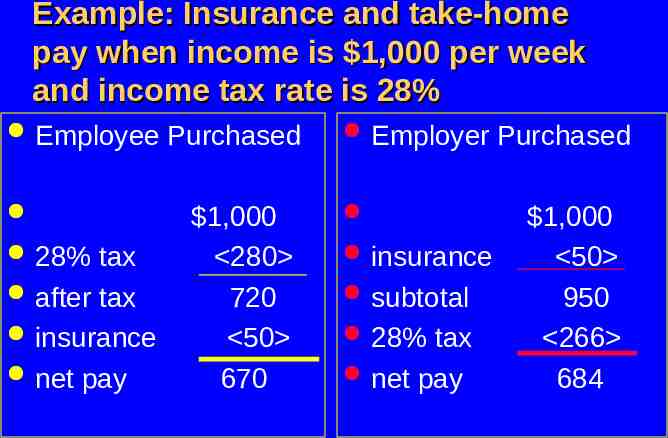
Example: Insurance and take-home pay when income is 1,000 per week and income tax rate is 28% Employee Purchased 28% tax after tax insurance net pay 1,000 280 720 50 670 Employer Purchased insurance subtotal 28% tax net pay 1,000 50 950 266 684
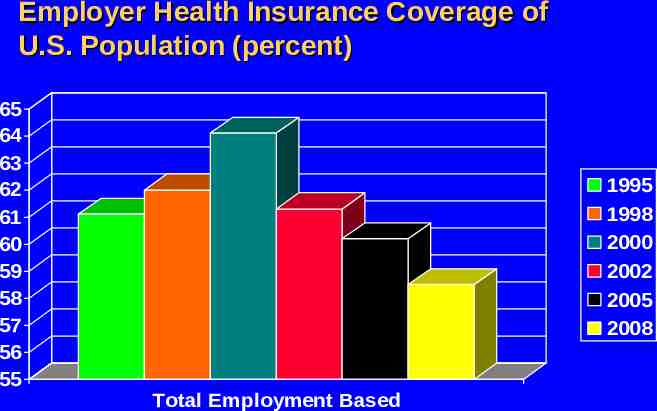
Employer Health Insurance Coverage of U.S. Population (percent) 65 64 63 62 61 60 59 58 57 56 55 1995 1998 2000 2002 2005 2008 Total Employment Based
Consequences for costs “Too many” services were covered by insurance – Coverage of more small claims increased administrative costs – Employers offering more than 1 plan often fully subsidized the more expensive plans
Empirical Evidence Long & Scott (1982) – Regression analysis of the determinants of % of compensation paid to employees as health insurance – – Annual U.S. data 1947-1979 N 32
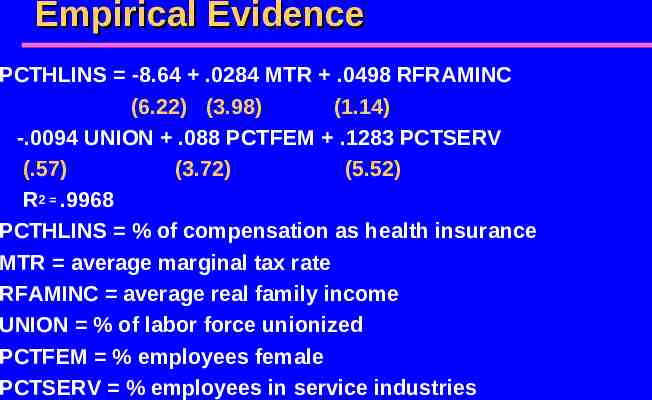
Empirical Evidence PCTHLINS -8.64 .0284 MTR .0498 RFRAMINC (6.22) (3.98) (1.14) -.0094 UNION .088 PCTFEM .1283 PCTSERV (.57) (3.72) (5.52) R2 .9968 PCTHLINS % of compensation as health insurance MTR average marginal tax rate RFAMINC average real family income UNION % of labor force unionized PCTFEM % employees female PCTSERV % employees in service industries
Empirical Evidence How does an increase in the marginal tax rate affect the worker’s compensation package? The implied elasticity of PCTHLTINS with respect to MTR is 0.41. If a cut in the income tax rate is approved, will demand for health insurance rise or fall?
Physicians & Managed Care Traditional fee-for-service gives physicians incentive to “overutilize” medical services Managed care: A broad set of policies designed by 3rd-party-payers to control utilization and cost of medical care: utilization review alternative compensation schemes quality control
Managed care and Physician Incentives HMOs are a type of managed care organization, but there are a variety of HMOs Staff model: Physicians employed by HMO on a salary basis No incentive to over-provide care Group model: HMO contracts w/ group practice, which is paid by capitation Incentive to limit services
Network model: HMO contracts w/ 1 group practice, all paid by capitation. Incentive to limit services IPA model: HMO contracts w/ multiple docs in various practices; paid by discounted fee-for-service Some incentive to over-utilize
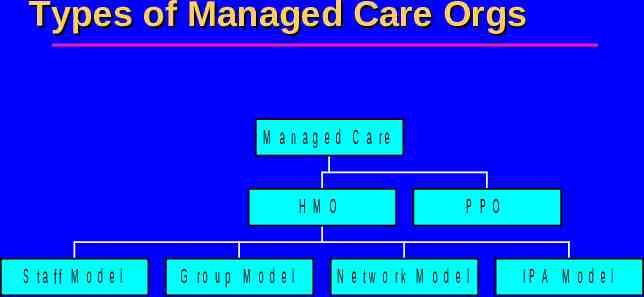
Types of Managed Care Orgs M a n a g e d C a re H M O S ta ff M o d e l G ro u p M o d e l PPO N e tw o rk M o d e l IP A M o d e l
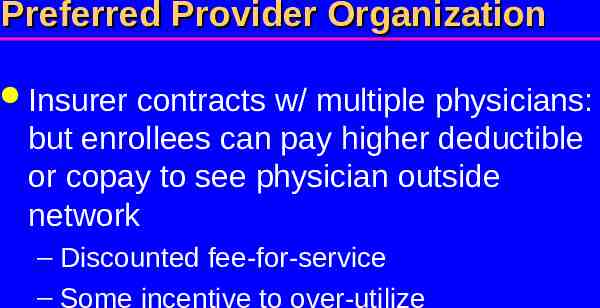
Preferred Provider Organization Insurer contracts w/ multiple physicians: but enrollees can pay higher deductible or copay to see physician outside network – Discounted fee-for-service – Some incentive to over-utilize
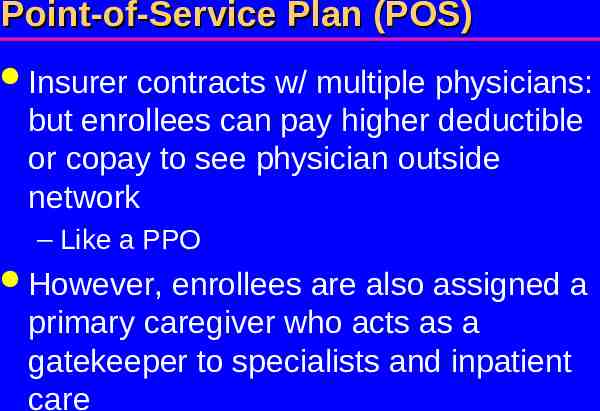
Point-of-Service Plan (POS) Insurer contracts w/ multiple physicians: but enrollees can pay higher deductible or copay to see physician outside network – Like a PPO However, enrollees are also assigned a primary caregiver who acts as a gatekeeper to specialists and inpatient care
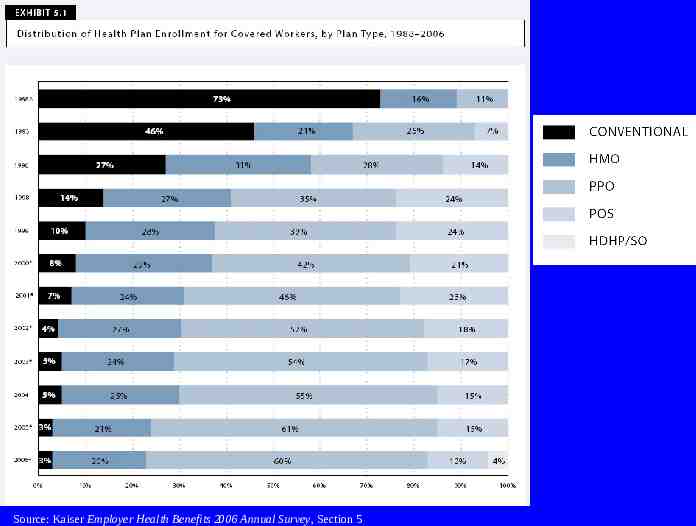
Source: Kaiser Employer Health Benefits 2006 Annual Survey, Section 5
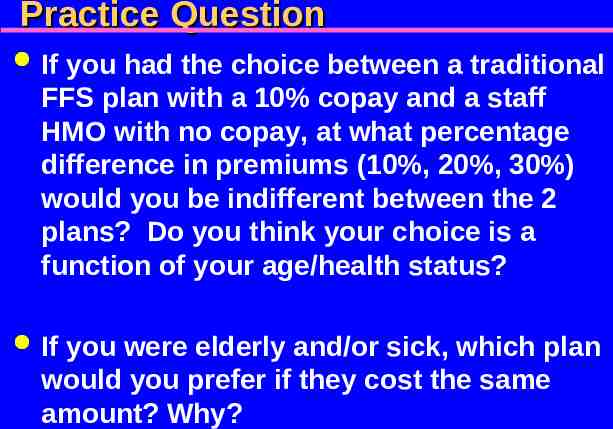
Practice Question If you had the choice between a traditional FFS plan with a 10% copay and a staff HMO with no copay, at what percentage difference in premiums (10%, 20%, 30%) would you be indifferent between the 2 plans? Do you think your choice is a function of your age/health status? If you were elderly and/or sick, which plan would you prefer if they cost the same amount? Why?
Provider Management Strategies Selective contracting – MCOs will contract with an exclusive set of providers – Based on quality or cost-effective practice patterns Physician profiling – MCOs monitor physicians’ track record regarding referrals, quality, patient satisfaction
Provider Management Strategies Utilization review – “determine whether specific services are medically necessary and whether they are delivered at an appropriate level of intensity and cost Practice guidelines – Inform providers of the appropriate medical practice in certain situations Formularies – restricted list of drugs physicians may prescribe
Performance of MCO’s: Are they “good” or not? Ideally, MCOs should encourage preventive and coordinated primary care, which reduces the need for more expensive specialty/inpatient care But most MCOs are concerned with shortterm profitability – Why pay for cholesterol-lowering pills when the enrollee is likely to leave your HMO years before he has a heart attack?
Performance of MCO’s: Are they “good” or not? In general, studies show that HMOs provide medical cost savings of 1520%, mostly through reduced hospital care The impact of HMOs on quality of care is less definite – Health care providers treat patients belonging to a variety of plans