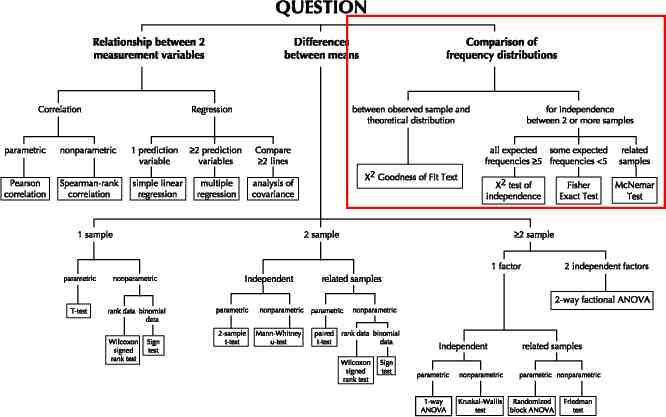
Chi Square Analyses: Comparing Frequency Distributions


24 Slides1.77 MB
Chi Square Analyses: Comparing Frequency Distributions
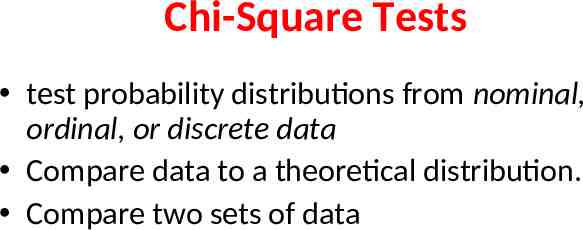
Chi-Square Tests test probability distributions from nominal, ordinal, or discrete data Compare data to a theoretical distribution. Compare two sets of data
Chi Square Tests for Goodness of Fit Two types – extrinsic and intrinsic Assumptions of both tests – Measurement on at least a nominal scale – Observations are independent – The expected frequencies for each category must be specified – The sample size must be sufficiently large so that no category has an expected frequency of 5.
Chi Square Tests for Goodness of Fit Hypotheses – Null – the observed frequency distribution is the same as the hypothesized frequency distribution – Alternative - the observed and hypothesized distributions are different
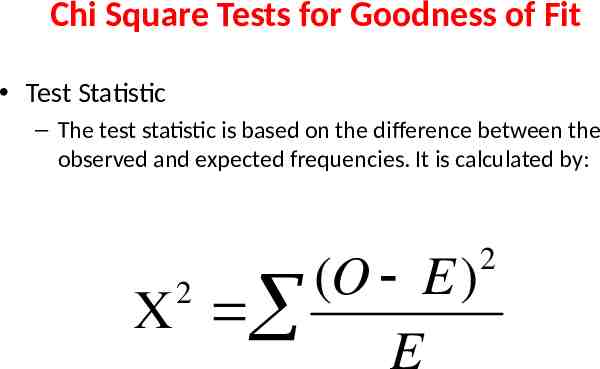
Chi Square Tests for Goodness of Fit Test Statistic – The test statistic is based on the difference between the observed and expected frequencies. It is calculated by: (O E) E 2 2
Chi Square Test for Goodness of Fit In an extrinsic test, no population parameters need to be estimated from the data. An intrinsic test requires an estimation of a population parameter from the data collected. – Technically, the degrees of freedom should be reduced by 1 for each parameter estimated – However, this is a minor effect and not always considered (we won’t worry about it). – An intrinsic test is commonly used when comparing a sample to a derived distribution such as the poisson or binomial distribution
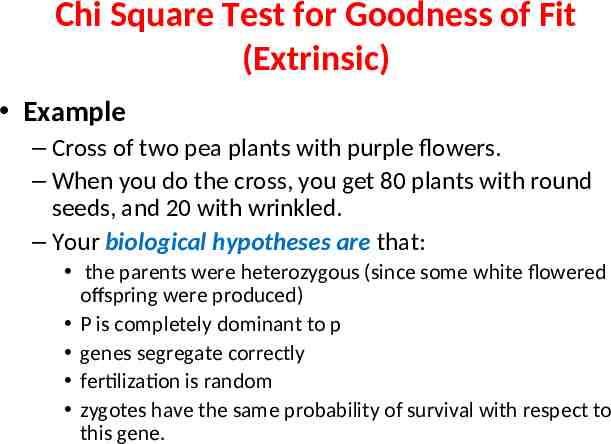
Chi Square Test for Goodness of Fit (Extrinsic) Example – Cross of two pea plants with purple flowers. – When you do the cross, you get 80 plants with round seeds, and 20 with wrinkled. – Your biological hypotheses are that: the parents were heterozygous (since some white flowered offspring were produced) P is completely dominant to p genes segregate correctly fertilization is random zygotes have the same probability of survival with respect to this gene.
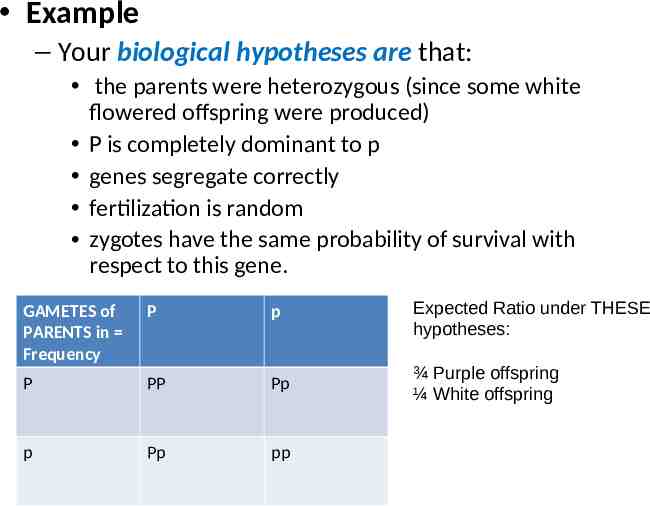
Example – Your biological hypotheses are that: the parents were heterozygous (since some white flowered offspring were produced) P is completely dominant to p genes segregate correctly fertilization is random zygotes have the same probability of survival with respect to this gene. GAMETES of PARENTS in Frequency P p Expected Ratio under THESE hypotheses: P PP Pp ¾ Purple offspring ¼ White offspring p Pp pp
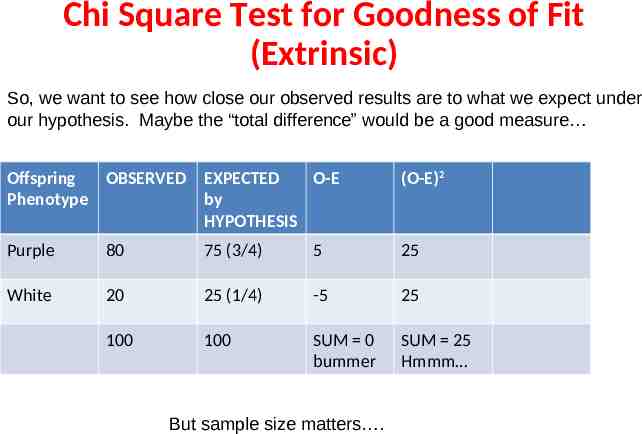
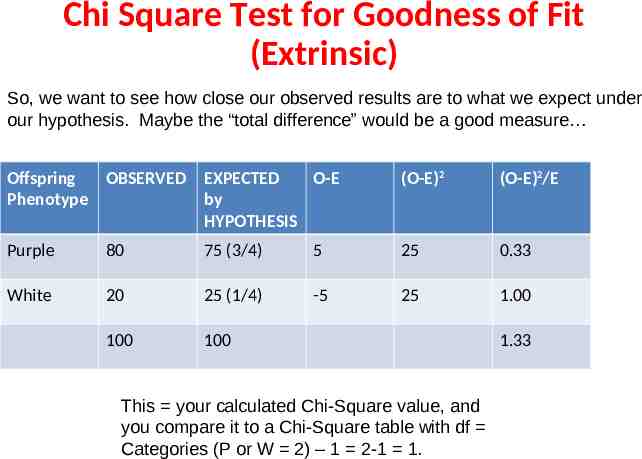
Chi Square Test for Goodness of Fit (Extrinsic) So, we want to see how close our observed results are to what we expect under our hypothesis. Maybe the “total difference” would be a good measure Offspring OBSERVED Phenotype EXPECTED O-E by HYPOTHESIS (O-E)2 Purple 80 75 (3/4) 5 25 White 20 25 (1/4) -5 25 100 100 SUM 0 bummer SUM 25 Hmmm But sample size matters .
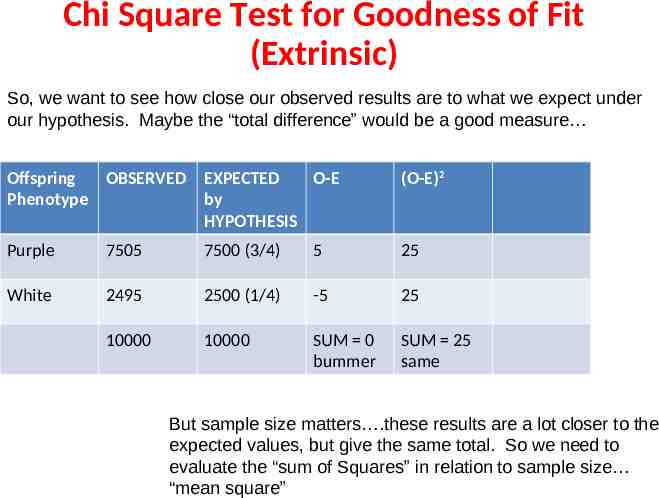
Chi Square Test for Goodness of Fit (Extrinsic) So, we want to see how close our observed results are to what we expect under our hypothesis. Maybe the “total difference” would be a good measure Offspring OBSERVED Phenotype EXPECTED O-E by HYPOTHESIS (O-E)2 Purple 7505 7500 (3/4) 5 25 White 2495 2500 (1/4) -5 25 10000 10000 SUM 0 bummer SUM 25 same But sample size matters .these results are a lot closer to the expected values, but give the same total. So we need to evaluate the “sum of Squares” in relation to sample size “mean square”
Chi Square Test for Goodness of Fit (Extrinsic) So, we want to see how close our observed results are to what we expect under our hypothesis. Maybe the “total difference” would be a good measure Offspring OBSERVED Phenotype EXPECTED O-E by HYPOTHESIS (O-E)2 (O-E)2/E Purple 80 75 (3/4) 5 25 0.33 White 20 25 (1/4) -5 25 1.00 100 100 This your calculated Chi-Square value, and you compare it to a Chi-Square table with df Categories (P or W 2) – 1 2-1 1. 1.33
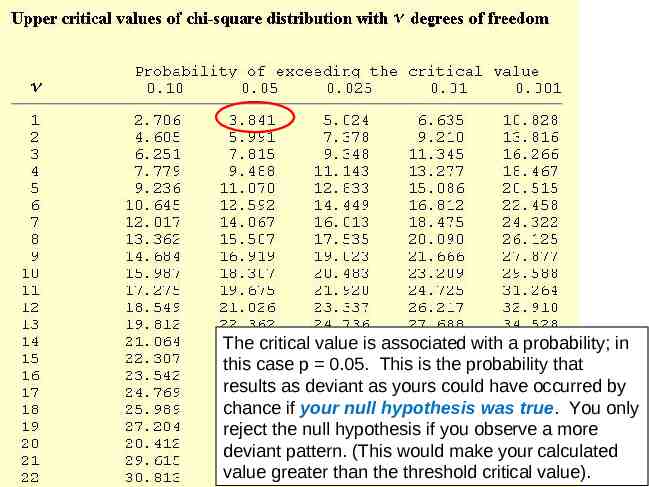
The critical value is associated with a probability; in this case p 0.05. This is the probability that results as deviant as yours could have occurred by chance if your null hypothesis was true. You only reject the null hypothesis if you observe a more deviant pattern. (This would make your calculated value greater than the threshold critical value).
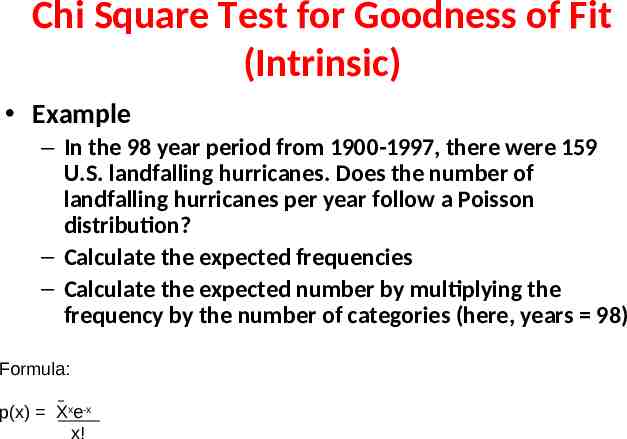
Chi Square Test for Goodness of Fit (Intrinsic) Example – In the 98 year period from 1900-1997, there were 159 U.S. landfalling hurricanes. Does the number of landfalling hurricanes per year follow a Poisson distribution? – Calculate the expected frequencies – Calculate the expected number by multiplying the frequency by the number of categories (here, years 98) Formula: p(x) Xxe-x x!
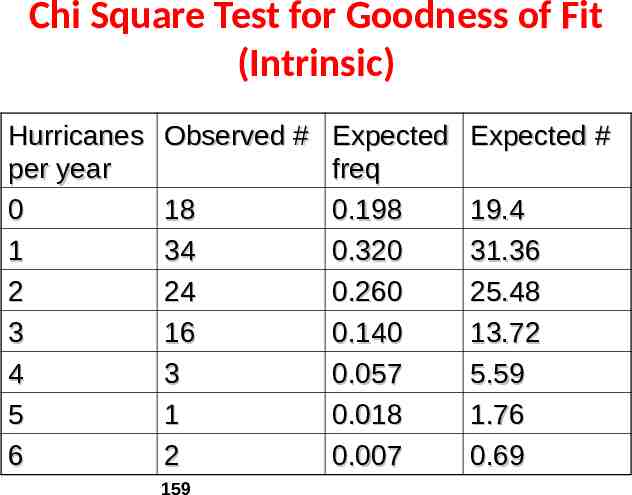
Chi Square Test for Goodness of Fit (Intrinsic) Hurricanes per year 0 1 2 3 4 5 6 Observed # Expected Expected # freq 18 0.198 19.4 34 0.320 31.36 24 0.260 25.48 16 0.140 13.72 3 0.057 5.59 1 0.018 1.76 2 0.007 0.69 159
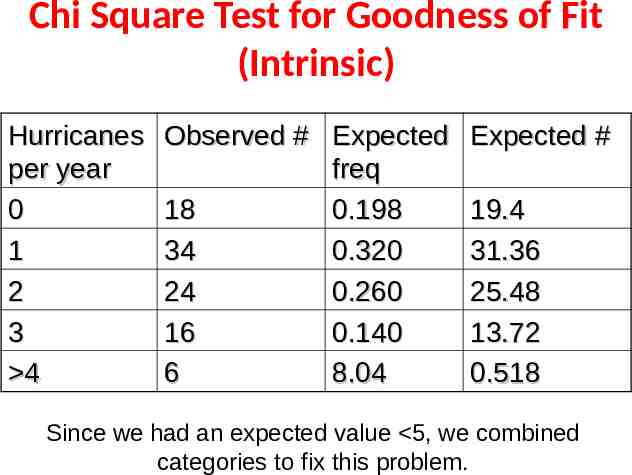
Chi Square Test for Goodness of Fit (Intrinsic) Hurricanes per year 0 1 2 3 4 Observed # Expected Expected # freq 18 0.198 19.4 34 0.320 31.36 24 0.260 25.48 16 0.140 13.72 6 8.04 0.518 Since we had an expected value 5, we combined categories to fix this problem.
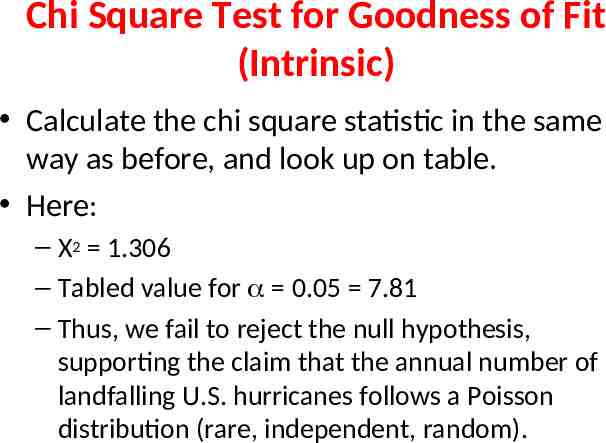
Chi Square Test for Goodness of Fit (Intrinsic) Calculate the chi square statistic in the same way as before, and look up on table. Here: – X2 1.306 – Tabled value for 0.05 7.81 – Thus, we fail to reject the null hypothesis, supporting the claim that the annual number of landfalling U.S. hurricanes follows a Poisson distribution (rare, independent, random).
Chi Square Test of Independence Also called the Chi Square Test for Contingency Tables This test is performed to see if two variables, both measured on a nominal scale, are related in some way. The question asked here is if there is a relationship between the variables; the null hypothesis is that no relationship exists – they are “independent”.
Chi Square Test of Independence Steps in doing the test – 1. Form a table, or matrix, from the data collected – 2. Calculate row, column, and grand totals for the matrix – 3. Use these totals to calculate expected values (frequencies) for each cell in the matrix Calculated by: [(row total) x (column total)]/grand total Based on the product rule – the probability of two independent events occurring together is the product of their independent probabilities.
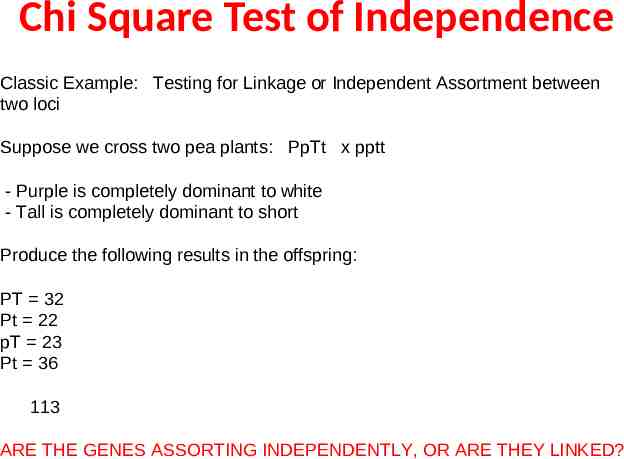
Chi Square Test of Independence Classic Example: Testing for Linkage or Independent Assortment between two loci Suppose we cross two pea plants: PpTt x pptt - Purple is completely dominant to white - Tall is completely dominant to short Produce the following results in the offspring: PT 32 Pt 22 pT 23 Pt 36 113 ARE THE GENES ASSORTING INDEPENDENTLY, OR ARE THEY LINKED?
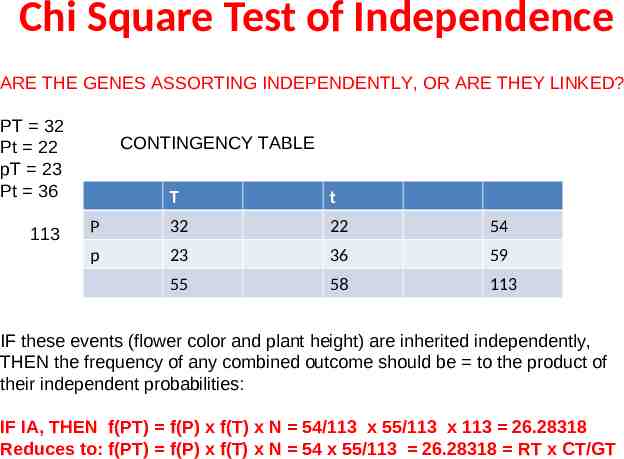
Chi Square Test of Independence ARE THE GENES ASSORTING INDEPENDENTLY, OR ARE THEY LINKED? PT 32 Pt 22 pT 23 Pt 36 113 CONTINGENCY TABLE T t P 32 22 54 p 23 36 59 55 58 113 IF these events (flower color and plant height) are inherited independently, THEN the frequency of any combined outcome should be to the product of their independent probabilities: IF IA, THEN f(PT) f(P) x f(T) x N 54/113 x 55/113 x 113 26.28318 Reduces to: f(PT) f(P) x f(T) x N 54 x 55/113 26.28318 RT x CT/GT
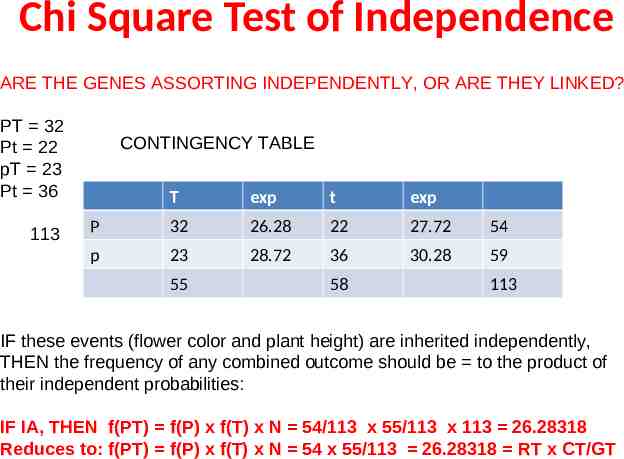
Chi Square Test of Independence ARE THE GENES ASSORTING INDEPENDENTLY, OR ARE THEY LINKED? PT 32 Pt 22 pT 23 Pt 36 113 CONTINGENCY TABLE T exp t exp P 32 26.28 22 27.72 54 p 23 28.72 36 30.28 59 55 58 113 IF these events (flower color and plant height) are inherited independently, THEN the frequency of any combined outcome should be to the product of their independent probabilities: IF IA, THEN f(PT) f(P) x f(T) x N 54/113 x 55/113 x 113 26.28318 Reduces to: f(PT) f(P) x f(T) x N 54 x 55/113 26.28318 RT x CT/GT
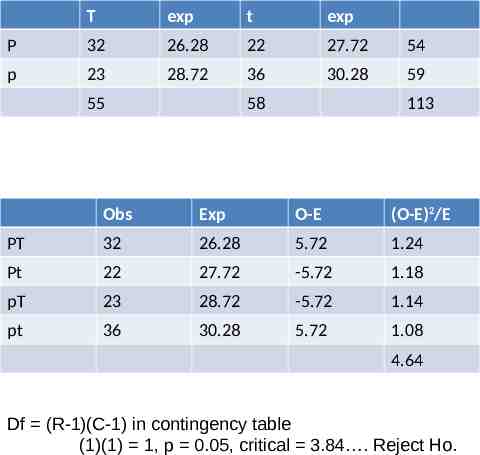
T exp t exp P 32 26.28 22 27.72 54 p 23 28.72 36 30.28 59 55 58 113 Obs Exp O-E (O-E)2/E PT 32 26.28 5.72 1.24 Pt 22 27.72 -5.72 1.18 pT 23 28.72 -5.72 1.14 pt 36 30.28 5.72 1.08 4.64 Df (R-1)(C-1) in contingency table (1)(1) 1, p 0.05, critical 3.84 . Reject Ho.