Chapter 9 Project Cash Flow Analysis 1
24 Slides813.00 KB
Chapter 9 Project Cash Flow Analysis 1
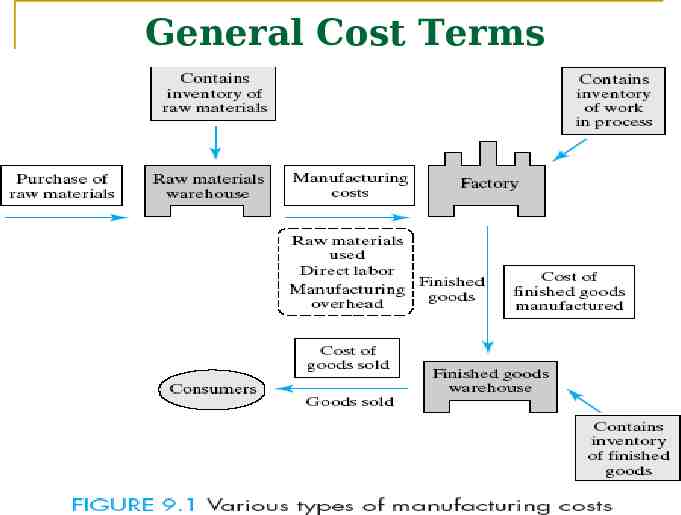
General Cost Terms 2
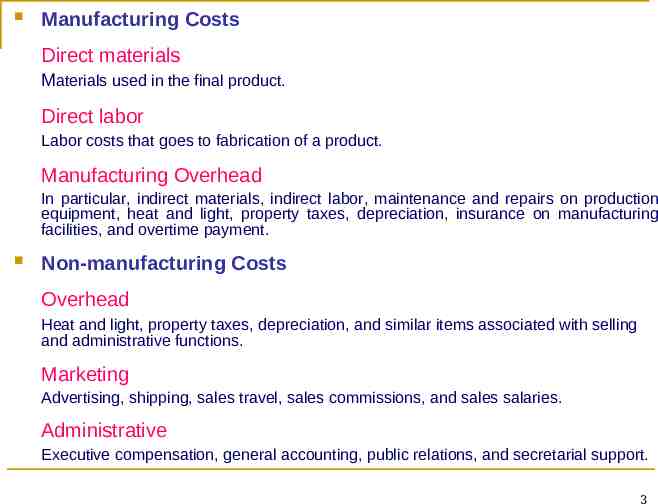
Manufacturing Costs Direct materials Materials used in the final product. Direct labor Labor costs that goes to fabrication of a product. Manufacturing Overhead In particular, indirect materials, indirect labor, maintenance and repairs on production equipment, heat and light, property taxes, depreciation, insurance on manufacturing facilities, and overtime payment. Non-manufacturing Costs Overhead Heat and light, property taxes, depreciation, and similar items associated with selling and administrative functions. Marketing Advertising, shipping, sales travel, sales commissions, and sales salaries. Administrative Executive compensation, general accounting, public relations, and secretarial support. 3
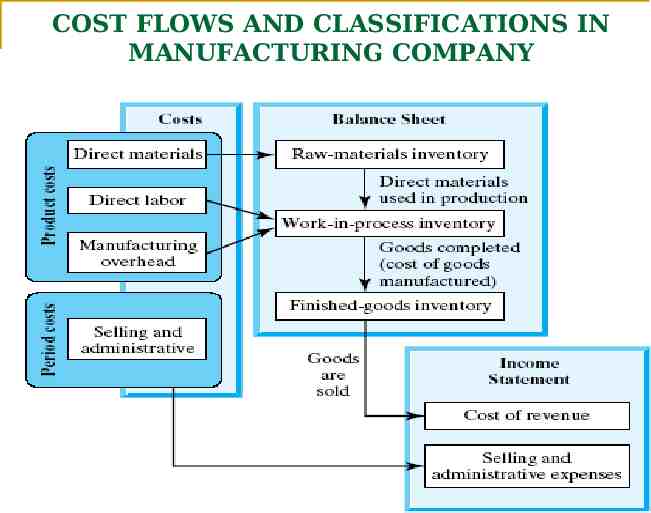
COST FLOWS AND CLASSIFICATIONS IN MANUFACTURING COMPANY 4
Matching Concept: The costs incurred to generate particular revenue should be recognized as expenses in the same period that the revenue is recognized. Period costs: Those costs that are charged to expenses in the period in which the expenses are incurred. Examples of periodic costs are all general and administrative expenses, selling expenses, insurance, and income tax expenses. Therefore, advertising costs, executive salaries, sales commissions, public relations costs, and other nonmanufacturing costs would all be period cost. Such costs are not related to the production and flow of manufactured goods, but deducted from revenue in the income statement. Product costs: Those costs involved in the purchase or manufacturing of goods. In the case of manufactured costs consist of direct materials, direct labor, and manufacturing overhead. Product costs are not viewed as expenses; rather they are the cost of creating inventory. Thus, product costs are considered an asset until goods are sold. 5
Cost Classification for Predicting Cost Behavior Volume index Operating cost respond in some way to changes in its operating volume. Cost Behaviors Fixed costs Variable costs Mixed costs In the car case, Depreciation, occur from passage of time (fixed portion) and also More miles are driven a year, loses its Market value (variable portion), cost of electrical power (lighting, number of machine hours worked). Average unit costs 6
Volume Index Definition: The unit measure used to define “volume” Based on production inputs (tons of coal processed, direct labor hours used, or machine hours worked). Examples: Automobile – “miles” driven Electricity Generating plant – “kWh” produced Stamping machine – “parts” stamped 7
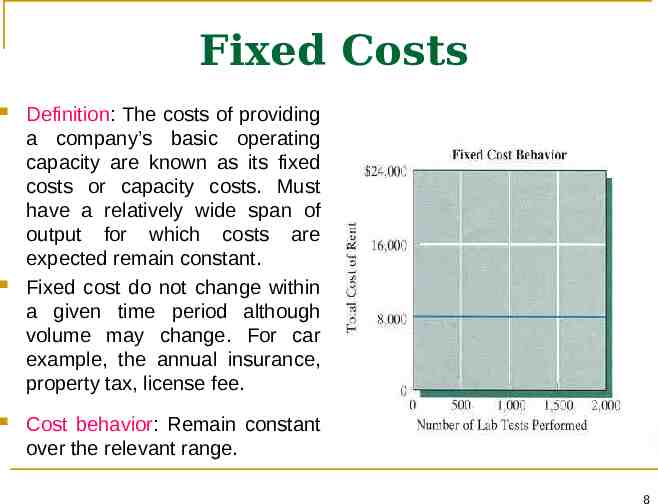
Fixed Costs Definition: The costs of providing a company’s basic operating capacity are known as its fixed costs or capacity costs. Must have a relatively wide span of output for which costs are expected remain constant. Fixed cost do not change within a given time period although volume may change. For car example, the annual insurance, property tax, license fee. Cost behavior: Remain constant over the relevant range. 8
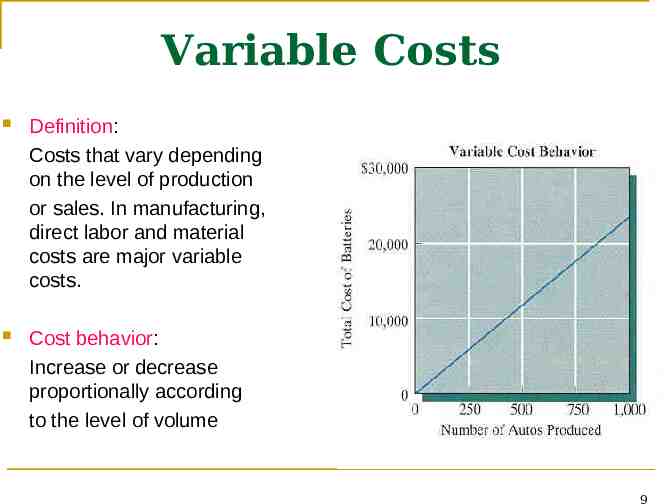
Variable Costs Definition: Costs that vary depending on the level of production or sales. In manufacturing, direct labor and material costs are major variable costs. Cost behavior: Increase or decrease proportionally according to the level of volume 9
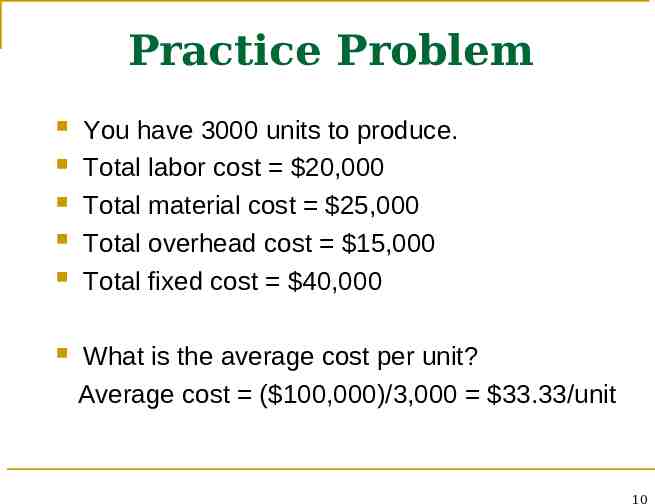
Practice Problem You have 3000 units to produce. Total labor cost 20,000 Total material cost 25,000 Total overhead cost 15,000 Total fixed cost 40,000 What is the average cost per unit? Average cost ( 100,000)/3,000 33.33/unit 10
Project Cash Flow Analysis 11
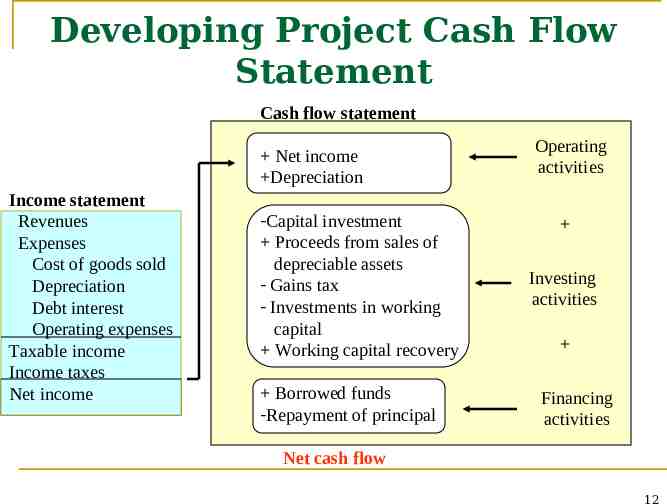
Developing Project Cash Flow Statement Cash flow statement Net income Depreciation Income statement Revenues Expenses Cost of goods sold Depreciation Debt interest Operating expenses Taxable income Income taxes Net income -Capital investment Proceeds from sales of depreciable assets - Gains tax - Investments in working capital Working capital recovery Borrowed funds -Repayment of principal Operating activities Investing activities Financing activities Net cash flow 12
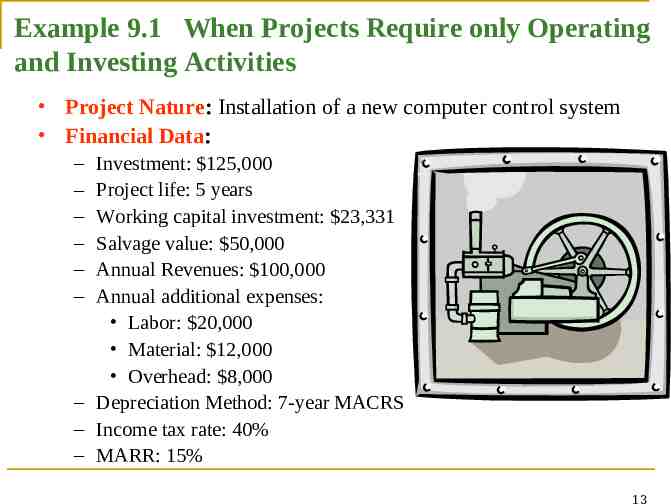
Example 9.1 When Projects Require only Operating and Investing Activities Project Nature: Installation of a new computer control system Financial Data: – – – – – – Investment: 125,000 Project life: 5 years Working capital investment: 23,331 Salvage value: 50,000 Annual Revenues: 100,000 Annual additional expenses: Labor: 20,000 Material: 12,000 Overhead: 8,000 – Depreciation Method: 7-year MACRS – Income tax rate: 40% – MARR: 15% 13
Questions (a) Develop the project’s cash flows over its project life. (b) Is this project justifiable at a MARR of 15%? (c) What is the internal rate of return of this project? 14
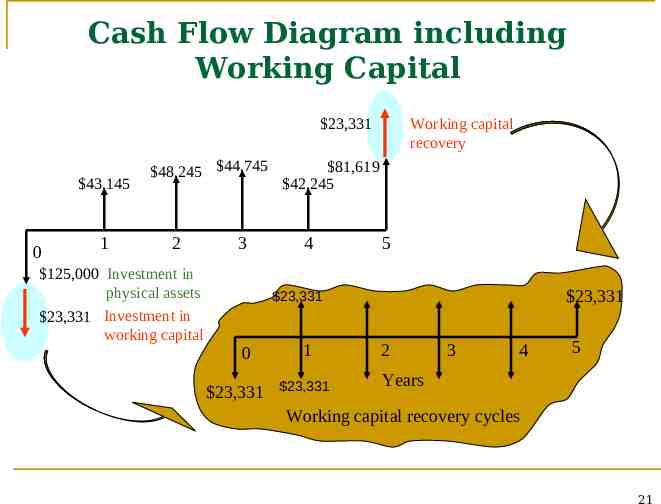
When Projects Require Working Capital Investments Working capital represents the amount carried in cash, accounts receivable, and inventory that are needed for the operation of the project Working Capital includes the stocks of finished and semifinished goods that will be economically consumed in the near future or will be made into a finished consumer good in the near future. How to treat working capital investments: just like a capital expenditure except that no depreciation is allowed. 15
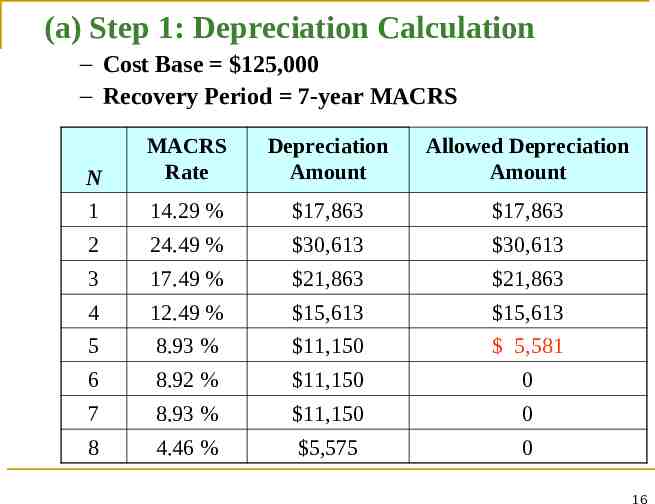
(a) Step 1: Depreciation Calculation – Cost Base 125,000 – Recovery Period 7-year MACRS N MACRS Rate Depreciation Amount Allowed Depreciation Amount 1 14.29 % 17,863 17,863 2 24.49 % 30,613 30,613 3 17.49 % 21,863 21,863 4 12.49 % 15,613 15,613 5 8.93 % 11,150 5,581 6 8.92 % 11,150 0 7 8.93 % 11,150 0 8 4.46 % 5,575 0 16
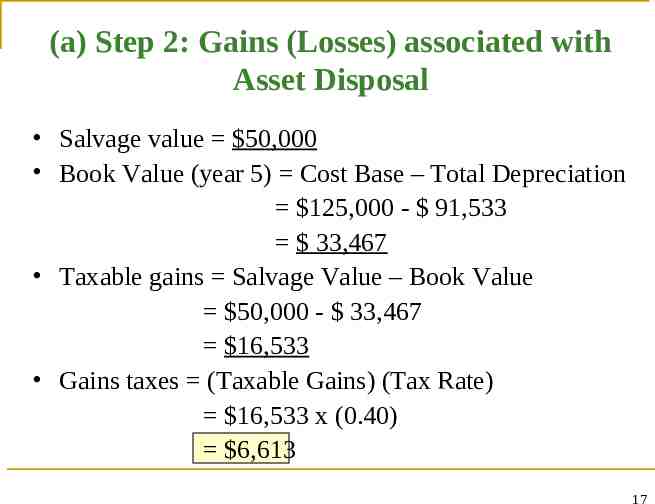
(a) Step 2: Gains (Losses) associated with Asset Disposal Salvage value 50,000 Book Value (year 5) Cost Base – Total Depreciation 125,000 - 91,533 33,467 Taxable gains Salvage Value – Book Value 50,000 - 33,467 16,533 Gains taxes (Taxable Gains) (Tax Rate) 16,533 x (0.40) 6,613 17
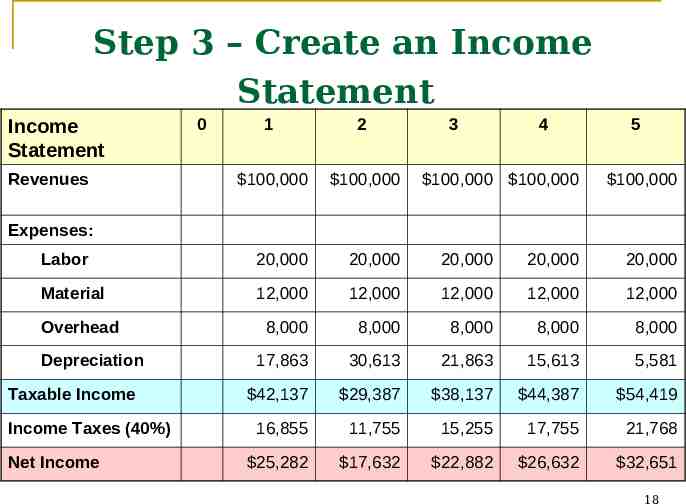
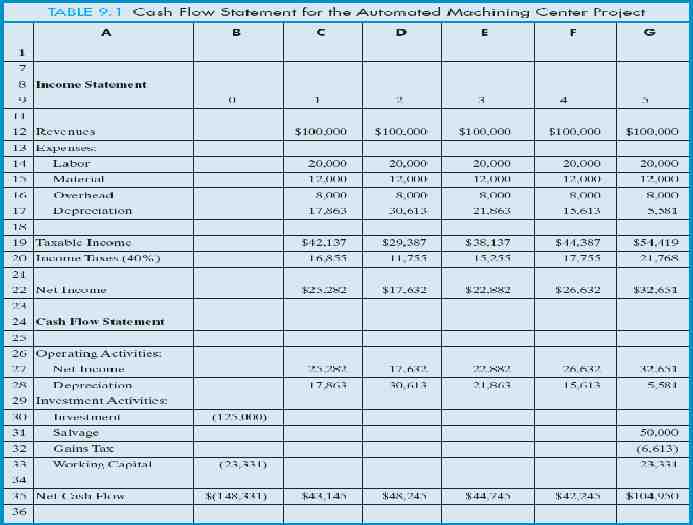
Step 3 – Create an Income Statement 1 2 100,000 100,000 Labor 20,000 20,000 20,000 20,000 20,000 Material 12,000 12,000 12,000 12,000 12,000 8,000 8,000 8,000 8,000 8,000 17,863 30,613 21,863 15,613 5,581 42,137 29,387 38,137 44,387 54,419 16,855 11,755 15,255 17,755 21,768 25,282 17,632 22,882 26,632 32,651 Income Statement Revenues 0 3 4 100,000 100,000 5 100,000 Expenses: Overhead Depreciation Taxable Income Income Taxes (40%) Net Income 18
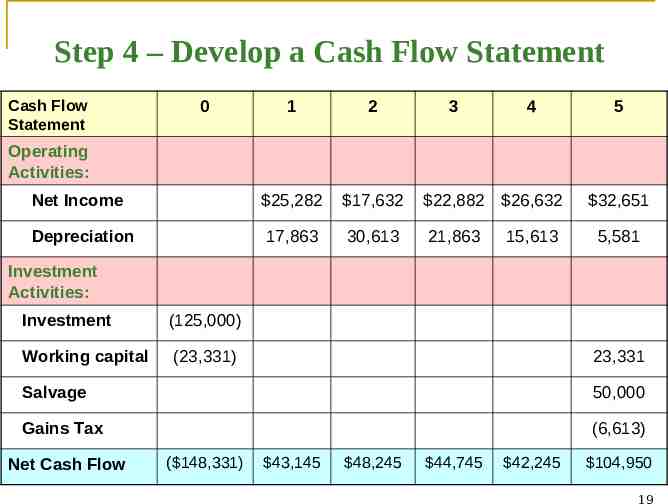
Step 4 – Develop a Cash Flow Statement Cash Flow Statement 0 1 2 3 4 Net Income 25,282 17,632 22,882 26,632 Depreciation 17,863 30,613 21,863 5 Operating Activities: 15,613 32,651 5,581 Investment Activities: Investment (125,000) Working capital (23,331) 23,331 Salvage 50,000 Gains Tax (6,613) Net Cash Flow ( 148,331) 43,145 48,245 44,745 42,245 104,950 19
20
Cash Flow Diagram including Working Capital 23,331 43,145 0 1 48,245 44,745 2 125,000 Investment in physical assets 23,331 Investment in working capital 3 Working capital recovery 81,619 42,245 4 5 23,331 23,331 0 23,331 1 23,331 2 3 4 5 Years Working capital recovery cycles 21
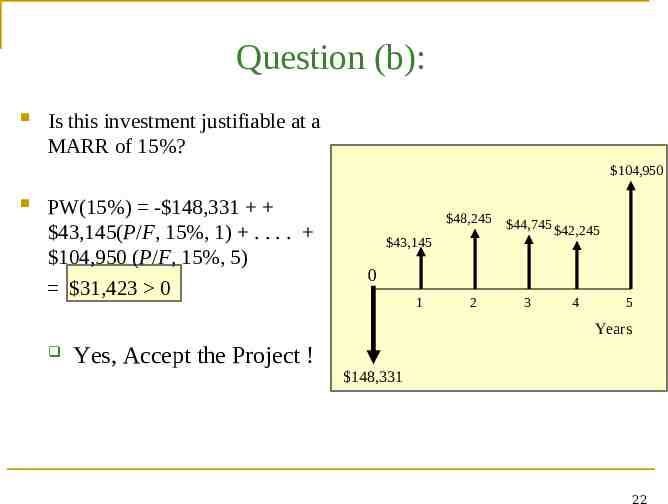
Question (b): Is this investment justifiable at a MARR of 15%? 104,950 PW(15%) - 148,331 43,145(P/F, 15%, 1) . . . . 104,950 (P/F, 15%, 5) 31,423 0 48,245 43,145 44,745 42,245 0 1 2 3 4 5 Years Yes, Accept the Project ! 148,331 22
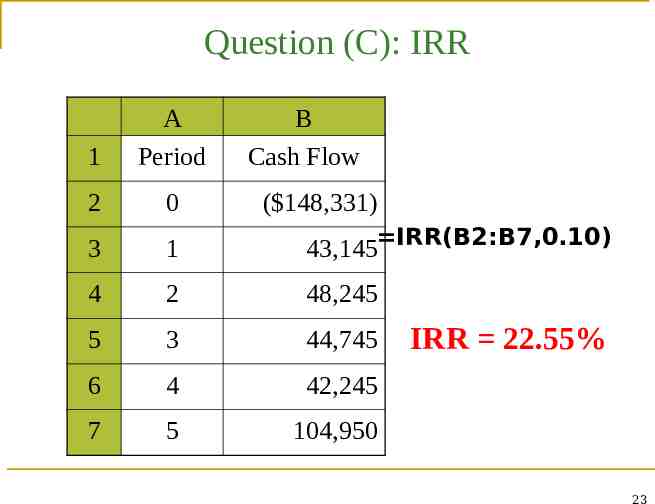
Question (C): IRR 1 A Period B Cash Flow 2 0 3 1 43,145 IRR(B2:B7,0.10) 4 2 48,245 5 3 44,745 6 4 42,245 7 5 104,950 ( 148,331) IRR 22.55% 23
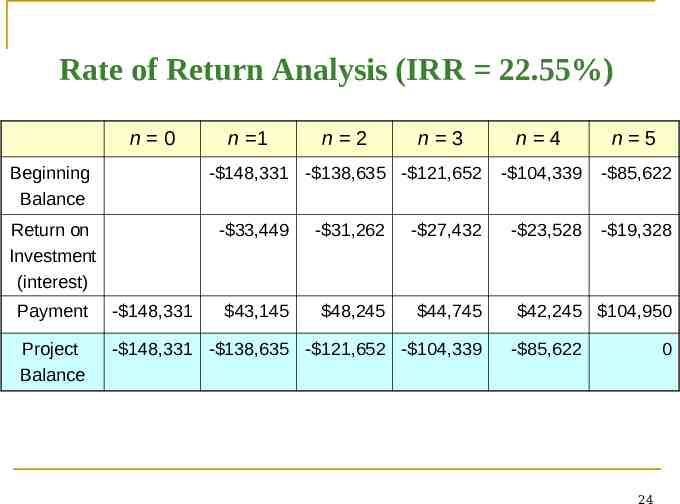
Rate of Return Analysis (IRR 22.55%) n 0 Beginning Balance n 1 n 2 n 3 - 148,331 - 138,635 - 121,652 Return on Investment (interest) - 33,449 - 31,262 - 27,432 43,145 48,245 44,745 Payment - 148,331 Project Balance - 148,331 - 138,635 - 121,652 - 104,339 n 4 n 5 - 104,339 - 85,622 - 23,528 - 19,328 42,245 104,950 - 85,622 0 24