Advancing Diversity via Graduate Admission CK Cheng and Gary

21 Slides435.00 KB
Advancing Diversity via Graduate Admission CK Cheng and Gary Cottrell UC San Diego Feb. 2012
Graduate Admission with Diversity Graduate program becomes popular with the advance of the technology and globalization. Graduate program has the flexibility for admission Diversity of graduate students is critical for education – Research Assistants – Teaching Assistants – Attendees of special topics
Outlines I. Looking for the Best Talent with an Open Mind II. An Example from 2010 CSE MS Admission III.Enriching Student Group IV.Remarks
I. Looking for the Best Talent Admission: Recruit the best talent Diversity: Recruit the best with an open mind What are our metrics? Schools, GPA, GRE, References CV, Statement
Looking for the Best Talent (2) Whom are we looking for? MS graduates MS with potential for Ph.D. program MS with potential to shine in the world The metrics for the above may not be consistent. Motivation, Perseverance Diverse Talents, Sportsmanship Leadership, Entrepreneurship
Read beyond the scores: UIC’s inadvertent experiment “There is some data that some minority students who do poorly their first year (even bad enough to be expelled or put on probation) can ultimately succeed once they've made an adjustment. One of the reasons we know this I think is because of a database glitch -- when the university changed database systems: students who should have been expelled or put on probation were not. Eventually the bug was fixed, but a surprising number of these students went on to complete degrees (which probably wouldn't have happened if the system had been working correctly).” – J. Lillis, UIC
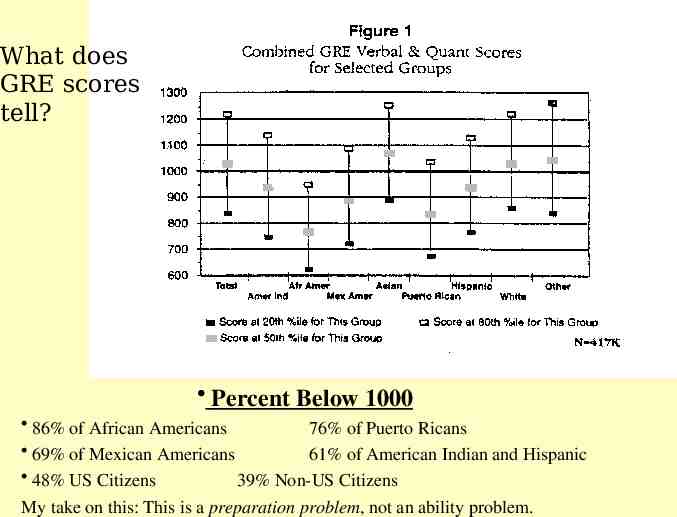
What does GRE scores tell? Percent Below 1000 86% of African Americans 76% of Puerto Ricans 69% of Mexican Americans 61% of American Indian and Hispanic 48% US Citizens 39% Non-US Citizens My take on this: This is a preparation problem, not an ability problem.
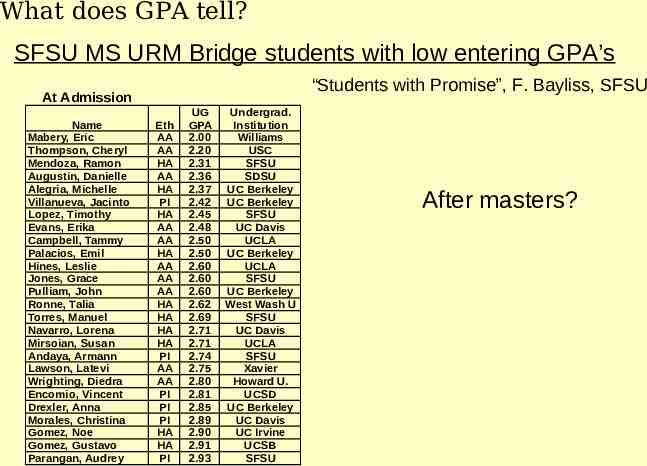
What does GPA tell? SFSU MS URM Bridge students with low entering GPA’s “Students with Promise”, F. Bayliss, SFSU At Admission Name Mabery, Eric Thompson, Cheryl Mendoza, Ramon Augustin, Danielle Alegria, Michelle Villanueva, Jacinto Lopez, Timothy Evans, Erika Campbell, Tammy Palacios, Emil Hines, Leslie Jones, Grace Pulliam, John Ronne, Talia Torres, Manuel Navarro, Lorena Mirsoian, Susan Andaya, Armann Lawson, Latevi Wrighting, Diedra Encomio, Vincent Drexler, Anna Morales, Christina Gomez, Noe Gomez, Gustavo Parangan, Audrey Eth AA AA HA AA HA PI HA AA AA HA AA AA AA HA HA HA HA PI AA AA PI PI PI HA HA PI UG GPA 2.00 2.20 2.31 2.36 2.37 2.42 2.45 2.48 2.50 2.50 2.60 2.60 2.60 2.62 2.69 2.71 2.71 2.74 2.75 2.80 2.81 2.85 2.89 2.90 2.91 2.93 Undergrad. Institution Williams USC SFSU SDSU UC Berkeley UC Berkeley SFSU UC Davis UCLA UC Berkeley UCLA SFSU UC Berkeley West Wash U SFSU UC Davis UCLA SFSU Xavier Howard U. UCSD UC Berkeley UC Davis UC Irvine UCSB SFSU After masters?
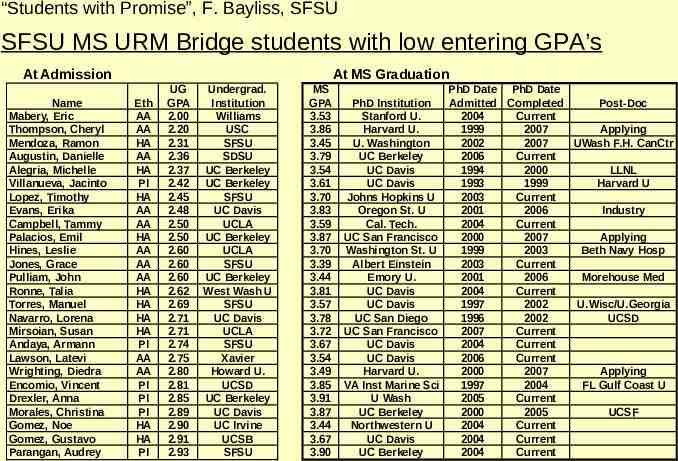
“Students with Promise”, F. Bayliss, SFSU SFSU MS URM Bridge students with low entering GPA’s At Admission Name Mabery, Eric Thompson, Cheryl Mendoza, Ramon Augustin, Danielle Alegria, Michelle Villanueva, Jacinto Lopez, Timothy Evans, Erika Campbell, Tammy Palacios, Emil Hines, Leslie Jones, Grace Pulliam, John Ronne, Talia Torres, Manuel Navarro, Lorena Mirsoian, Susan Andaya, Armann Lawson, Latevi Wrighting, Diedra Encomio, Vincent Drexler, Anna Morales, Christina Gomez, Noe Gomez, Gustavo Parangan, Audrey At MS Graduation Eth AA AA HA AA HA PI HA AA AA HA AA AA AA HA HA HA HA PI AA AA PI PI PI HA HA PI UG GPA 2.00 2.20 2.31 2.36 2.37 2.42 2.45 2.48 2.50 2.50 2.60 2.60 2.60 2.62 2.69 2.71 2.71 2.74 2.75 2.80 2.81 2.85 2.89 2.90 2.91 2.93 Undergrad. Institution Williams USC SFSU SDSU UC Berkeley UC Berkeley SFSU UC Davis UCLA UC Berkeley UCLA SFSU UC Berkeley West Wash U SFSU UC Davis UCLA SFSU Xavier Howard U. UCSD UC Berkeley UC Davis UC Irvine UCSB SFSU MS GPA 3.53 3.86 3.45 3.79 3.54 3.61 3.70 3.83 3.59 3.87 3.70 3.39 3.44 3.81 3.57 3.78 3.72 3.67 3.54 3.49 3.85 3.91 3.87 3.44 3.67 3.90 PhD Date PhD Date PhD Institution Admitted Completed Post-Doc Stanford U. 2004 Current Harvard U. 1999 2007 Applying U. Washington 2002 2007 UWash F.H. CanCtr UC Berkeley 2006 Current UC Davis 1994 2000 LLNL UC Davis 1993 1999 Harvard U Johns Hopkins U 2003 Current Oregon St. U 2001 2006 Industry Cal. Tech. 2004 Current UC San Francisco 2000 2007 Applying Washington St. U 1999 2003 Beth Navy Hosp Albert Einstein 2003 Current Emory U. 2001 2006 Morehouse Med UC Davis 2004 Current UC Davis 1997 2002 U.Wisc/U.Georgia UC San Diego 1996 2002 UCSD UC San Francisco 2007 Current UC Davis 2004 Current UC Davis 2006 Current Harvard U. 2000 2007 Applying VA Inst Marine Sci 1997 2004 FL Gulf Coast U U Wash 2005 Current UC Berkeley 2000 2005 UCSF Northwestern U 2004 Current UC Davis 2004 Current UC Berkeley 2004 Current
II. An Example from 2010 CSE MS Admission Admission with diversity makes differences Statistics of 2010 MS Admission of CSE Department, UCSD Observations
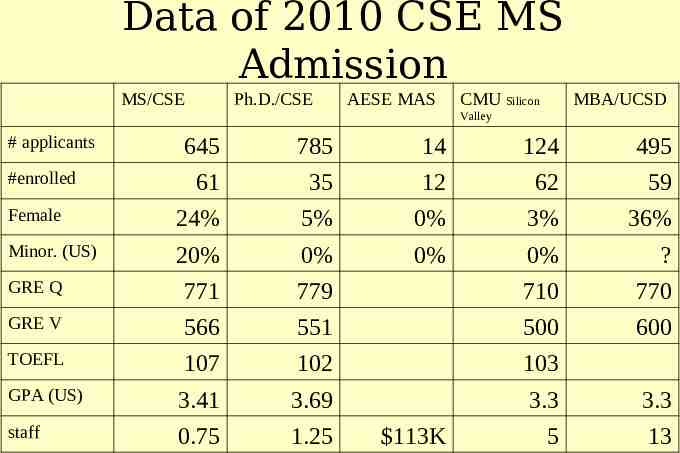
Data of 2010 CSE MS Admission MS/CSE Ph.D./CSE AESE MAS CMU Silicon MBA/UCSD Valley # applicants 645 785 14 124 495 61 35 12 62 59 Female 24% 5% 0% 3% 36% Minor. (US) 20% 0% 0% 0% ? GRE Q 771 779 710 770 GRE V 566 551 500 600 TOEFL 107 102 103 GPA (US) 3.41 3.69 3.3 3.3 staff 0.75 1.25 5 13 #enrolled 113K
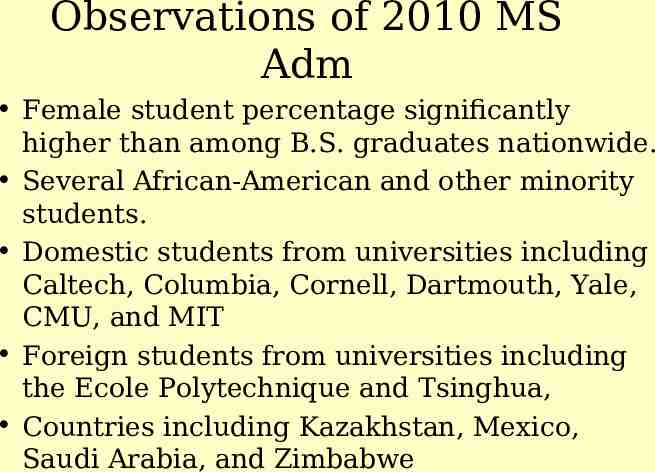
Observations of 2010 MS Adm Female student percentage significantly higher than among B.S. graduates nationwide. Several African-American and other minority students. Domestic students from universities including Caltech, Columbia, Cornell, Dartmouth, Yale, CMU, and MIT Foreign students from universities including the Ecole Polytechnique and Tsinghua, Countries including Kazakhstan, Mexico, Saudi Arabia, and Zimbabwe
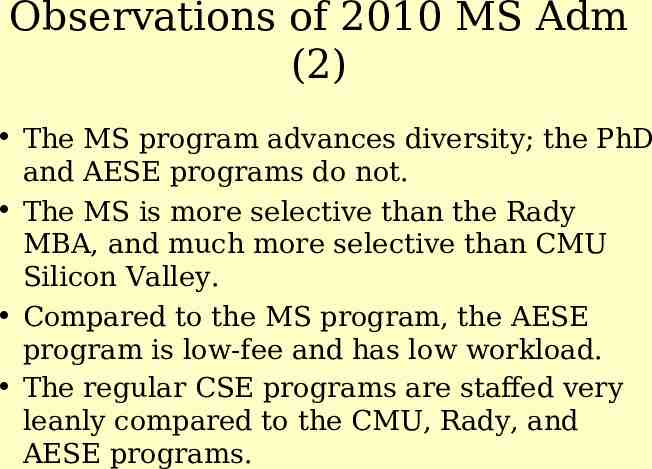
Observations of 2010 MS Adm (2) The MS program advances diversity; the PhD and AESE programs do not. The MS is more selective than the Rady MBA, and much more selective than CMU Silicon Valley. Compared to the MS program, the AESE program is low-fee and has low workload. The regular CSE programs are staffed very leanly compared to the CMU, Rady, and AESE programs.
III. Enriching Student Group Pool of Minority Students Bridge Program Diversity Admission
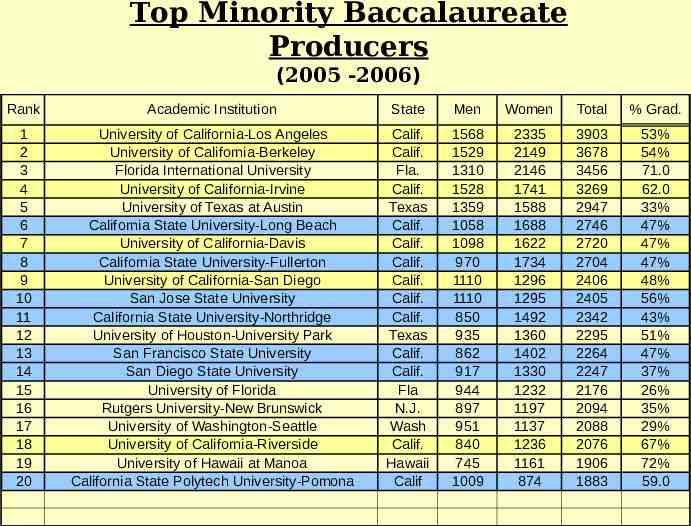
Top Minority Baccalaureate Producers (2005 -2006) Rank Academic Institution State Men Women Total % Grad. 1 2 3 4 5 6 7 8 9 10 11 12 13 14 15 16 17 18 19 20 University of California-Los Angeles University of California-Berkeley Florida International University University of California-Irvine University of Texas at Austin California State University-Long Beach University of California-Davis California State University-Fullerton University of California-San Diego San Jose State University California State University-Northridge University of Houston-University Park San Francisco State University San Diego State University University of Florida Rutgers University-New Brunswick University of Washington-Seattle University of California-Riverside University of Hawaii at Manoa California State Polytech University-Pomona Calif. Calif. Fla. Calif. Texas Calif. Calif. Calif. Calif. Calif. Calif. Texas Calif. Calif. Fla N.J. Wash Calif. Hawaii Calif 1568 1529 1310 1528 1359 1058 1098 970 1110 1110 850 935 862 917 944 897 951 840 745 1009 2335 2149 2146 1741 1588 1688 1622 1734 1296 1295 1492 1360 1402 1330 1232 1197 1137 1236 1161 874 3903 3678 3456 3269 2947 2746 2720 2704 2406 2405 2342 2295 2264 2247 2176 2094 2088 2076 1906 1883 53% 54% 71.0 62.0 33% 47% 47% 47% 48% 56% 43% 51% 47% 37% 26% 35% 29% 67% 72% 59.0
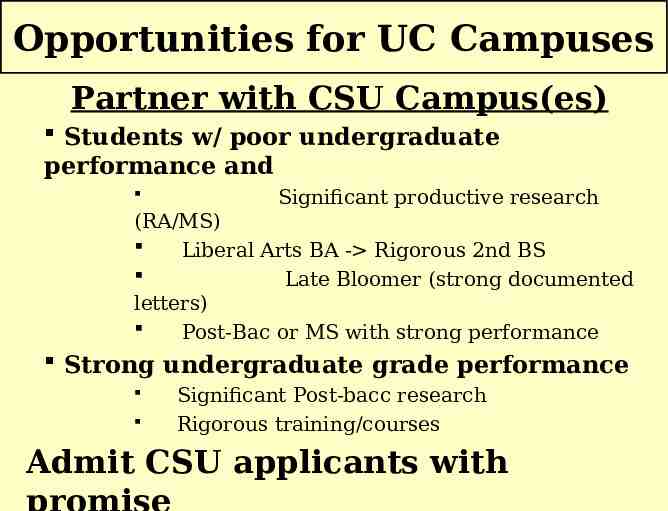
Opportunities for UC Campuses Partner with CSU Campus(es) Students w/ poor undergraduate performance and Significant productive research (RA/MS) Liberal Arts BA - Rigorous 2nd BS Late Bloomer (strong documented letters) Post-Bac or MS with strong performance Strong undergraduate grade performance Significant Post-bacc research Rigorous training/courses Admit CSU applicants with
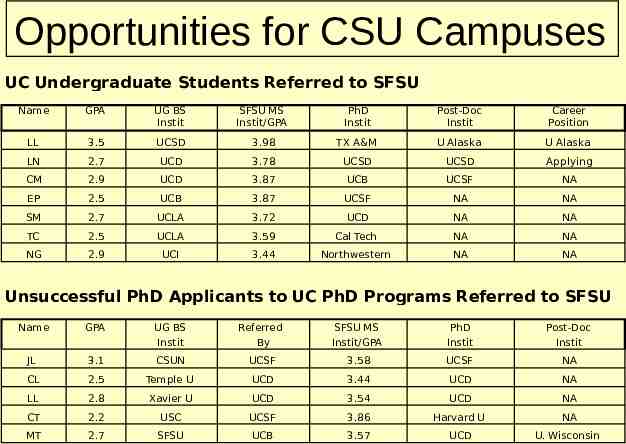
Opportunities for CSU Campuses UC Undergraduate Students Referred to SFSU Name GPA UG BS Instit SFSU MS Instit/GPA PhD Instit Post-Doc Instit Career Position LL 3.5 UCSD 3.98 TX A&M U Alaska U Alaska LN 2.7 UCD 3.78 UCSD UCSD Applying CM 2.9 UCD 3.87 UCB UCSF NA EP 2.5 UCB 3.87 UCSF NA NA SM 2.7 UCLA 3.72 UCD NA NA TC 2.5 UCLA 3.59 Cal Tech NA NA NG 2.9 UCI 3.44 Northwestern NA NA Unsuccessful PhD Applicants to UC PhD Programs Referred to SFSU Name GPA UG BS Instit Referred By SFSU MS Instit/GPA PhD Instit Post-Doc Instit JL 3.1 CSUN UCSF 3.58 UCSF NA CL 2.5 Temple U UCD 3.44 UCD NA LL 2.8 Xavier U UCD 3.54 UCD NA CT 2.2 USC UCSF 3.86 Harvard U NA MT 2.7 SFSU UCB 3.57 UCD U. Wisconsin
Admission with Diversity There is no magic: – Charles E. legal affirmative action in the sense of positive efforts to prevent inadvertent discrimination. double-checking minority and female applicant files to make sure that reviews have not been misinformed. holistic review based on whatever strengths are present in a file.
Admission with Diversity (2) Adding diversity to our program is a strength, but diversity includes anything out of the majority, such as a double major in music, being a veteran, being a refugee, being from Goldman Sachs. Overcoming obstacles is also a strength, e.g. graduating from a hearing college despite being deaf, or despite having been a foster child. – Charles E.
IV. Remark Create the best 2012 MS class – Look for the best with an open mind – Enrich the student group MS admission makes huge differences for our Department. – – – – Pool for Ph.D. program MS thesis for research Pool for Teaching Assistants Attendees for special subjects Diversity helps us all – Funding, Promotion, Education
Thank you for your attention! Best Wishes for 2012 Admission!