ECONOMIC IMPACT OF TOURISM IN KANSAS 2019 Prepared for: Kansas


39 Slides7.29 MB
ECONOMIC IMPACT OF TOURISM IN KANSAS 2019 Prepared for: Kansas Department of Wildlife, Parks and Tourism W W W. T O U R I S M E C O N O M I C S . C O M
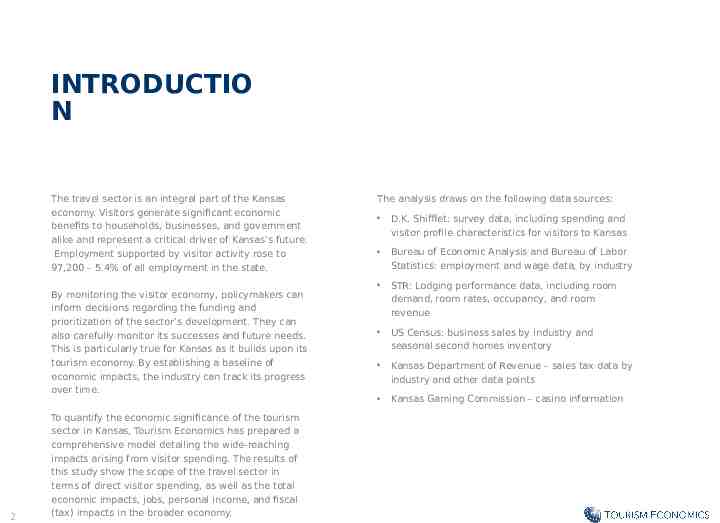
INTRODUCTIO N The travel sector is an integral part of the Kansas economy. Visitors generate significant economic benefits to households, businesses, and government alike and represent a critical driver of Kansas’s future. Employment supported by visitor activity rose to 97,200 – 5.4% of all employment in the state. By monitoring the visitor economy, policymakers can inform decisions regarding the funding and prioritization of the sector’s development. They can also carefully monitor its successes and future needs. This is particularly true for Kansas as it builds upon its tourism economy. By establishing a baseline of economic impacts, the industry can track its progress over time. 2 To quantify the economic significance of the tourism sector in Kansas, Tourism Economics has prepared a comprehensive model detailing the wide-reaching impacts arising from visitor spending. The results of this study show the scope of the travel sector in terms of direct visitor spending, as well as the total economic impacts, jobs, personal income, and fiscal (tax) impacts in the broader economy. The analysis draws on the following data sources: D.K. Shifflet: survey data, including spending and visitor profile characteristics for visitors to Kansas Bureau of Economic Analysis and Bureau of Labor Statistics: employment and wage data, by industry STR: Lodging performance data, including room demand, room rates, occupancy, and room revenue US Census: business sales by industry and seasonal second homes inventory Kansas Department of Revenue – sales tax data by industry and other data points Kansas Gaming Commission – casino information
KEY FINDINGS
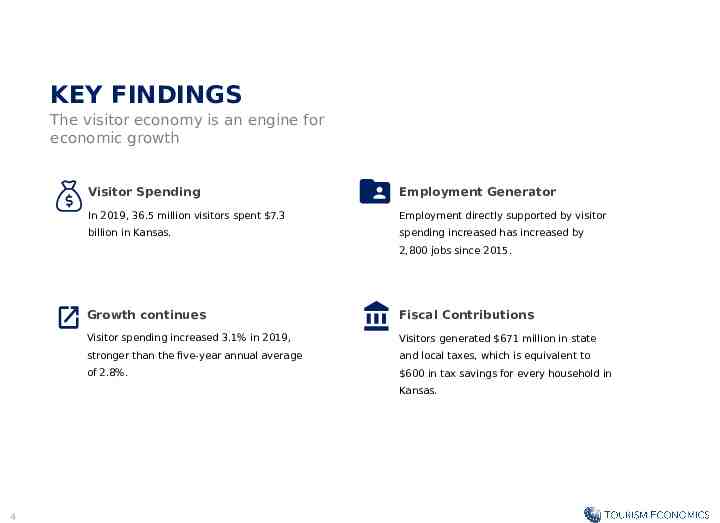
KEY FINDINGS The visitor economy is an engine for economic growth Visitor Spending Employment Generator In 2019, 36.5 million visitors spent 7.3 Employment directly supported by visitor billion in Kansas. spending increased has increased by 2,800 jobs since 2015. Growth continues Fiscal Contributions Visitor spending increased 3.1% in 2019, Visitors generated 671 million in state stronger than the five-year annual average and local taxes, which is equivalent to of 2.8%. 600 in tax savings for every household in Kansas. 4
VISITATION AND SPENDING
VISITOR SPENDING TRENDS Continued growth in 2019 Visitation increased by 1 million visitors in 2019 Growth in visitation and spending This represents both the largest increase and strongest growth in visitation since 2013 Kansas tourism indicators accelerated in 2019. overnight leisure visitors, the latter of which Visitor spending growth continued in 2019 Visitor spending growth increased 3.1% in was supported by a surge in room demand. 2019 to reach 7.3 billion. Visitation growth was led by both day and Visitation growth supported overall spending growth in the state. Increases in food and lodging spending supported overall growth Visitor spending on food & beverages increased by 4.7% in 2019, leading all categories. 6
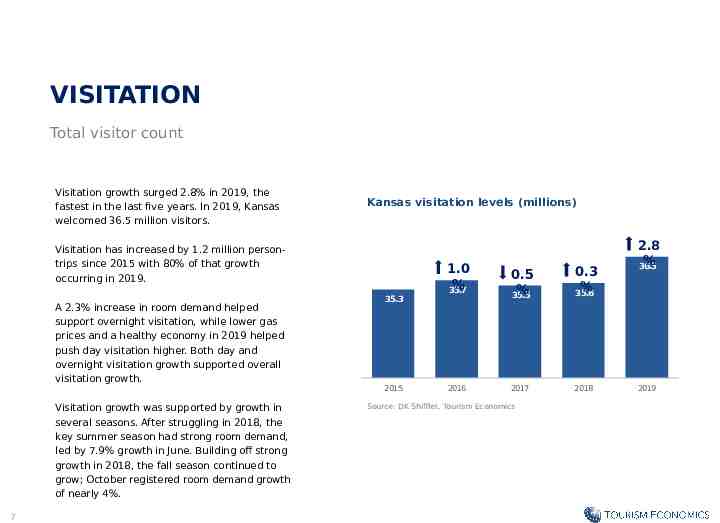
VISITATION Total visitor count Visitation growth surged 2.8% in 2019, the fastest in the last five years. In 2019, Kansas welcomed 36.5 million visitors. Kansas visitation levels (millions) Visitation has increased by 1.2 million persontrips since 2015 with 80% of that growth occurring in 2019. A 2.3% increase in room demand helped support overnight visitation, while lower gas prices and a healthy economy in 2019 helped push day visitation higher. Both day and overnight visitation growth supported overall visitation growth. Visitation growth was supported by growth in several seasons. After struggling in 2018, the key summer season had strong room demand, led by 7.9% growth in June. Building off strong growth in 2018, the fall season continued to grow; October registered room demand growth of nearly 4%. 7 35.3 2015 1.0 % 35.7 2016 0.5 % 35.5 0.3 % 35.6 2017 2018 Source: DK Shifflet, Tourism Economics 2.8 % 36.5 2019
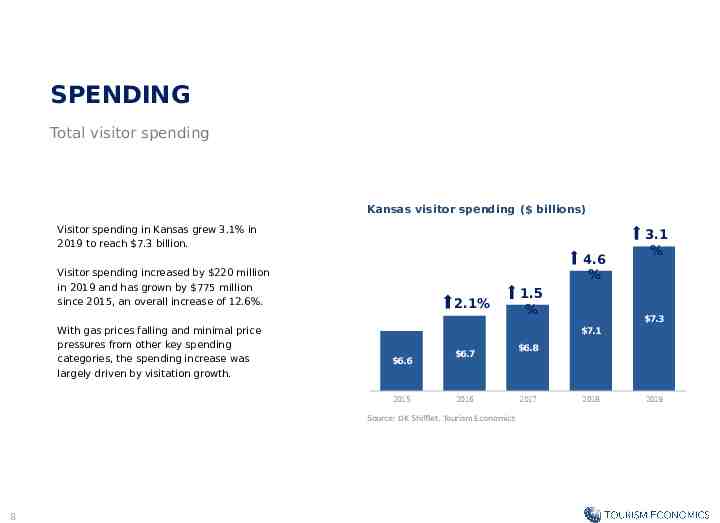
SPENDING Total visitor spending Kansas visitor spending ( billions) Visitor spending in Kansas grew 3.1% in 2019 to reach 7.3 billion. 4.6 % Visitor spending increased by 220 million in 2019 and has grown by 775 million since 2015, an overall increase of 12.6%. With gas prices falling and minimal price pressures from other key spending categories, the spending increase was largely driven by visitation growth. 2.1% 7.3 7.1 6.6 2015 6.7 2016 Source: DK Shifflet, Tourism Economics 8 1.5 % 3.1 % 6.8 2017 2018 2019
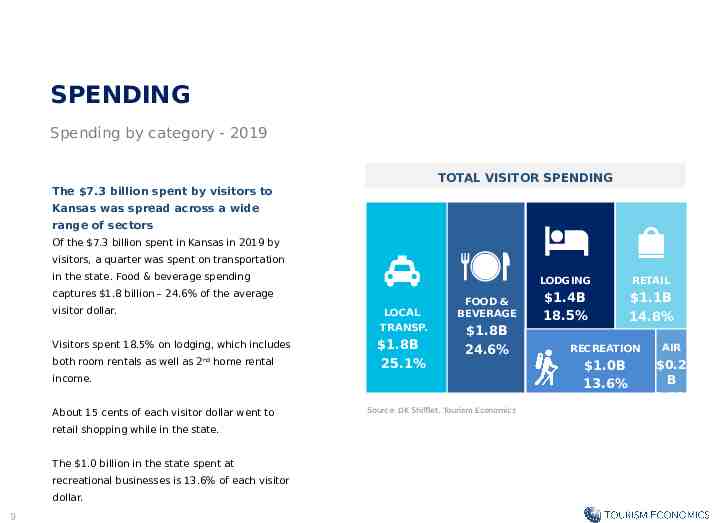
SPENDING Spending by category - 2019 TOTAL VISITOR SPENDING The 7.3 billion spent by visitors to Kansas was spread across a wide range of sectors Of the 7.3 billion spent in Kansas in 2019 by visitors, a quarter was spent on transportation in the state. Food & beverage spending captures 1.8 billion – 24.6% of the average visitor dollar. LOCAL TRANSP. Visitors spent 18.5% on lodging, which includes both room rentals as well as 2 nd home rental 1.8B 25.1% FOOD & BEVERAGE 1.8B 24.6% income. About 15 cents of each visitor dollar went to retail shopping while in the state. The 1.0 billion in the state spent at recreational businesses is 13.6% of each visitor dollar. 9 Source: DK Shifflet, Tourism Economics LODGING RETAIL 1.4B 18.5% 1.1B 14.8% RECREATION AIR 1.0B 13.6% 0.2 B 3.3%
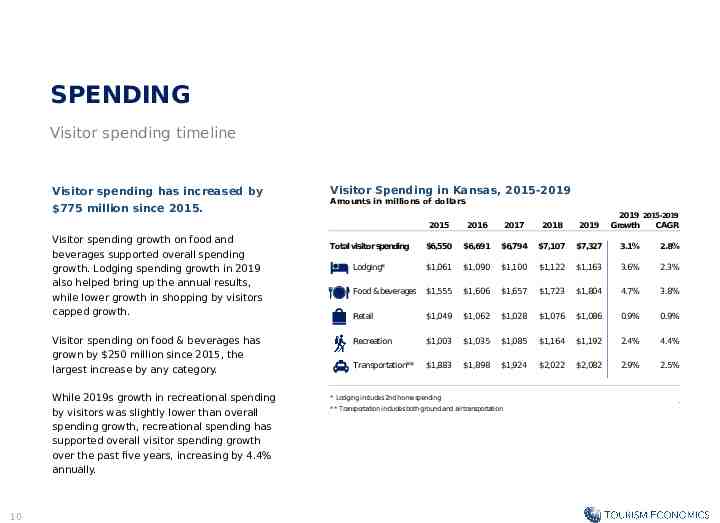
SPENDING Visitor spending timeline Visitor spending has increased by 775 million since 2015. Visitor spending growth on food and beverages supported overall spending growth. Lodging spending growth in 2019 also helped bring up the annual results, while lower growth in shopping by visitors capped growth. Visitor spending on food & beverages has grown by 250 million since 2015, the largest increase by any category. While 2019s growth in recreational spending by visitors was slightly lower than overall spending growth, recreational spending has supported overall visitor spending growth over the past five years, increasing by 4.4% annually. 10 Visitor Spending in Kansas, 2015-2019 Amounts in millions of dollars 2019 2015-2019 Growth CAGR 2015 2016 2017 2018 2019 Total visitor spending 6,550 6,691 6,794 7,107 7,327 3.1% 2.8% Lodging* 1,061 1,090 1,100 1,122 1,163 3.6% 2.3% Food & beverages 1,555 1,606 1,657 1,723 1,804 4.7% 3.8% Retail 1,049 1,062 1,028 1,076 1,086 0.9% 0.9% Recreation 1,003 1,035 1,085 1,164 1,192 2.4% 4.4% Transportation** 1,883 1,898 1,924 2,022 2,082 2.9% 2.5% * Lodging includes 2nd home spending ** Transportation includes both ground and air transportation
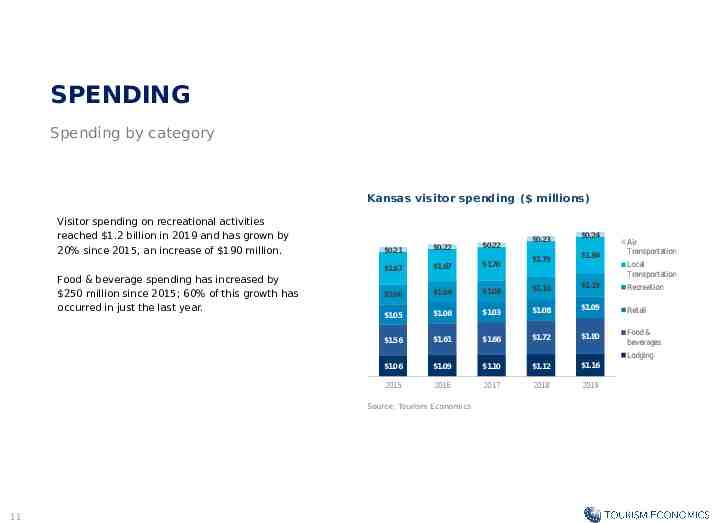
SPENDING Spending by category Kansas visitor spending ( millions) Visitor spending on recreational activities reached 1.2 billion in 2019 and has grown by 20% since 2015, an increase of 190 million. Food & beverage spending has increased by 250 million since 2015; 60% of this growth has occurred in just the last year. 0.21 0.22 0.22 1.67 1.67 1.70 1.00 1.04 1.05 0.23 0.24 Air Transportation 1.79 1.84 1.08 1.16 1.19 Recreation 1.06 1.03 1.08 1.09 Retail 1.56 1.61 1.66 1.72 1.80 Food & beverages 1.06 1.09 1.10 1.12 1.16 2015 2016 2017 2018 2019 Local Transportation Lodging Source: Tourism Economics 11
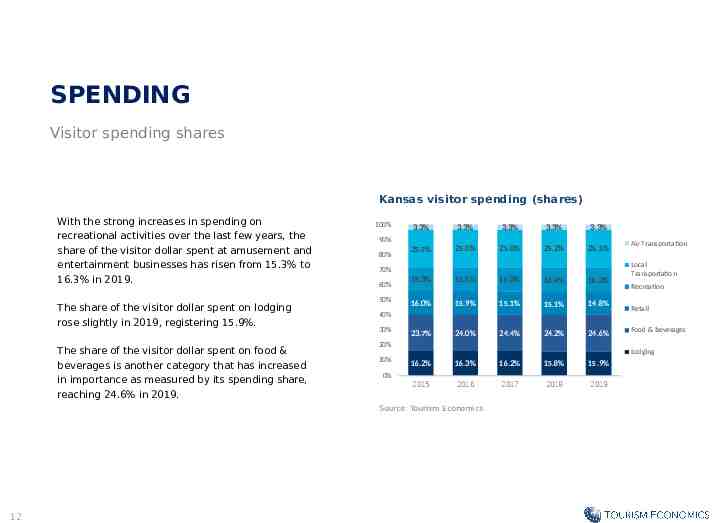
SPENDING Visitor spending shares Kansas visitor spending (shares) With the strong increases in spending on recreational activities over the last few years, the share of the visitor dollar spent at amusement and entertainment businesses has risen from 15.3% to 16.3% in 2019. The share of the visitor dollar spent on lodging rose slightly in 2019, registering 15.9%. The share of the visitor dollar spent on food & beverages is another category that has increased in importance as measured by its spending share, reaching 24.6% in 2019. 100% 3.3% 3.3% 3.3% 3.3% 3.3% 25.5% 25.0% 25.0% 25.2% 25.1% 90% 80% 70% 60% 50% 15.3% 15.5% 16.0% 16.4% 16.3% 16.0% 15.9% 15.1% 15.1% 14.8% 23.7% 24.0% 24.4% 24.2% 24.6% 16.2% 16.3% 16.2% 15.8% 15.9% 2015 2016 2017 2018 2019 40% 30% 20% 10% Local Transportation Recreation Retail Food & beverages Lodging 0% Source: Tourism Economics 12 Air Transportation
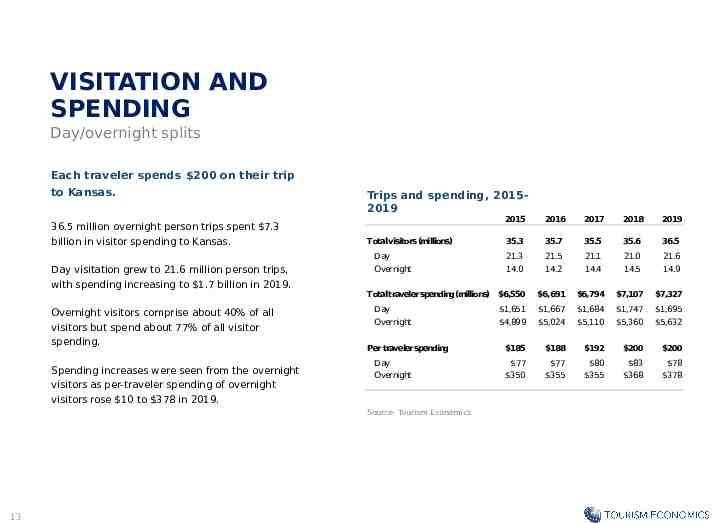
VISITATION AND SPENDING Day/overnight splits Each traveler spends 200 on their trip to Kansas. 36.5 million overnight person trips spent 7.3 billion in visitor spending to Kansas. Day visitation grew to 21.6 million person trips, with spending increasing to 1.7 billion in 2019. Overnight visitors comprise about 40% of all visitors but spend about 77% of all visitor spending. Spending increases were seen from the overnight visitors as per-traveler spending of overnight visitors rose 10 to 378 in 2019. Trips and spending, 20152019 Amounts in nominal dollars and number 2015 2016 of visitors 2017 2018 2019 Total visitors (millions) Day Overnight 35.7 35.5 35.6 36.5 21.3 14.0 21.5 14.2 21.1 14.4 21.0 14.5 21.6 14.9 Total traveler spending(millions) 6,550 Day Overnight Per traveler spending Day Overnight Source: Tourism Economics 13 35.3 6,691 6,794 7,107 7,327 1,651 4,899 1,667 5,024 1,684 5,110 1,747 5,360 1,695 5,632 185 188 192 200 200 77 350 77 355 80 355 83 368 78 378
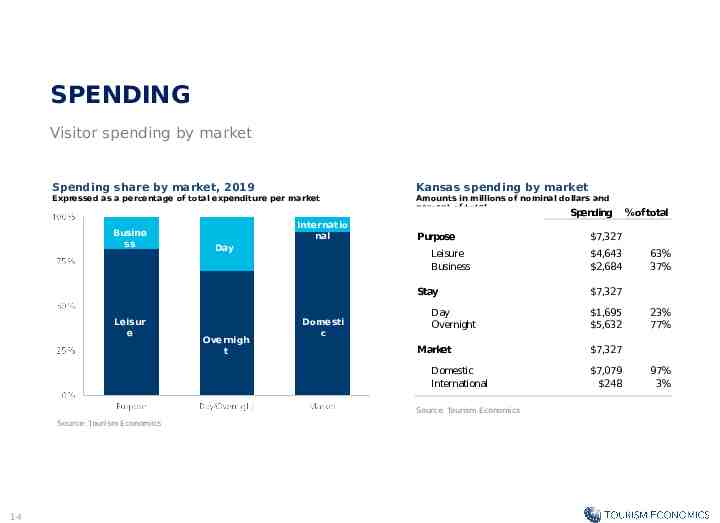
SPENDING Visitor spending by market Spending share by market, 2019 Kansas spending by market Expressed as a percentage of total expenditure per market Amounts in millions of nominal dollars and percent of total Spending Busine ss Internatio nal Day Purpose Leisure Business Stay Leisur e Overnigh t Domesti c Day Overnight Market Domestic International Source: Tourism Economics Source: Tourism Economics 14 %of total 7,327 4,643 2,684 63% 37% 7,327 1,695 5,632 23% 77% 7,327 7,079 248 97% 3%
TOURISM ECONOMY
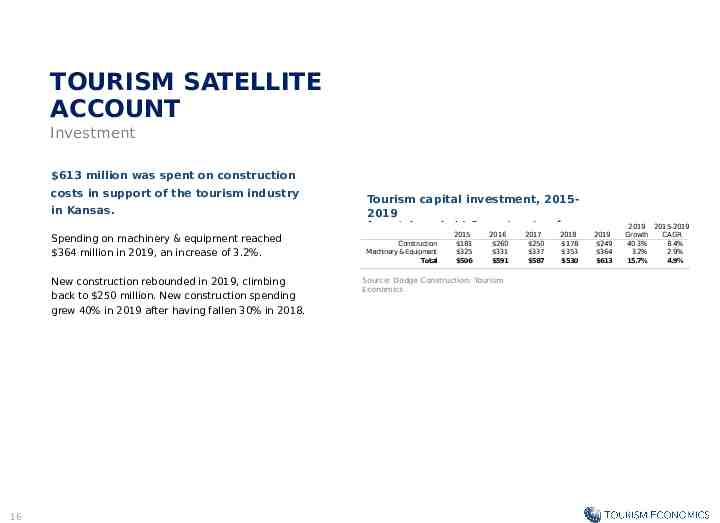
TOURISM SATELLITE ACCOUNT Investment 613 million was spent on construction costs in support of the tourism industry in Kansas. Spending on machinery & equipment reached 364 million in 2019, an increase of 3.2%. New construction rebounded in 2019, climbing back to 250 million. New construction spending grew 40% in 2019 after having fallen 30% in 2018. 16 Tourism capital investment, 20152019 Amounts in nominal dollars and number of visitors 2015 2016 2017 2018 Construction Machinery & Equipment Total 181 325 506 260 331 591 Source: Dodge Construction; Tourism Economics 250 337 587 178 353 530 2019 249 364 613 2019 2015-2019 Growth CAGR 40.3% 8.4% 3.2% 2.9% 15.7% 4.9%
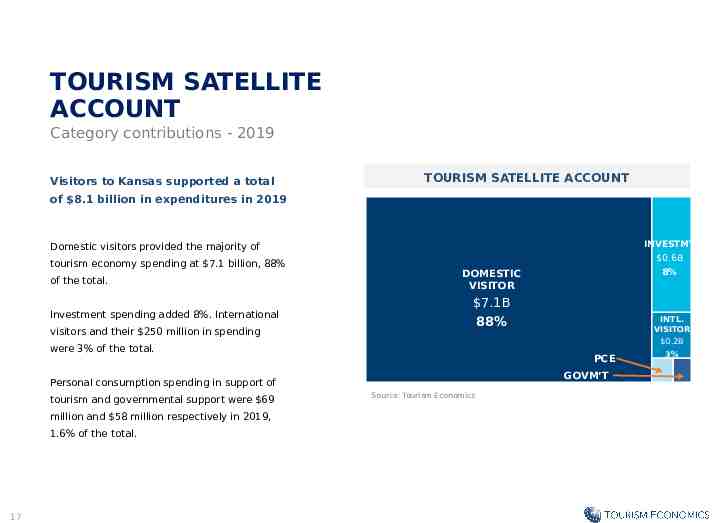
TOURISM SATELLITE ACCOUNT Category contributions - 2019 Visitors to Kansas supported a total TOURISM SATELLITE ACCOUNT of 8.1 billion in expenditures in 2019 INVESTMT Domestic visitors provided the majority of tourism economy spending at 7.1 billion, 88% of the total. Investment spending added 8%. International visitors and their 250 million in spending 0.6B 7.1B 88% PCE GOVM’T Personal consumption spending in support of million and 58 million respectively in 2019, 1.6% of the total. 17 INTL. VISITOR 0.2B were 3% of the total. tourism and governmental support were 69 8% DOMESTIC VISITOR Source: Tourism Economics 3%
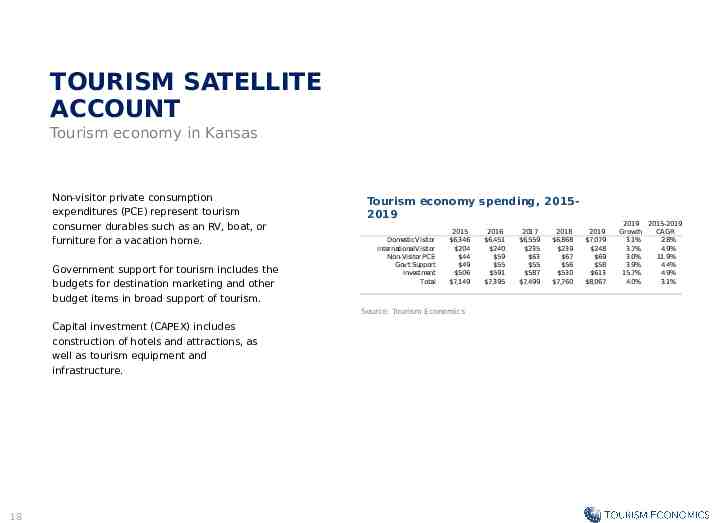
TOURISM SATELLITE ACCOUNT Tourism economy in Kansas Non-visitor private consumption expenditures (PCE) represent tourism consumer durables such as an RV, boat, or furniture for a vacation home. Government support for tourism includes the budgets for destination marketing and other budget items in broad support of tourism. Tourism economy spending, 20152019 Amounts in nominal dollars Domestic Visitor International Visitor Non-Visitor PCE Gov't Support Investment Total 2015 6,346 204 44 49 506 7,149 Source: Tourism Economics Capital investment (CAPEX) includes construction of hotels and attractions, as well as tourism equipment and infrastructure. 18 2016 6,451 240 59 55 591 7,395 2017 6,559 235 63 55 587 7,499 2018 6,868 239 67 56 530 7,760 2019 7,079 248 69 58 613 8,067 2019 2015-2019 Growth CAGR 3.1% 2.8% 3.7% 4.9% 3.0% 11.9% 3.9% 4.4% 15.7% 4.9% 4.0% 3.1%
DIRECT IMPACTS
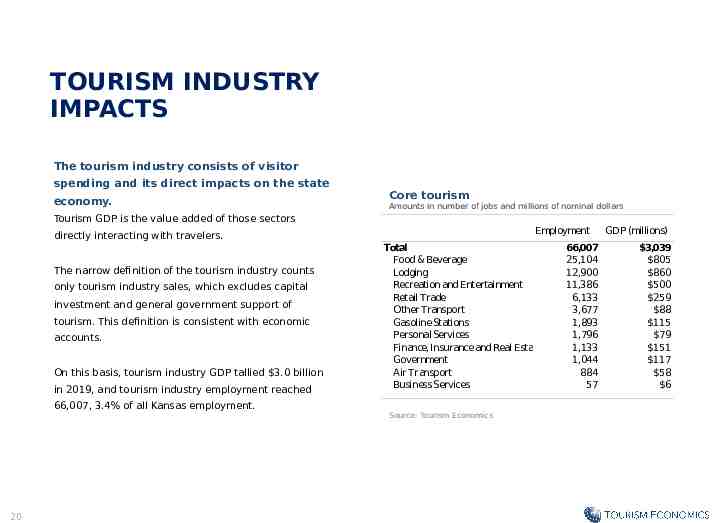
TOURISM INDUSTRY IMPACTS The tourism industry consists of visitor spending and its direct impacts on the state economy. Core tourism Amounts in number of jobs and millions of nominal dollars Tourism GDP is the value added of those sectors directly interacting with travelers. The narrow definition of the tourism industry counts only tourism industry sales, which excludes capital investment and general government support of tourism. This definition is consistent with economic accounts. On this basis, tourism industry GDP tallied 3.0 billion in 2019, and tourism industry employment reached 66,007, 3.4% of all Kansas employment. 20 Employment Total Food & Beverage Lodging Recreation and Entertainment Retail Trade Other Transport Gasoline Stations Personal Services Finance, Insurance and Real Estate Government Air Transport Business Services Source: Tourism Economics 66,007 25,104 12,900 11,386 6,133 3,677 1,893 1,796 1,133 1,044 884 57 GDP (millions) 3,039 805 860 500 259 88 115 79 151 117 58 6
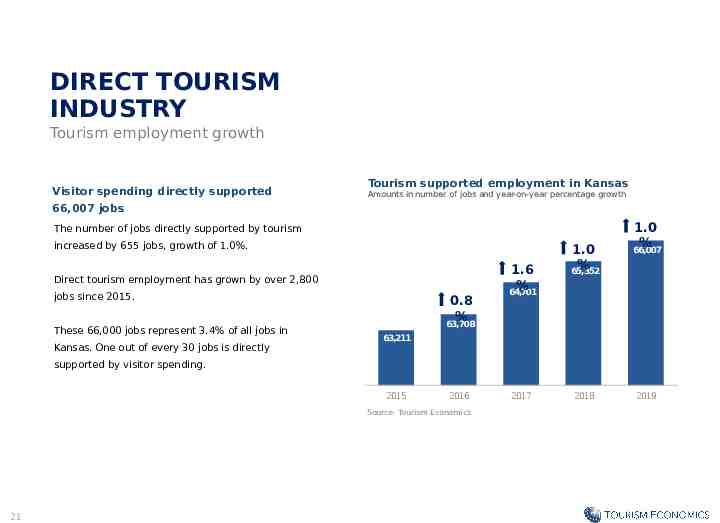
DIRECT TOURISM INDUSTRY Tourism employment growth Visitor spending directly supported Tourism supported employment in Kansas Amounts in number of jobs and year-on-year percentage growth 66,007 jobs The number of jobs directly supported by tourism increased by 655 jobs, growth of 1.0%. Direct tourism employment has grown by over 2,800 jobs since 2015. These 66,000 jobs represent 3.4% of all jobs in Kansas. One out of every 30 jobs is directly 0.8 % 63,708 1.6 % 64,701 1.0 % 65,352 1.0 % 66,007 63,211 supported by visitor spending. 2015 2016 Source: Tourism Economics 21 2017 2018 2019
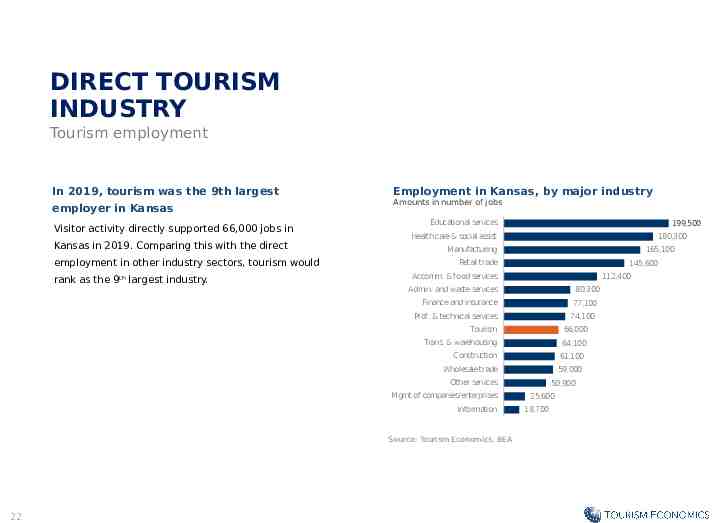
DIRECT TOURISM INDUSTRY Tourism employment In 2019, tourism was the 9th largest employer in Kansas Visitor activity directly supported 66,000 jobs in Kansas in 2019. Comparing this with the direct employment in other industry sectors, tourism would rank as the 9 largest industry. th Employment in Kansas, by major industry Amounts in number of jobs Educational services 199,500 Health care & social assist 180,300 Manufacturing 165,100 Retail trade 145,600 Accomm. & food services 112,400 Admin. and waste services 80,300 Finance and insurance 77,100 Prof. & technical services 74,100 Tourism 66,000 Trans. & warehousing 64,100 Construction 61,100 Wholesale trade 59,000 Other services Mgmt of companies/enterprises Information Source: Tourism Economics, BEA 22 50,900 25,600 18,700
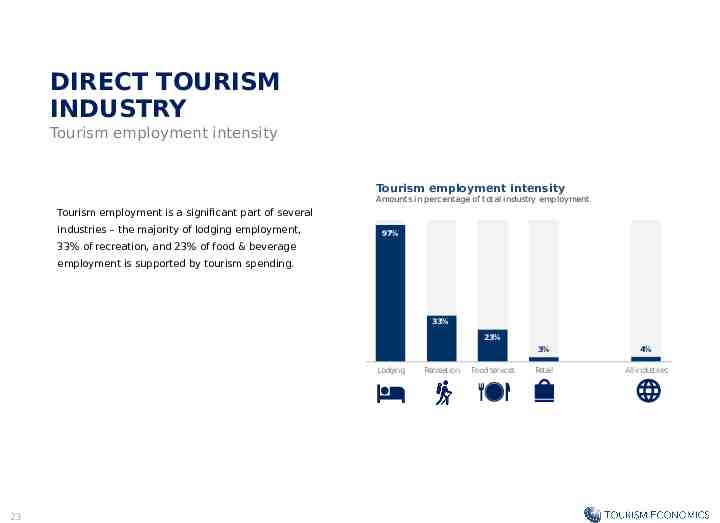
DIRECT TOURISM INDUSTRY Tourism employment intensity Tourism employment intensity Amounts in percentage of total industry employment Tourism employment is a significant part of several industries – the majority of lodging employment, 97% 33% of recreation, and 23% of food & beverage employment is supported by tourism spending. 33% 23% Lodging 23 Recreation Food services 3% 4% Retail All industries
ECONOMIC IMPACTS
ECONOMIC IMPACTS How visitor spending generates employment and income Our analysis of tourism's impact on 1. Direct Impacts: Visitors create Kansas begins with actual spending by direct economic value within a visitors, but also considers the discreet group of sectors (e.g. downstream effects of this injection of recreation, transportation). This spending into the local economy. To supports a relative proportion of determine the total economic impact of jobs, wages, taxes, and GDP within tourism in Kansas, we input visitor each sector. spending into a model of the Kansas economy created in IMPLAN. This move calculates three distinct types of impact: direct, indirect, and induced. 2. Indirect Impacts: Each directly affected sector also purchases goods and services as inputs (e.g. food wholesalers, utilities) into The impacts on business sales, jobs, production. These impacts are wages, and taxes are calculated for all called indirect impacts. three levels of impact. 3. Induced Impacts: Lastly, the induced impact is generated when employees whose wages are 25 generated wither directly or
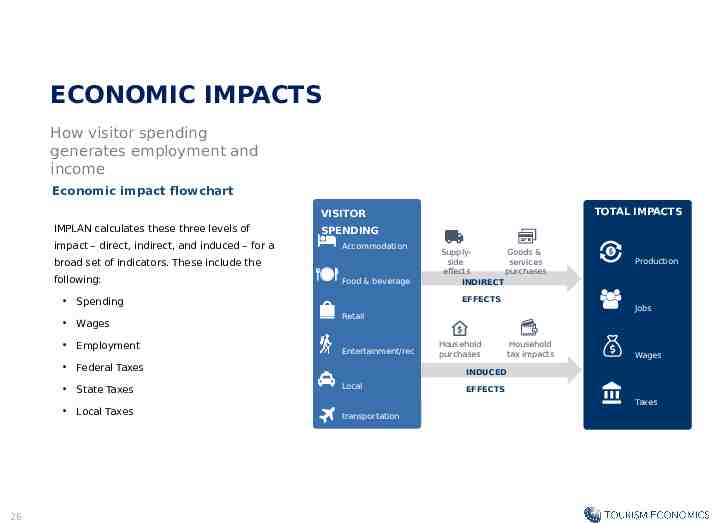
ECONOMIC IMPACTS How visitor spending generates employment and income Economic impact flowchart TOTAL IMPACTS VISITOR IMPLAN calculates these three levels of impact – direct, indirect, and induced – for a SPENDING Accommodation broad set of indicators. These include the following: Food & beverage EFFECTS Spending Wages Employment Entertainment/rec Local Taxes Household tax impacts Wages INDUCED Local EFFECTS Taxes transportation Air transportation 26 Household purchases Production Jobs Retail Federal Taxes State Taxes SupplyGoods & side services effects purchases INDIRECT
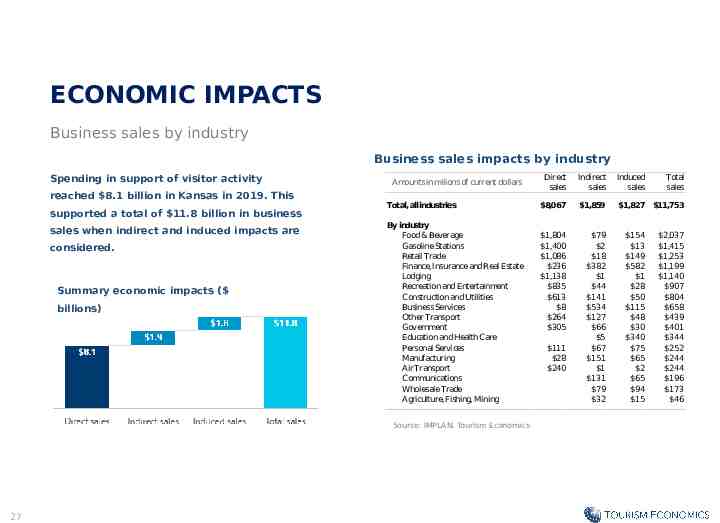
ECONOMIC IMPACTS Business sales by industry Business sales impacts by industry Spending in support of visitor activity reached 8.1 billion in Kansas in 2019. This supported a total of 11.8 billion in business sales when indirect and induced impacts are considered. Summary economic impacts ( billions) Amounts in milions of current dollars Total, all industries By industry Food & Beverage Gasoline Stations Retail Trade Finance, Insurance and Real Estate Lodging Recreation and Entertainment Construction and Utilities Business Services Other Transport Government Education and Health Care Personal Services Manufacturing Air Transport Communications Wholesale Trade Agriculture, Fishing, Mining Source: IMPLAN, Tourism Economics 27 Direct sales Indirect sales Induced sales 8,067 1,859 1,827 11,753 1,804 1,400 1,086 236 1,138 835 613 8 264 305 79 2 18 382 1 44 141 534 127 66 5 67 151 1 131 79 32 111 28 240 154 13 149 582 1 28 50 115 48 30 340 75 65 2 65 94 15 Total sales 2,037 1,415 1,253 1,199 1,140 907 804 658 439 401 344 252 244 244 196 173 46
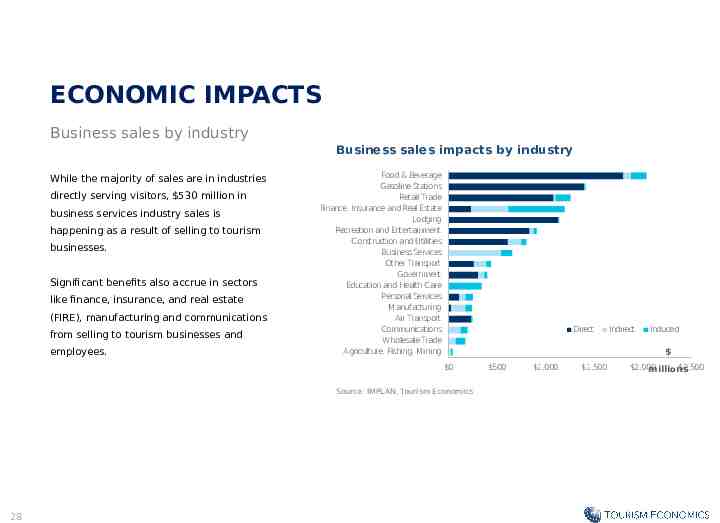
ECONOMIC IMPACTS Business sales by industry Business sales impacts by industry While the majority of sales are in industries directly serving visitors, 530 million in business services industry sales is happening as a result of selling to tourism businesses. Significant benefits also accrue in sectors like finance, insurance, and real estate (FIRE), manufacturing and communications from selling to tourism businesses and employees. Food & Beverage Gasoline Stations Retail Trade Finance, Insurance and Real Estate Lodging Recreation and Entertainment Construction and Utilities Business Services Other Transport Government Education and Health Care Personal Services Manufacturing Air Transport Communications Wholesale Trade Agriculture, Fishing, Mining Direct Induced 0 Source: IMPLAN, Tourism Economics 28 Indirect 500 1,000 1,500 2,000 2,500 millions
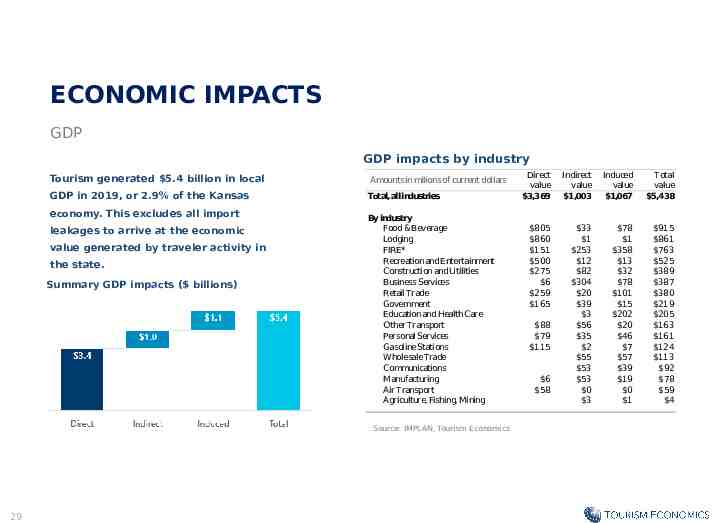
ECONOMIC IMPACTS GDP GDP impacts by industry Tourism generated 5.4 billion in local Amounts in milions of current dollars GDP in 2019, or 2.9% of the Kansas Total, all industries economy. This excludes all import leakages to arrive at the economic value generated by traveler activity in the state. Summary GDP impacts ( billions) By industry Food & Beverage Lodging FIRE* Recreation and Entertainment Construction and Utilities Business Services Retail Trade Government Education and Health Care Other Transport Personal Services Gasoline Stations Wholesale Trade Communications Manufacturing Air Transport Agriculture, Fishing, Mining Source: IMPLAN, Tourism Economics 29 Direct value 3,369 Indirect value 1,003 Induced value 1,067 Total value 5,438 805 860 151 500 275 6 259 165 33 1 253 12 82 304 20 39 3 56 35 2 55 53 53 0 3 78 1 358 13 32 78 101 15 202 20 46 7 57 39 19 0 1 915 861 763 525 389 387 380 219 205 163 161 124 113 92 78 59 4 88 79 115 6 58
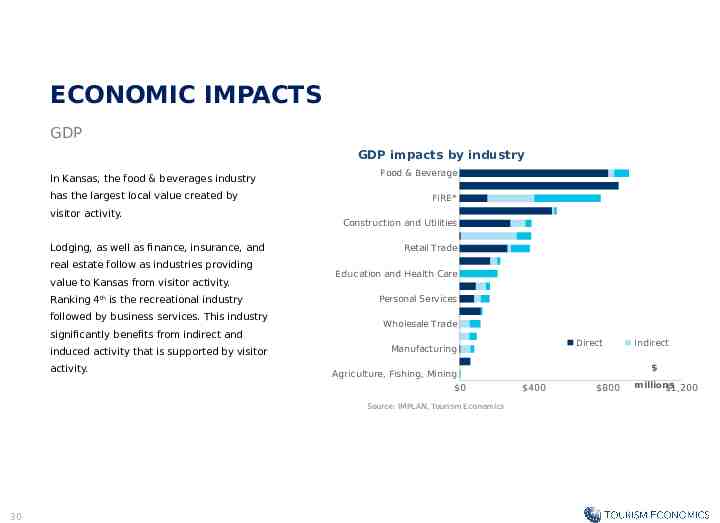
ECONOMIC IMPACTS GDP GDP impacts by industry In Kansas, the food & beverages industry has the largest local value created by visitor activity. Lodging, as well as finance, insurance, and real estate follow as industries providing value to Kansas from visitor activity. Ranking 4th is the recreational industry followed by business services. This industry significantly benefits from indirect and induced activity that is supported by visitor activity. Food & Beverage FIRE* Construction and Utilities Retail Trade Education and Health Care Personal Services Wholesale Trade Source: IMPLAN, Tourism Economics Indirect Agriculture, Fishing, Mining 0 30 Direct Manufacturing 400 800 millions 1,200
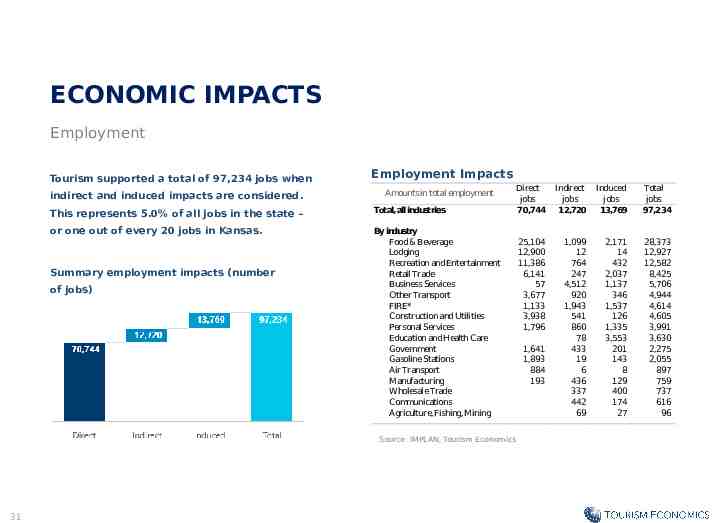
ECONOMIC IMPACTS Employment Tourism supported a total of 97,234 jobs when indirect and induced impacts are considered. Employment Impacts Amounts in total employment This represents 5.0% of all jobs in the state – Total, all industries or one out of every 20 jobs in Kansas. By industry Food & Beverage Lodging Recreation and Entertainment Retail Trade Business Services Other Transport FIRE* Construction and Utilities Personal Services Education and Health Care Government Gasoline Stations Air Transport Manufacturing Wholesale Trade Communications Agriculture, Fishing, Mining Summary employment impacts (number of jobs) Source: IMPLAN, Tourism Economics 31 Direct jobs 70,744 Indirect jobs 12,720 Induced jobs 13,769 Total jobs 97,234 25,104 12,900 11,386 6,141 57 3,677 1,133 3,938 1,796 1,099 12 764 247 4,512 920 1,943 541 860 78 433 19 6 436 337 442 69 2,171 14 432 2,037 1,137 346 1,537 126 1,335 3,553 201 143 8 129 400 174 27 28,373 12,927 12,582 8,425 5,706 4,944 4,614 4,605 3,991 3,630 2,275 2,055 897 759 737 616 96 1,641 1,893 884 193
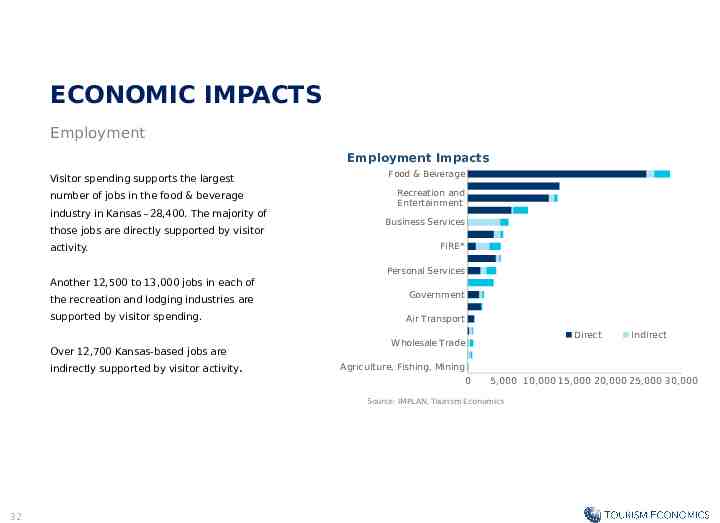
ECONOMIC IMPACTS Employment Employment Impacts Visitor spending supports the largest number of jobs in the food & beverage industry in Kansas –28,400. The majority of those jobs are directly supported by visitor activity. Food & Beverage Recreation and Entertainment Business Services FIRE* Personal Services Another 12,500 to 13,000 jobs in each of the recreation and lodging industries are Government supported by visitor spending. Air Transport Over 12,700 Kansas-based jobs are indirectly supported by visitor activity. Direct Wholesale Trade Agriculture, Fishing, Mining 0 5,000 10,000 15,000 20,000 25,000 30,000 Source: IMPLAN, Tourism Economics 32 Indirect
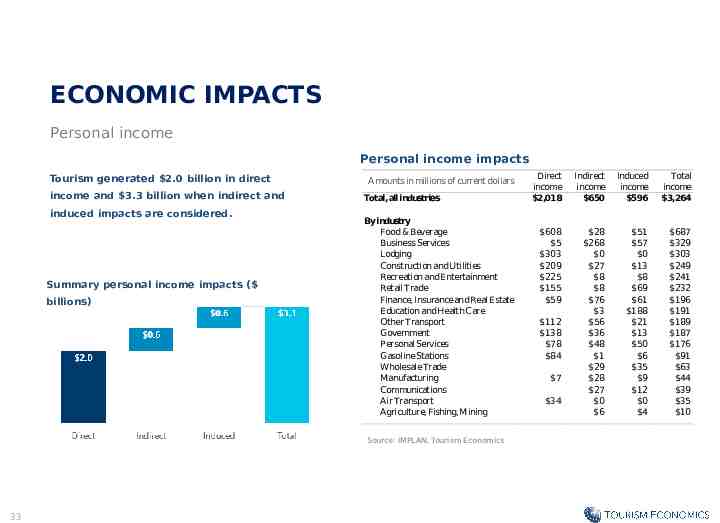
ECONOMIC IMPACTS Personal income Personal income impacts Tourism generated 2.0 billion in direct income and 3.3 billion when indirect and induced impacts are considered. Summary personal income impacts ( billions) Amounts in millions of current dollars Total, all industries By industry Food & Beverage Business Services Lodging Construction and Utilities Recreation and Entertainment Retail Trade Finance, Insurance and Real Estate Education and Health Care Other Transport Government Personal Services Gasoline Stations Wholesale Trade Manufacturing Communications Air Transport Agriculture, Fishing, Mining Source: IMPLAN, Tourism Economics 33 Direct income 2,018 Indirect income 650 Induced income 596 Total income 3,264 608 5 303 209 225 155 59 28 268 0 27 8 8 76 3 56 36 48 1 29 28 27 0 6 51 57 0 13 8 69 61 188 21 13 50 6 35 9 12 0 4 687 329 303 249 241 232 196 191 189 187 176 91 63 44 39 35 10 112 138 78 84 7 34
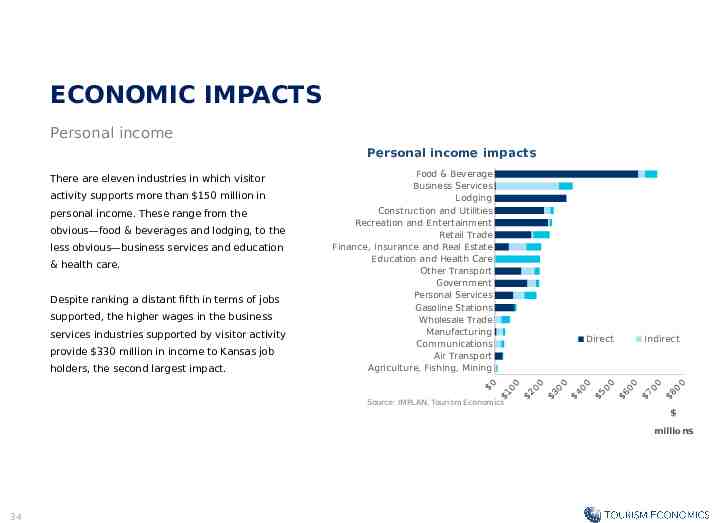
ECONOMIC IMPACTS Personal income Personal income impacts There are eleven industries in which visitor activity supports more than 150 million in personal income. These range from the obvious—food & beverages and lodging, to the less obvious—business services and education & health care. Despite ranking a distant fifth in terms of jobs supported, the higher wages in the business services industries supported by visitor activity provide 330 million in income to Kansas job holders, the second largest impact. Food & Beverage Business Services Lodging Construction and Utilities Recreation and Entertainment Retail Trade Finance, Insurance and Real Estate Education and Health Care Other Transport Government Personal Services Gasoline Stations Wholesale Trade Manufacturing Communications Air Transport Agriculture, Fishing, Mining 0 Direct 1 Source: IMPLAN, Tourism Economics 00 2 00 3 00 4 00 5 00 Indirect 6 00 7 00 8 00 millions 34
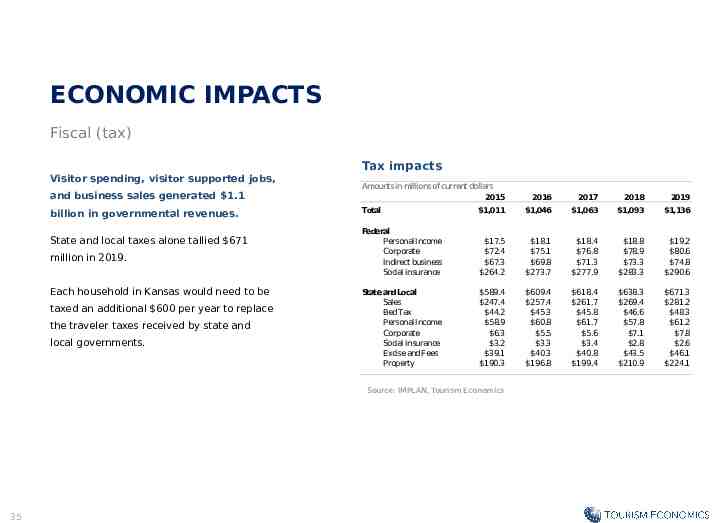
ECONOMIC IMPACTS Fiscal (tax) Visitor spending, visitor supported jobs, Tax impacts and business sales generated 1.1 Amounts in millions of current dollars 2015 billion in governmental revenues. Total State and local taxes alone tallied 671 million in 2019. Each household in Kansas would need to be taxed an additional 600 per year to replace the traveler taxes received by state and local governments. 2016 2017 2018 2019 1,011 1,046 1,063 1,093 1,136 Federal Personal Income Corporate Indirect business Social insurance 17.5 72.4 67.3 264.2 18.1 75.1 69.8 273.7 18.4 76.8 71.3 277.9 18.8 78.9 73.3 283.3 19.2 80.6 74.8 290.6 State andLocal Sales Bed Tax Personal Income Corporate Social insurance Excise and Fees Property 589.4 247.4 44.2 58.9 6.3 3.2 39.1 190.3 609.4 257.4 45.3 60.8 5.5 3.3 40.3 196.8 618.4 261.7 45.8 61.7 5.6 3.4 40.8 199.4 638.3 269.4 46.6 57.8 7.1 2.8 43.5 210.9 671.3 281.2 48.3 61.2 7.8 2.6 46.1 224.1 Source: IMPLAN, Tourism Economics 35
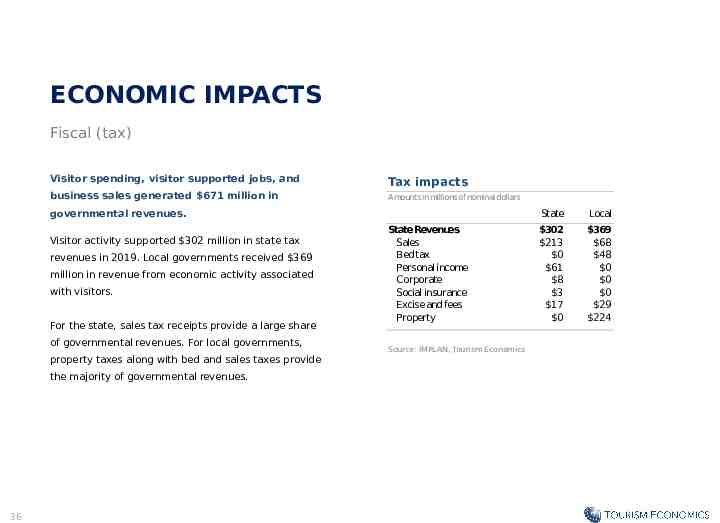
ECONOMIC IMPACTS Fiscal (tax) Visitor spending, visitor supported jobs, and Tax impacts business sales generated 671 million in Amounts in millions of nominal dollars governmental revenues. Visitor activity supported 302 million in state tax revenues in 2019. Local governments received 369 million in revenue from economic activity associated with visitors. For the state, sales tax receipts provide a large share of governmental revenues. For local governments, property taxes along with bed and sales taxes provide the majority of governmental revenues. 36 State Revenues Sales Bed tax Personal income Corporate Social insurance Excise and fees Property Source: IMPLAN, Tourism Economics State Local 302 213 0 61 8 3 17 0 369 68 48 0 0 0 29 224
ECONOMIC IMPACT IN CONTEXT
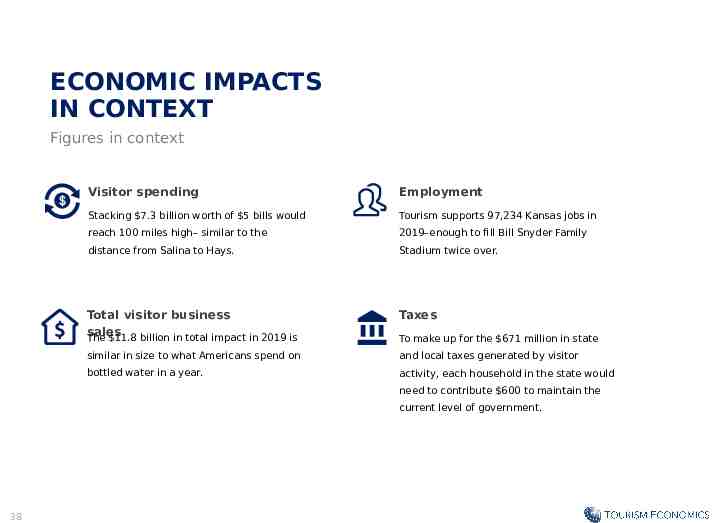
ECONOMIC IMPACTS IN CONTEXT Figures in context Visitor spending Employment Stacking 7.3 billion worth of 5 bills would Tourism supports 97,234 Kansas jobs in reach 100 miles high– similar to the 2019–enough to fill Bill Snyder Family distance from Salina to Hays. Stadium twice over. Total visitor business sales The 11.8 billion in total impact in 2019 is Taxes similar in size to what Americans spend on and local taxes generated by visitor bottled water in a year. activity, each household in the state would To make up for the 671 million in state need to contribute 600 to maintain the current level of government. 38
ABOUT TOURISM ECONOMICS Tourism Economics is an Oxford Economics company with a singular objective: combine an understanding of the travel sector with proven economic tools to answer the most important questions facing our clients. More than 500 companies, associations, and destination work with Tourism Economics every year as a research partner. We bring decades of experience to every engagement to help our clients make better marketing, investment, and policy decisions. Our team of highly-specialized economists deliver: Global travel data-sets with the broadest set of country, city, and state coverage available Travel forecasts that are directly linked to the economic and demographic outlook for origins and destinations Economic impact analysis that highlights the value of visitors, events, developments, and industry segments Policy analysis that informs critical funding, taxation, and travel facilitation decisions Market assessments that define market allocation and investment decisions Tourism Economics operates out of regional headquarters in Philadelphia and Oxford, with offices in Belfast, Buenos Aires, Dubai, Frankfurt, and Ontario. Oxford Economics is one of the world’s foremost independent global advisory firms, providing reports, forecasts and analytical tools on 200 countries, 100 industrial sectors and over 3,000 cities. Our best-of-class global economic and industry models and analytical tools give us an unparalleled ability to forecast external market trends and assess their economic, social and business impact. Headquartered in Oxford, England, with regional centers in London, New York, and Singapore, Oxford Economics has offices across the globe in Belfast, Chicago, Dubai, Miami, Milan, Paris, Philadelphia, San Francisco, and Washington DC, we employ over 250 full-time staff, including 150 professional economists, industry experts and business editors—one of the largest teams of macroeconomists and thought leadership specialists. For more information: [email protected] 39