Aim: How is price determined in the market place? Do Now: a) Do you


36 Slides2.24 MB
Aim: How is price determined in the market place? Do Now: a) Do you believe people buy more at lower prices and less at higher prices? Why? b) Do you believe that sellers want to sell more at higher prices and less at lower prices? Why? Homework: a) Current Event Quiz #2 – Friday, 11/4 b) Comprehensive Exam on Unit 1 and Unit 2 – on Wednesday 11/2 and Thursday 11/3
Supply and Demand In the American economy, supply and demand work together to set prices.
Demand Demand is the consumers desire and ability to purchase a good or service. A demand schedule is a table that a visual representation of various quantities of a product or service that someone is willing to buy over a range of prices.
Demand A demand schedule can be shown as points on a graph. The graph lists prices on the vertical axis and quantities demanded on the horizontal axis. Each point on the graph shows how many units of the product or service an individual will buy at a particular price. The demand curve is the line that connects these points. 4
Demand Curve for Products 6 Price per Product 5 4 Demand Curve for Widgets 3 2 1 0 1 2 3 4 5 6 7 8 9 10 11 Quantity Demanded Per Product What do you notice about the demand curve? How would you describe the slope of the demand curve? Do you think that price and quantity demanded tend to
Demand The demand curve slopes downward. Consumers typically buy less of a product at a high price and more at a low price. According to the law of demand, quantity demanded and price move in opposite directions. Demand Curve for Widgets 6 Price per Widget 5 4 Demand Curve for Widgets 3 2 1 0 1 2 3 4 5 6 7 8 9 10 11 Quantity Demanded of Widgets 6
Demand We buy products for their utility- the pleasure, usefulness, or satisfaction they give us. What is your utility for the following products? (Measure your utility by the maximum amount you would be willing to pay for this product)
Demand One reason the demand curve slopes downward is due to diminish marginal utility The principle of diminishing marginal utility says that our additional satisfaction tends to go down as we consume more and more units. To make a buying decision, we consider whether the satisfaction we expect to gain is worth the money we must give up. Example- Cold drink on a hot day 1st glass 2nd glass 3rd glass
Changes in Demand Demand Curves can also shift in response to the following factors: Buyers (# of): changes in the number of consumers Income: changes in consumers’ income Tastes: changes in preference or popularity of product/ service Expectations: changes in what consumers expect to happen in the future Related goods: compliments and substitutes BITER: factors that shift the demand curve
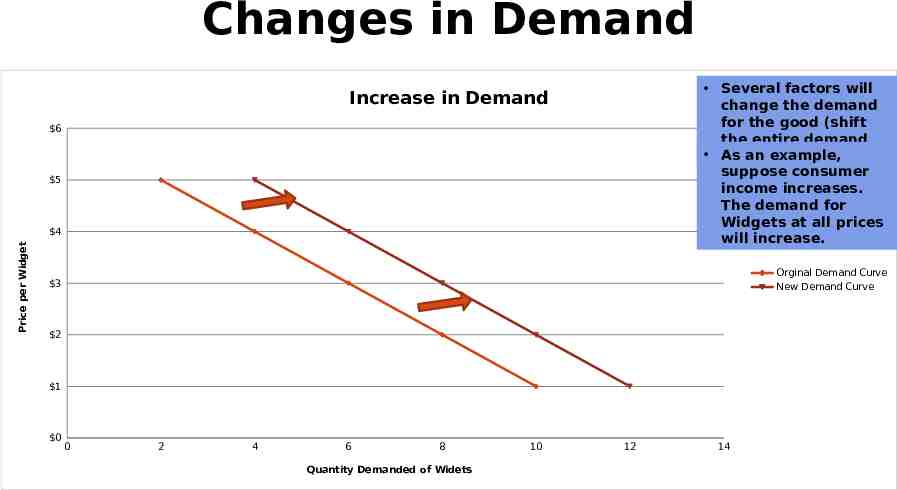
Changes in Demand Several factors will change the demand for the good (shift the entire demand As an example, curve) suppose consumer income increases. The demand for Widgets at all prices will increase. Demand Increase Curve in Demand for Widgets 6 6 5 5 Price per Widget Price per Widget 4 4 Orginal Demand Curve Demand Curve for Widgets New Demand Curve 3 3 2 2 1 1 0 0 01 2 2 3 44 5 6 6 87 Quantity Quantity Demanded Demanded ofof Widgets Widets 8 10 9 1210 11 14
Changes in Demand Demand will also decrease due to changes in factors other than price. As an example, suppose Widgets become less popular to own. Demand Decrease Curve in for Demand Widgets 6 6 Price per Widget Price per Widget 5 5 4 4 Original Demand Curve Demand Curve for Widgets New Demand Curve 3 3 2 2 1 1 0 0 10 2 2 3 4 4 5 66 7 Quantity Demanded Demanded of of Widgets Widgets Quantity 8 8 9 10 10 12 11
Changes in Demand Decrease in Demand shifts to the Left (Less demanded at each price) OR Increase in Demand shifts to the Right (More demanded at each price)
Supply Supply refers to the various quantities of a good or service that producers are willing to sell at all possible market prices. Supply can refer to the output of one producer or to the total output of all producers in the market (market supply).
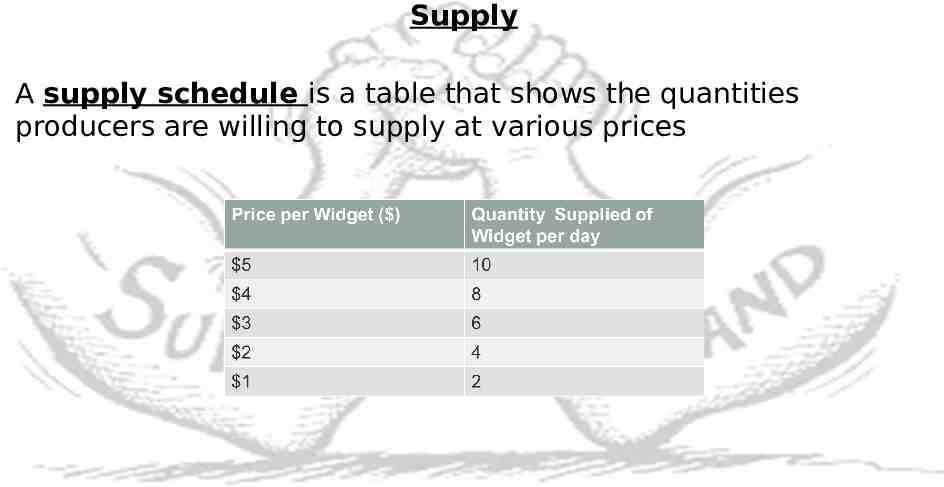
Supply A supply schedule is a table that shows the quantities producers are willing to supply at various prices
Supply A supply schedule can be shown as points on a graph. The graph lists prices on the vertical axis and quantities supplied on the horizontal axis. Each point on the graph shows how many units of the product or service a producer (or group of producers) would willing sell at a particular price. The supply curve is the line that connects these points.
Supply Curve for Products 6 5 Price per Product 4 Supply Curve 3 2 1 0 1 2 3 4 5 6 7 8 9 10 11 Quantity Supplied products What do you notice about the supply curve? How would you describe the slope of the supply curve? Do you think that price and quantity supplied tend to
Supply As the price for a good rises, the quantity supplied rises and the quantity demanded falls. As the price falls, the quantity supplied falls and the quantity demanded rises.
Supply Businesses provide goods and services hoping to make a profit. Profit is the money a business has left over after it covers its costs. Businesses try to sell at prices high enough to cover their costs with some profit left over. The higher the price for a good, the more profit a business will make after paying the cost for resources.
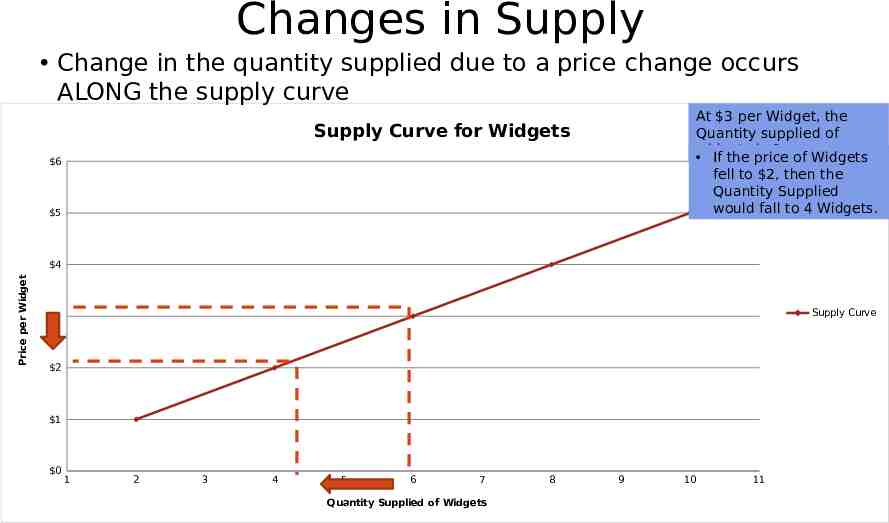
Changes in Supply Change in the quantity supplied due to a price change occurs ALONG the supply curve At 3 per Widget, the Quantity supplied of widgets is 6. If the price of Widgets fell to 2, then the Quantity Supplied would fall to 4 Widgets. Supply Curve for Widgets 6 5 Price per Widget 4 Supply Curve 3 2 1 0 1 2 3 4 5 6 7 Quantity Supplied of Widgets 8 9 10 11
Supply Supply Curves can also shift in response to the following factors: Subsidies and taxes: government subsides encourage production, while taxes discourage production Technology: improvements in production increase ability of firms to supply Other goods: businesses consider the price of goods they could be producing Number of sellers: how many firms are in the market Expectations: businesses consider future prices and economic conditions Resource costs: cost to purchase factors of production will
Changes in Supply Several factors will change the demand for the good (shift the entire demand curve) As an example, suppose that there is an improvement in the technology used to produce widgets. Supply Increase Curveinfor Supply Widgets 6 5 Price per Widget 4 Original Supply Curve Supply Curve New Supply Curve 3 2 1 0 1 0 2 2 3 4 4 56 6 8 7 Quantities Quantity Supplied Supplied of of Widgets Widgets 10 8 912 10 14 11
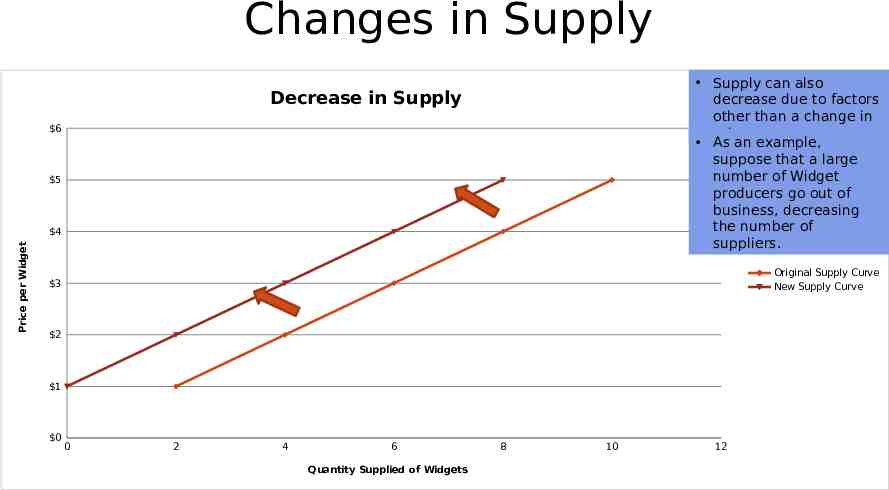
Changes in Supply Supply can also decrease due to factors other than a change in price. As an example, suppose that a large number of Widget producers go out of business, decreasing the number of suppliers. Decrease in Curve Supplyfor Widgets Supply 6 5 Price per Widget 4 Original Supply Curve Supply Curve New Supply Curve 3 2 1 0 1 0 2 2 3 44 5 6 6 7 Quantity Quantity Supplied Supplied of Widgets of Widgets 8 8 109 10 12 11
Changes in Supply Decrease in Supply shifts to the Left (Less supplied at each price) OR Increase in Supply shifts to the Right (More supplied at each price)
Cost to Produce Cost of Resources Falls Cost of Resources Rises Productivity Decreases Productivity Increases New Technology Higher Taxes Lower Taxes Government Pays Subsidy Amount of Supply Supply Curve Shifts
Supply and Demand at Work Markets bring buyers and sellers together. The forces of supply and demand work together in markets to establish prices. In our economy, prices form the basis of economic decisions.
Supply and Demand at Work Supply and Demand Schedule can be combined into one chart.
Supply and Demand at Work A surplus is the amount by which the quantity supplied is higher than the quantity demanded. A surplus signals that the price is too high. At that price, consumers will not buy all of the product that suppliers are willing to supply. In a competitive market, a surplus will not last. Sellers will lower their price to sell their goods.
Supply and Demand at Work Suppose that the price in the Widget market is 4. At 4, Quantity demanded will be 4 Widgets At 4, Quantity supplied will be 8 Widgets. At 4, there will be a surplus of 4 Widgets. Supply and Demand for Widgets 6 Surplus Price per Widget 5 4 Demand Curve Supply Curve 3 2 1 0 1 2 3 4 5 6 Quantity of Widgets 7 8 9 10 11
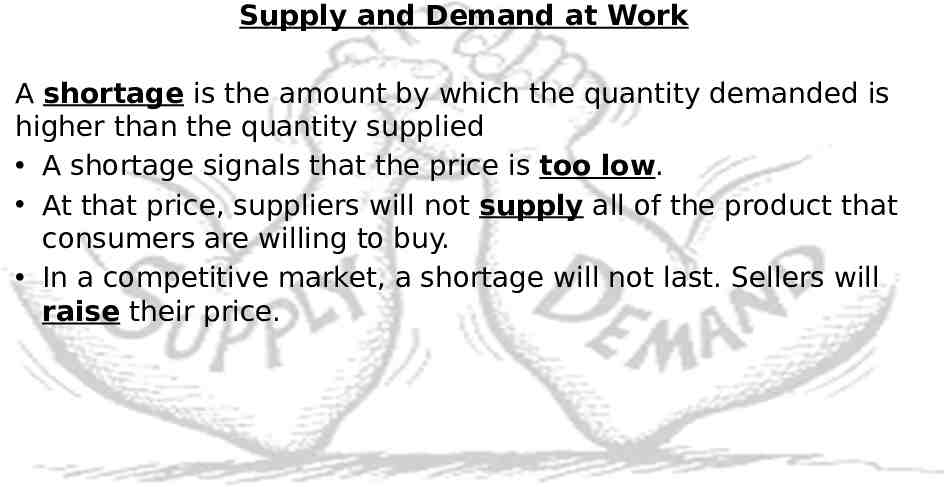
Supply and Demand at Work A shortage is the amount by which the quantity demanded is higher than the quantity supplied A shortage signals that the price is too low. At that price, suppliers will not supply all of the product that consumers are willing to buy. In a competitive market, a shortage will not last. Sellers will raise their price.
Supply and Demand at Work Suppose that the price in the Widget market is 2. At 2, Quantity supplied will be 4 Widgets At 2, Quantity demanded will be 8 Widgets. At 2, there will be a shortage of 4 Widgets. Supply and Demand for Widgets 6 5 Price per Widget 4 Demand Curve Supply Curve 3 2 1 0 1 2 3 4 Shortage 5 6 Quantity of Widgets 7 8 9 10 11
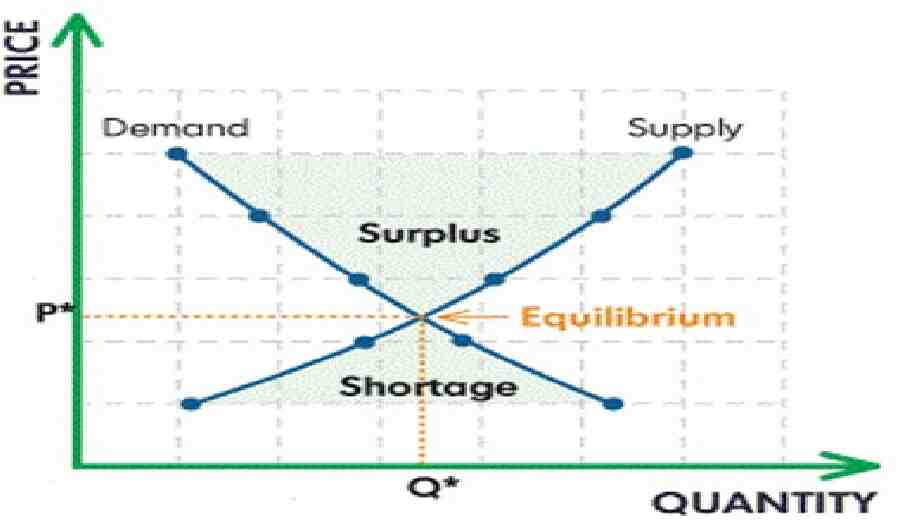
Supply and Demand at Work When operating without restriction, our market economy eliminates shortages and surpluses. Over time, a surplus forces the price down and a shortage forces the price up until supply and demand are balanced. The point where they achieve balance is the equilibrium price. At this price, neither a surplus nor a shortage exists. Once the market price reaches equilibrium, it tends to stay there until either supply or demand changes. When that happens, a temporary surplus or shortage occurs until the price adjusts to reach a new equilibrium price.
Supply and Demand at Work Riley’s clothing store wants to set a price for a new pair of jeans. Help Riley find the best price that will satisfy both customers and Riley. Plot the points for selling price and number supplied on the graph below. Draw a line through these points and mark the line "Supply". Plot the points for selling price and number demanded. Draw a line through these points and mark the line "Demand". Estimate where supply and demand are equal (in equilibrium). Circle this point and identify the selling price and units sold.
Company A Company B Company C Price: 5.50 Price: 12.50 Price: 25 Quantity Sold: 1000 Quantity Sold: 425 Quantity Sold: 10 Profit Margin: 0.10 Profit Margin: 4.10 Profit Margin: 17.75 Questions: Which company could continue to sell their product and continue to make a profit for a long period of time? Why do you think so students? Which company over priced their product? What affect did this have on the quantity sold? Why? Which company sold a large quantity? Why would this business not be able to continue to produce this product if the cost went up .20? What are examples of how you face supply and demand on a daily basis?
DVD sales are sliding because more consumers are watching content digitally. (This involves two markets.)