10th International Pediatric HIV Workshop and 22nd International


84 Slides8.87 MB
10th International Pediatric HIV Workshop and 22nd International AIDS Conference Selected Pediatric, PMTCT, and Maternal/Adult Abstracts Lynne Mofenson MD 08/06/2018 webinar version
Main Subject Everything Dolutegravir Studies in HIV-Infected Adults/Adolescents Meireles MV et al. IAS, Amsterdam, July 2018 Abs. TUAB0101 Brazil MOH using national ARV and lab data, 6 mo viral suppression rates with DTG/TDF/3TC 42% better than EFV ART and 50% better than PI ART Van Wyk J et al. IAS, Amsterdam July 2018 Abs. TUPDB0102 Neuropsychiatric symptoms were similar in adults receiving DTG and non-DTG ART regimens in analysis 5 RCT in 3,500 patients
Main Subject Everything Dolutegravir Studies in HIV-Infected Infants and Children
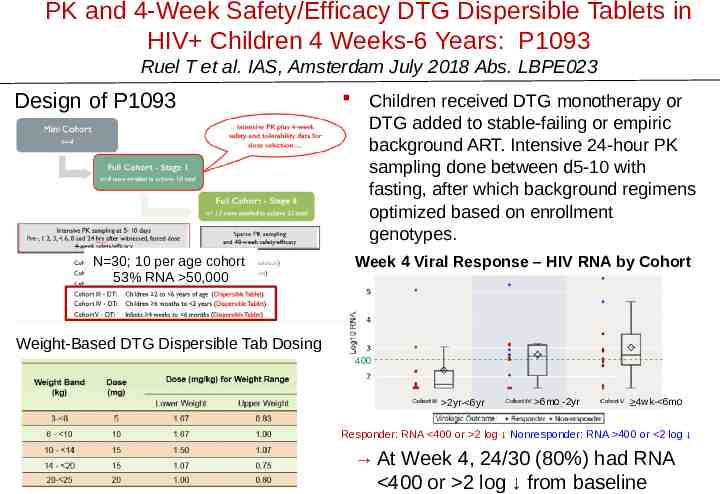
PK and 4-Week Safety/Efficacy DTG Dispersible Tablets in HIV Children 4 Weeks-6 Years: P1093 Ruel T et al. IAS, Amsterdam July 2018 Abs. LBPE023 Design of P1093 N 30; 10 per age cohort 53% RNA 50,000 Children received DTG monotherapy or DTG added to stable-failing or empiric background ART. Intensive 24-hour PK sampling done between d5-10 with fasting, after which background regimens optimized based on enrollment genotypes. Week 4 Viral Response – HIV RNA by Cohort Weight-Based DTG Dispersible Tab Dosing 400 2yr- 6yr 6mo -2yr 4wk- 6mo Responder: RNA 400 or 2 log Nonresponder: RNA 400 or 2 log At Week 4, 24/30 (80%) had RNA 400 or 2 log from baseline
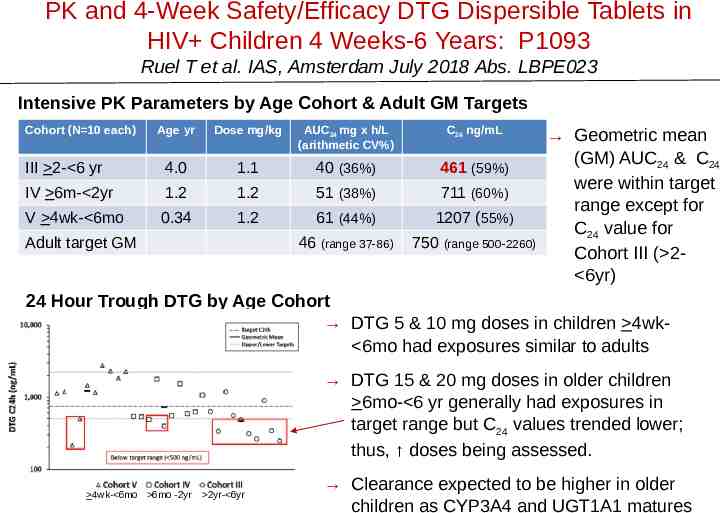
PK and 4-Week Safety/Efficacy DTG Dispersible Tablets in HIV Children 4 Weeks-6 Years: P1093 Ruel T et al. IAS, Amsterdam July 2018 Abs. LBPE023 Intensive PK Parameters by Age Cohort & Adult GM Targets Cohort (N 10 each) Age yr Dose mg/kg AUC24 mg x h/L (arithmetic CV%) C24 ng/mL III 2- 6 yr 4.0 1.1 40 (36%) 461 (59%) IV 6m- 2yr 1.2 1.2 51 (38%) 711 (60%) V 4wk- 6mo 0.34 1.2 61 (44%) 1207 (55%) 46 (range 37-86) 750 (range 500-2260) Adult target GM Geometric mean (GM) AUC24 & C24 were within target range except for C24 value for Cohort III ( 2 6yr) 24 Hour Trough DTG by Age Cohort DTG 5 & 10 mg doses in children 4wk 6mo had exposures similar to adults DTG 15 & 20 mg doses in older children 6mo- 6 yr generally had exposures in target range but C24 values trended lower; thus, doses being assessed. 4wk- 6mo 6mo -2yr 2yr- 6yr Clearance expected to be higher in older children as CYP3A4 and UGT1A1 matures
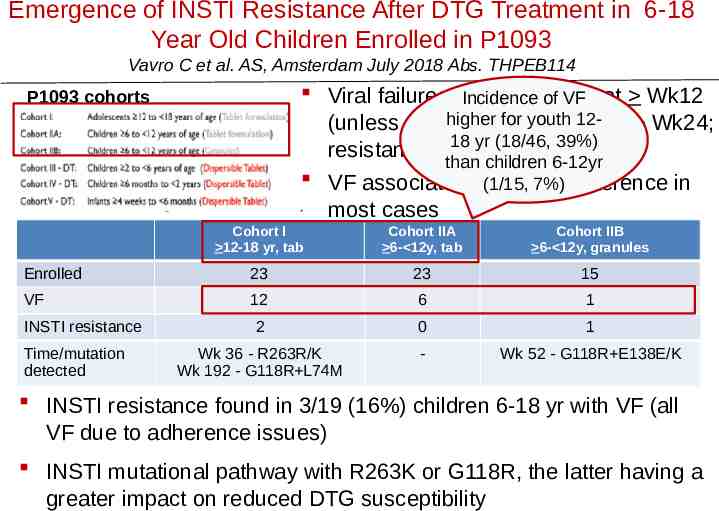
Emergence of INSTI Resistance After DTG Treatment in 6-18 Year Old Children Enrolled in P1093 Vavro C et al. AS, Amsterdam July 2018 Abs. THPEB114 Viral failure: RNA of 1 log at Wk12 Incidence of VF higher for youth 12(unless 400); confirmed 400 Wk24; 18 yr (18/46, 39%) resistance testing done with VF than children 6-12yr VF associated with lack (1/15, 7%)adherence in most cases P1093 cohorts Cohort I 12-18 yr, tab Cohort IIA 6- 12y, tab Cohort IIB 6- 12y, granules Enrolled 23 23 15 VF 12 6 1 2 0 1 Wk 36 - R263R/K Wk 192 - G118R L74M - Wk 52 - G118R E138E/K INSTI resistance Time/mutation detected INSTI resistance found in 3/19 (16%) children 6-18 yr with VF (all VF due to adherence issues) INSTI mutational pathway with R263K or G118R, the latter having a greater impact on reduced DTG susceptibility
Main Subject Everything Dolutegravir Studies in Pregnant Women
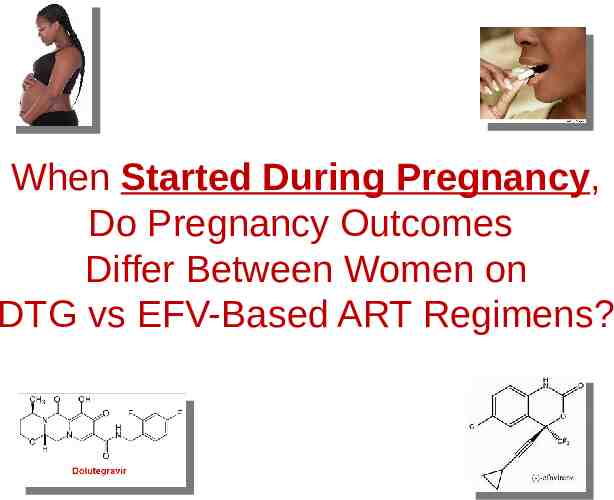
When Started During Pregnancy, Do Pregnancy Outcomes Differ Between Women on DTG vs EFV-Based ART Regimens?
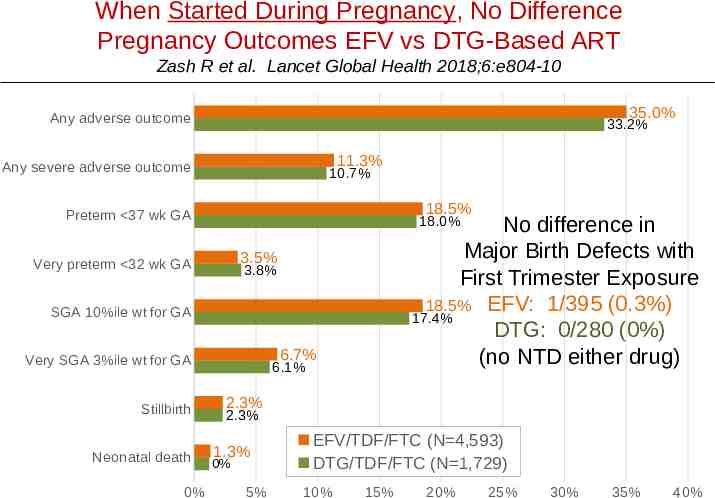
When Started During Pregnancy, No Difference Pregnancy Outcomes EFV vs DTG-Based ART Zash R et al. Lancet Global Health 2018;6:e804-10 35.0% Any adverse outcome 33.2% 11.3% Any severe adverse outcome 10.7% 18.5% Preterm 37 wk GA No difference in Major Birth Defects with First Trimester Exposure 18.5% EFV: 1/395 (0.3%) 17.4% DTG: 0/280 (0%) (no NTD either drug) 18.0% 3.5% Very preterm 32 wk GA 3.8% SGA 10%ile wt for GA 6.7% Very SGA 3%ile wt for GA Stillbirth Neonatal death 0% 6.1% 2.3% 2.3% 1.3% 0% 5% EFV/TDF/FTC (N 4,593) DTG/TDF/FTC (N 1,729) 10% 15% 20% 25% 30% 35% 40%
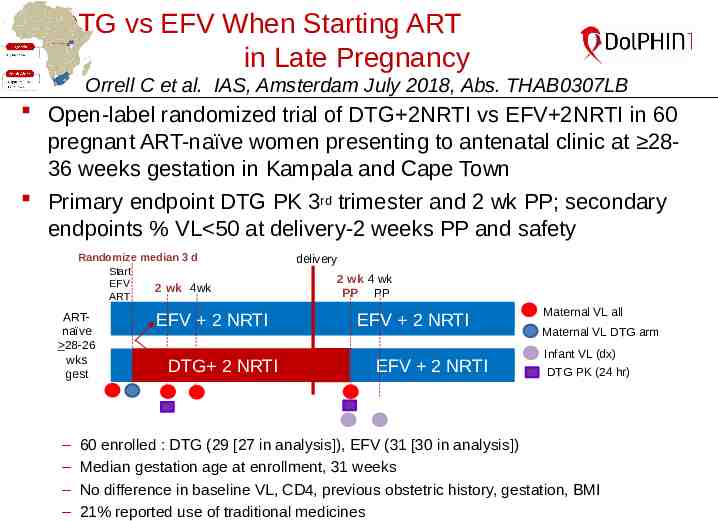
DTG vs EFV When Starting ART in Late Pregnancy Orrell C et al. IAS, Amsterdam July 2018, Abs. THAB0307LB Open-label randomized trial of DTG 2NRTI vs EFV 2NRTI in 60 pregnant ART-naïve women presenting to antenatal clinic at 2836 weeks gestation in Kampala and Cape Town Primary endpoint DTG PK 3rd trimester and 2 wk PP; secondary endpoints % VL 50 at delivery-2 weeks PP and safety Randomize median 3 d Start EFV 2 wk 4wk ART ARTnaïve 28-26 wks gest ‒ ‒ ‒ ‒ EFV 2 NRTI DTG 2 NRTI delivery 2 wk 4 wk PP PP EFV 2 NRTI EFV 2 NRTI Maternal VL all Maternal VL DTG arm Infant VL (dx) DTG PK (24 hr) 60 enrolled : DTG (29 [27 in analysis]), EFV (31 [30 in analysis]) Median gestation age at enrollment, 31 weeks No difference in baseline VL, CD4, previous obstetric history, gestation, BMI 21% reported use of traditional medicines
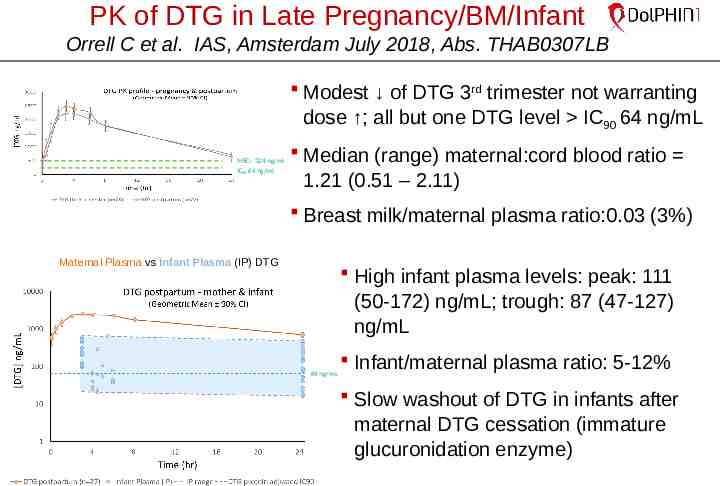
PK of DTG in Late Pregnancy/BM/Infant Orrell C et al. IAS, Amsterdam July 2018, Abs. THAB0307LB Modest of DTG 3rd trimester not warranting dose ; all but one DTG level IC90 64 ng/mL MEC: 324 ng/ml IC90 64 ng/ml Median (range) maternal:cord blood ratio 1.21 (0.51 – 2.11) Breast milk/maternal plasma ratio:0.03 (3%) Maternal Plasma vs Infant Plasma (IP) DTG High infant plasma levels: peak: 111 (50-172) ng/mL; trough: 87 (47-127) ng/mL 64 ng/mL Infant/maternal plasma ratio: 5-12% Slow washout of DTG in infants after maternal DTG cessation (immature glucuronidation enzyme)
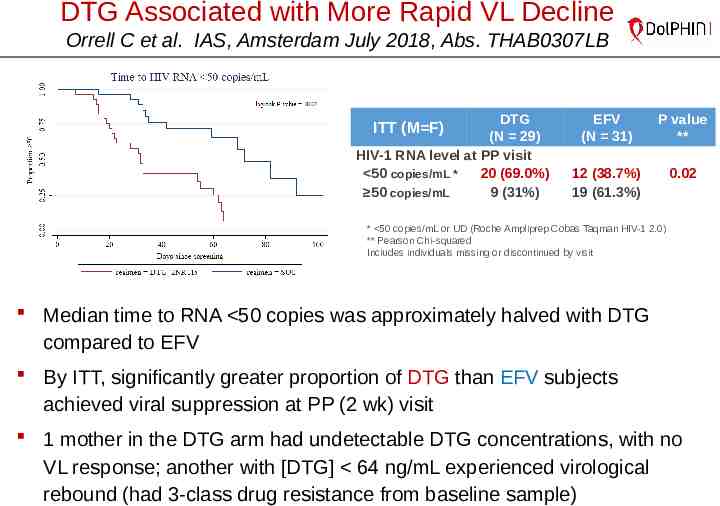
DTG Associated with More Rapid VL Decline Orrell C et al. IAS, Amsterdam July 2018, Abs. THAB0307LB DTG (N 29) HIV-1 RNA level at PP visit 50 copies/mL * 20 (69.0%) 50 copies/mL 9 (31%) ITT (M F) EFV (N 31) P value ** 12 (38.7%) 19 (61.3%) 0.02 * 50 copies/mL or UD (Roche Ampliprep Cobas Taqman HIV-1 2.0) ** Pearson Chi-squared Includes individuals missing or discontinued by visit Median time to RNA 50 copies was approximately halved with DTG compared to EFV By ITT, significantly greater proportion of DTG than EFV subjects achieved viral suppression at PP (2 wk) visit 1 mother in the DTG arm had undetectable DTG concentrations, with no VL response; another with [DTG] 64 ng/mL experienced virological rebound (had 3-class drug resistance from baseline sample)
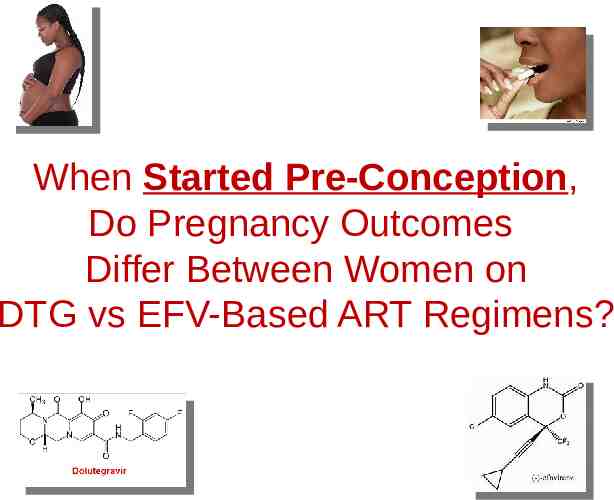
When Started Pre-Conception, Do Pregnancy Outcomes Differ Between Women on DTG vs EFV-Based ART Regimens?
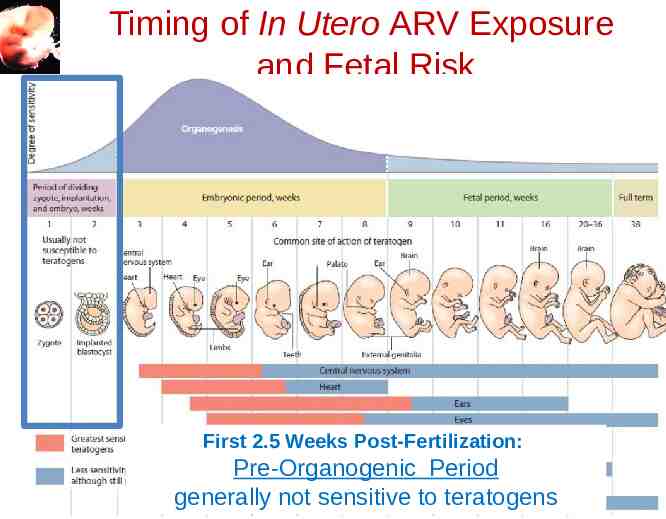
Timing of In Utero ARV Exposure and Fetal Risk First 2.5 Weeks Post-Fertilization: Pre-Organogenic Period generally not sensitive to teratogens
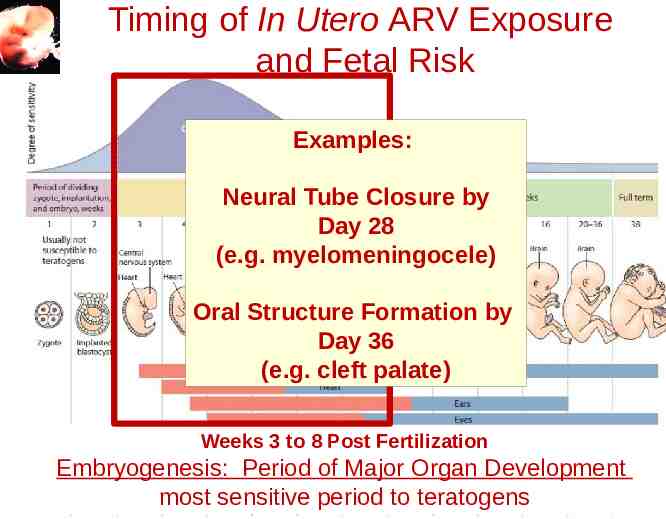
Timing of In Utero ARV Exposure and Fetal Risk Examples: Neural Tube Closure by Day 28 (e.g. myelomeningocele) Oral Structure Formation by Day 36 (e.g. cleft palate) Weeks 3 to 8 Post Fertilization Embryogenesis: Period of Major Organ Development most sensitive period to teratogens
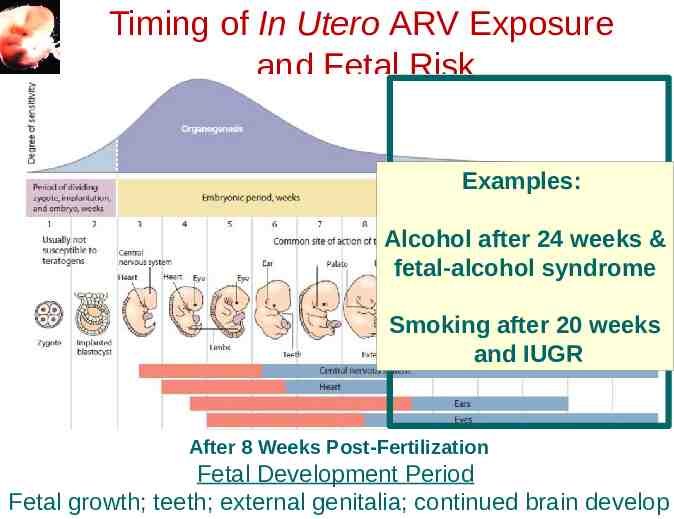
Timing of In Utero ARV Exposure and Fetal Risk Examples: Alcohol after 24 weeks & fetal-alcohol syndrome Smoking after 20 weeks and IUGR After 8 Weeks Post-Fertilization Fetal Development Period Fetal growth; teeth; external genitalia; continued brain develop
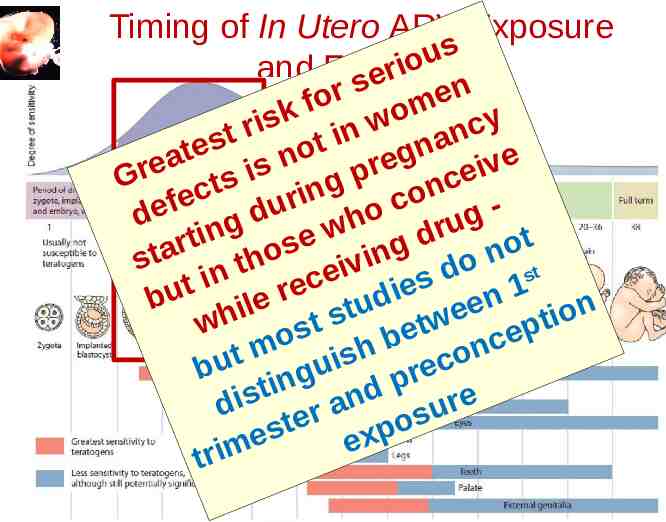
Timing of In Utero ARV Exposure s u o iRisk and Fetal r e s n r e o f m k o s y w i c r n n t i a s t n e o t g e n a e v e r i s r i p e G c s g t n n c i o e r c f de ng du who g u r i d t e t r s o g a o n t in h st o t v i d s e n i c s t e e 1 i d n bu hile r e u n t e o s i t w t w t p s e e o b c m n h t o bu inguis prec t d s e n i r a d u r s e o t s p e x e m i tr
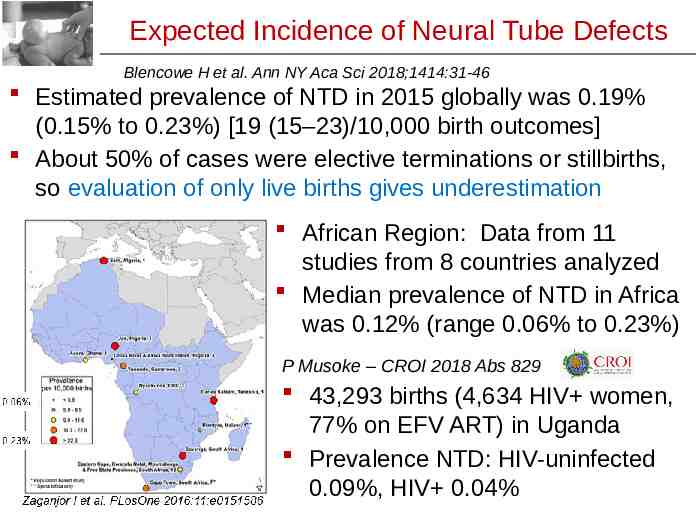
Expected Incidence of Neural Tube Defects Blencowe H et al. Ann NY Aca Sci 2018;1414:31-46 Estimated prevalence of NTD in 2015 globally was 0.19% (0.15% to 0.23%) [19 (15–23)/10,000 birth outcomes] About 50% of cases were elective terminations or stillbirths, so evaluation of only live births gives underestimation African Region: Data from 11 studies from 8 countries analyzed Median prevalence of NTD in Africa was 0.12% (range 0.06% to 0.23%) P Musoke – CROI 2018 Abs 829 43,293 births (4,634 HIV women, 77% on EFV ART) in Uganda Prevalence NTD: HIV-uninfected 0.09%, HIV 0.04%
Botswana Tsepamo Study – Birth Surveillance Zash R. IAS, Amsterdam July 2018 Late Breaker Zash R et al. N Engl J Med 2018 July 24 epub Designed to evaluate the risk of neural tube defects (NTD) with preconception EFV exposure Prospective birth outcomes surveillance for major surface birth defects, 8 large maternity wards, population-based (45% of Botswana births) – Trained hospital-based midwifes surface exam – Research assistant consent mother for photo – Medical geneticist reviews blinded to exposure Good denominator with control groups and ability to distinguish between ARV regimens – HIV-uninfected – HIV-infected ART preconception or started in pregnancy
Botswana Tsepamo Study – Birth Surveillance Zash R. IAS, Amsterdam July 2018 Late Breaker Zash R et al. N Engl J Med 2018 July 24 epub 86 NTDs identified in 88,755 births – 0.10% (95% CI 0.08%, 0.12%) – 42 meningocele/myelomeningocele, 30 anencephaly, 13 encephalocele and 1 iniencephaly – 57% had photos, 43% descriptions N 22 (25%) of all NTDs occurred among stillbirths Among live-born babies with NTDs, 25 (39%) died within 28 days, and 1 had unknown vital status
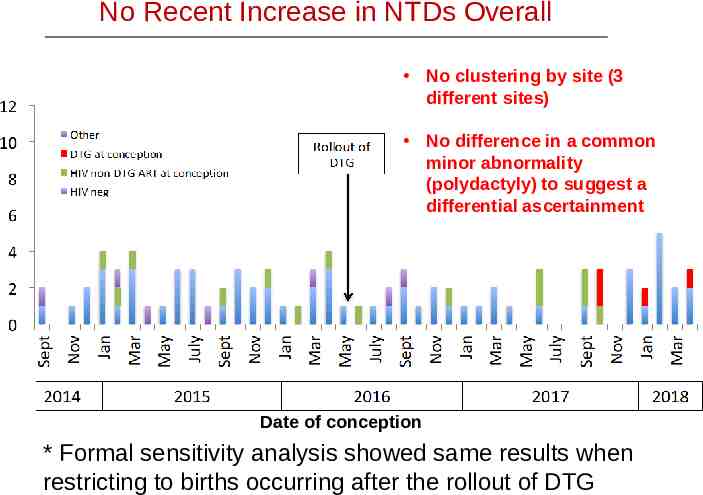
No Recent Increase in NTDs Overall No clustering by site (3 different sites) No difference in a common minor abnormality (polydactyly) to suggest a differential ascertainment Date of conception * Formal sensitivity analysis showed same results when restricting to births occurring after the rollout of DTG
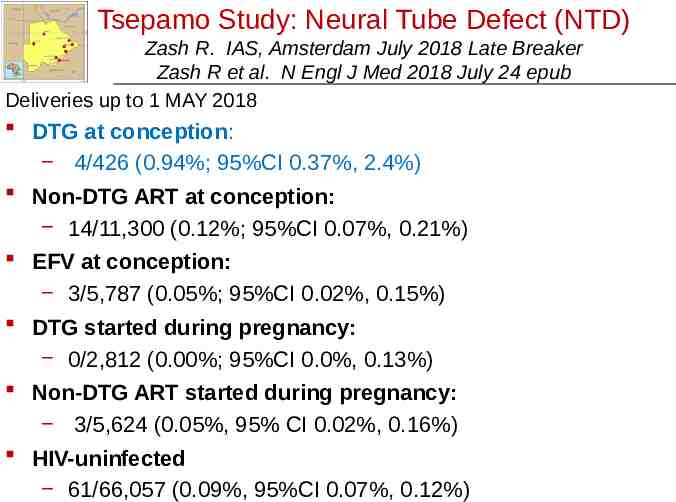
Tsepamo Study: Neural Tube Defect (NTD) Zash R. IAS, Amsterdam July 2018 Late Breaker Zash R et al. N Engl J Med 2018 July 24 epub Deliveries up to 1 MAY 2018 DTG at conception: 4/426 (0.94%; 95%CI 0.37%, 2.4%) Non-DTG ART at conception: 14/11,300 (0.12%; 95%CI 0.07%, 0.21%) EFV at conception: 3/5,787 (0.05%; 95%CI 0.02%, 0.15%) DTG started during pregnancy: 0/2,812 (0.00%; 95%CI 0.0%, 0.13%) Non-DTG ART started during pregnancy: 3/5,624 (0.05%, 95% CI 0.02%, 0.16%) HIV-uninfected 61/66,057 (0.09%, 95%CI 0.07%, 0.12%)
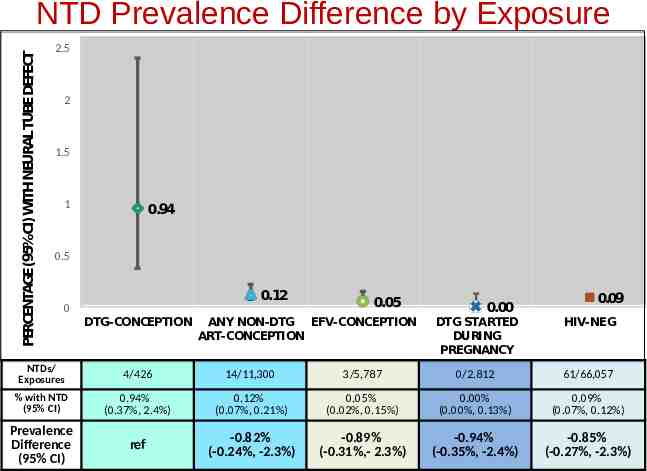
PERCENTAGE(95%CI)WITHNEURALTUBEDEFECT NTD Prevalence Difference by Exposure 2.5 2 1.5 1 0.94 0.5 0.12 0 DTG-CONCEPTION 0.05 ANY NON-DTG EFV-CONCEPTION ART-CONCEPTION 0.00 0.09 DTG STARTED DURING PREGNANCY HIV-NEG NTDs/ Exposures 4/426 14/11,300 3/5,787 0/2.812 61/66,057 % with NTD (95% CI) 0.94% (0.37%, 2.4%) 0.12% (0.07%, 0.21%) 0.05% (0.02%, 0.15%) 0.00% (0.00%, 0.13%) 0.09% (0.07%, 0.12%) Prevalence Difference (95% CI) ref -0.82% (-0.24%, -2.3%) -0.89% (-0.31%,- 2.3%) -0.94% (-0.35%, -2.4%) -0.85% (-0.27%, -2.3%)
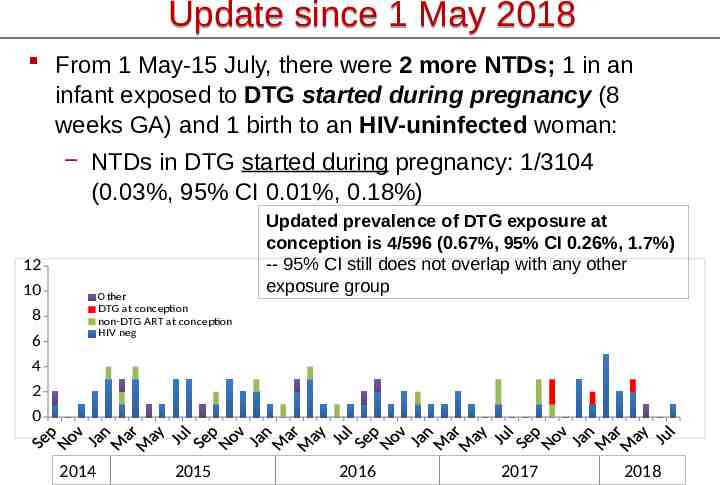
Update since 1 May 2018 From 1 May-15 July, there were 2 more NTDs; 1 in an infant exposed to DTG started during pregnancy (8 weeks GA) and 1 birth to an HIV-uninfected woman: NTDs in DTG started during pregnancy: 1/3104 (0.03%, 95% CI 0.01%, 0.18%) 12 10 Other DTG at conception non-DTG ART at conception HIV neg 8 6 Updated prevalence of DTG exposure at conception is 4/596 (0.67%, 95% CI 0.26%, 1.7%) -- 95% CI still does not overlap with any other exposure group 4 2 0 2014 2015 2016 2017 2018
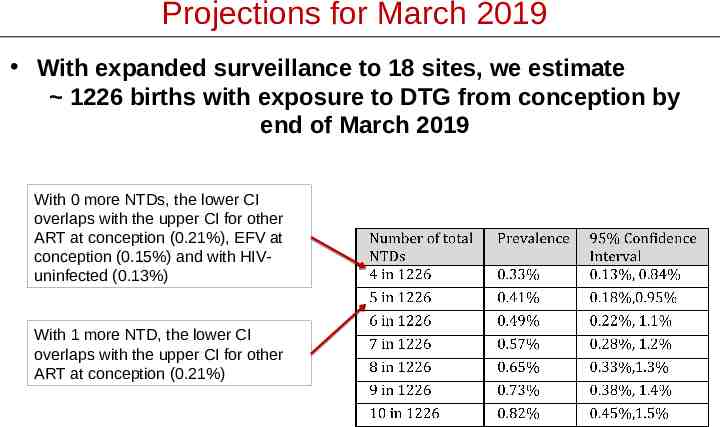
Projections for March 2019 With expanded surveillance to 18 sites, we estimate 1226 births with exposure to DTG from conception by end of March 2019 With 0 more NTDs, the lower CI overlaps with the upper CI for other ART at conception (0.21%), EFV at conception (0.15%) and with HIVuninfected (0.13%) With 1 more NTD, the lower CI overlaps with the upper CI for other ART at conception (0.21%)
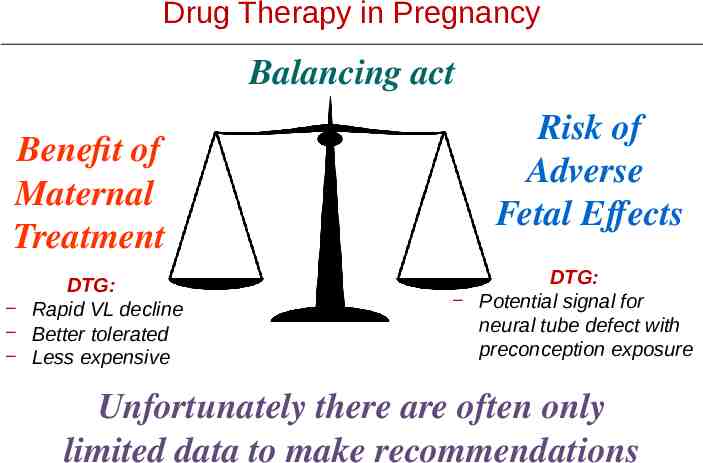
Drug Therapy in Pregnancy Balancing act Benefit of Maternal Treatment DTG: Rapid VL decline Better tolerated Less expensive Risk of Adverse Fetal Effects DTG: Potential signal for neural tube defect with preconception exposure Unfortunately there are often only limited data to make recommendations
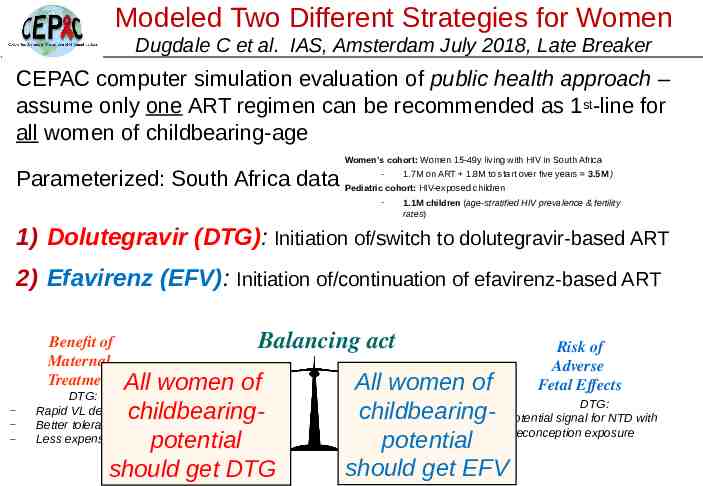
Modeled Two Different Strategies for Women Dugdale C et al. IAS, Amsterdam July 2018, Late Breaker CEPAC computer simulation evaluation of public health approach – assume only one ART regimen can be recommended as 1st-line for all women of childbearing-age Women’s cohort: Women 15-49y living with HIV in South Africa 1.7M on ART 1.8M to start over five years 3.5M ) Parameterized: South Africa data Pediatric- cohort: HIV-exposed children - 1.1M children (age-stratified HIV prevalence & fertility rates) 1) Dolutegravir (DTG): Initiation of/switch to dolutegravir-based ART 2) Efavirenz (EFV): Initiation of/continuation of efavirenz-based ART Benefit of Maternal Treatment Balancing act All women of childbearingpotential should get DTG DTG: Rapid VL decline Better tolerated Less expensive Risk of Adverse Fetal Effects All women of DTG: childbearing Potential signal for NTD with potential preconception exposure should get EFV
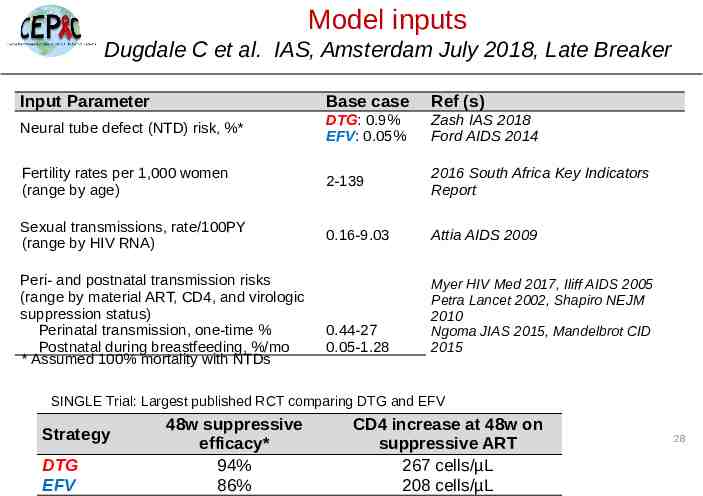
Model inputs Dugdale C et al. IAS, Amsterdam July 2018, Late Breaker Input Parameter Base case Ref (s) Neural tube defect (NTD) risk, %* DTG: 0.9% EFV: 0.05% Zash IAS 2018 Ford AIDS 2014 Fertility rates per 1,000 women (range by age) 2-139 2016 South Africa Key Indicators Report Sexual transmissions, rate/100PY (range by HIV RNA) 0.16-9.03 Attia AIDS 2009 0.44-27 0.05-1.28 Myer HIV Med 2017, Iliff AIDS 2005 Petra Lancet 2002, Shapiro NEJM 2010 Ngoma JIAS 2015, Mandelbrot CID 2015 Peri- and postnatal transmission risks (range by material ART, CD4, and virologic suppression status) Perinatal transmission, one-time % Postnatal during breastfeeding, %/mo * Assumed 100% mortality with NTDs SINGLE Trial: Largest published RCT comparing DTG and EFV Strategy DTG EFV 48w suppressive efficacy* 94% 86% CD4 increase at 48w on suppressive ART 267 cells/µL 208 cells/µL 28
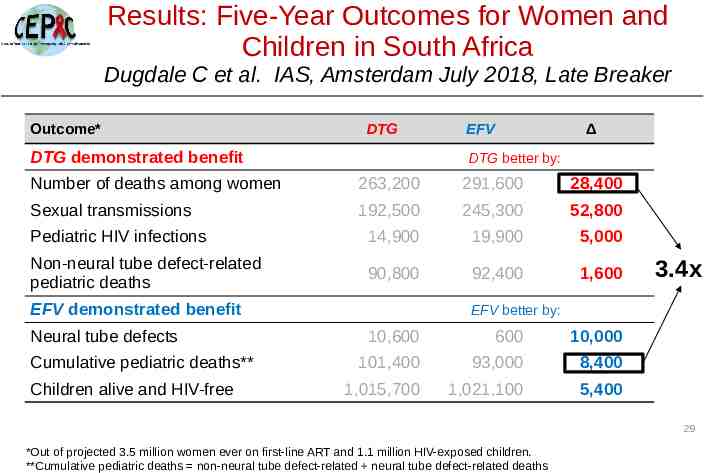
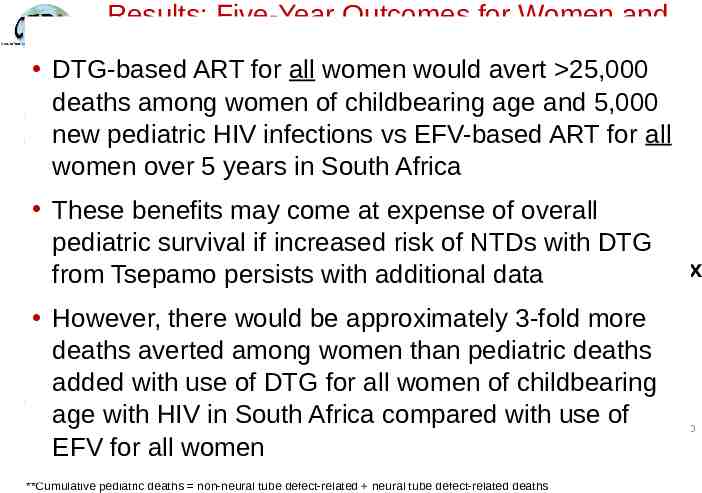
Results: Five-Year Outcomes for Women and Children in South Africa Dugdale C et al. IAS, Amsterdam July 2018, Late Breaker Outcome* DTG DTG demonstrated benefit EFV Δ DTG better by: Number of deaths among women 263,200 291,600 28,400 Sexual transmissions 192,500 245,300 52,800 Pediatric HIV infections 14,900 19,900 5,000 Non-neural tube defect-related pediatric deaths 90,800 92,400 1,600 EFV demonstrated benefit Neural tube defects Cumulative pediatric deaths** Children alive and HIV-free 3.4x EFV better by: 10,600 600 10,000 101,400 93,000 8,400 1,015,700 1,021,100 5,400 29 *Out of projected 3.5 million women ever on first-line ART and 1.1 million HIV-exposed children. **Cumulative pediatric deaths non-neural tube defect-related neural tube defect-related deaths
Results: Five-Year Outcomes for Women and Children in South Africa DTG-based ART all Amsterdam women would avertLate 25,000 Dugdale C et al.forIAS, July 2018, Breaker deaths among women of childbearing age and 5,000 Outcome* EFV Δ new pediatric HIV infectionsDTG vs EFV-based ART for all DTG demonstrated benefit women over 5 years in South Africa DTG better by: Number of deaths among women 263,200 291,600 28,400 Sexual transmissions These benefits 192,500 245,300 52,800 may come at expense of overall Pediatric HIV infections 14,900 19,900 pediatric survival if increased risk of NTDs with5,000 DTG Non-neural tube defect-related 92,400 fromdeaths Tsepamo persists with90,800 additional data 1,600 3.4x pediatric EFV demonstrated benefit EFV better by: However, there would be approximately 3-fold more Neural tube defects 10,600 600 10,000 deaths averted among women than pediatric deaths Cumulative pediatric deaths** 101,400 93,000 8,400 added use of DTG for1,015,700 all women of childbearing Children alivewith and HIV-free 1,021,100 5,400 age with HIV in South Africa compared with use of EFV for all women *Out of projected 3.5 million women ever on first-line ART and 1.1 million HIV-exposed children. **Cumulative pediatric deaths non-neural tube defect-related neural tube defect-related deaths 30
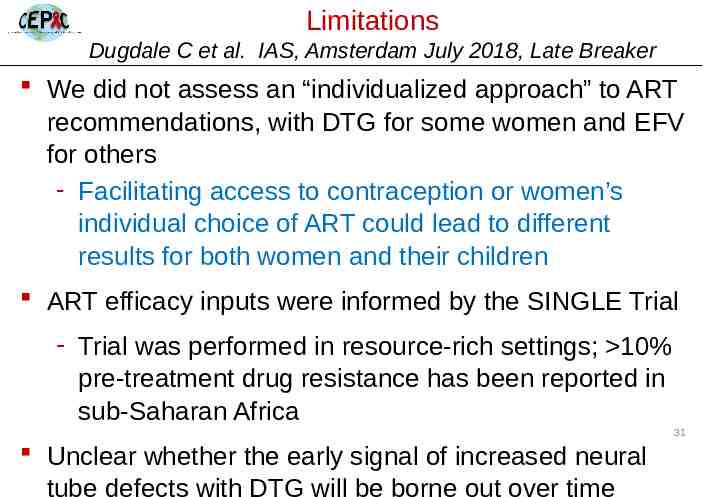
Limitations Dugdale C et al. IAS, Amsterdam July 2018, Late Breaker We did not assess an “individualized approach” to ART recommendations, with DTG for some women and EFV for others - Facilitating access to contraception or women’s individual choice of ART could lead to different results for both women and their children ART efficacy inputs were informed by the SINGLE Trial - Trial was performed in resource-rich settings; 10% pre-treatment drug resistance has been reported in sub-Saharan Africa 31 Unclear whether the early signal of increased neural tube defects with DTG will be borne out over time
Main Subject Everything Dolutegravir WHO 2018 Guidelines Update
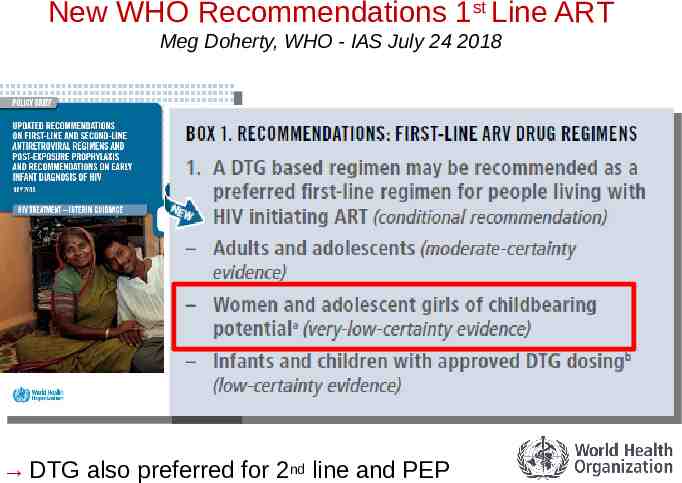
New WHO Recommendations 1st Line ART Meg Doherty, WHO - IAS July 24 2018 DTG also preferred for 2nd line and PEP
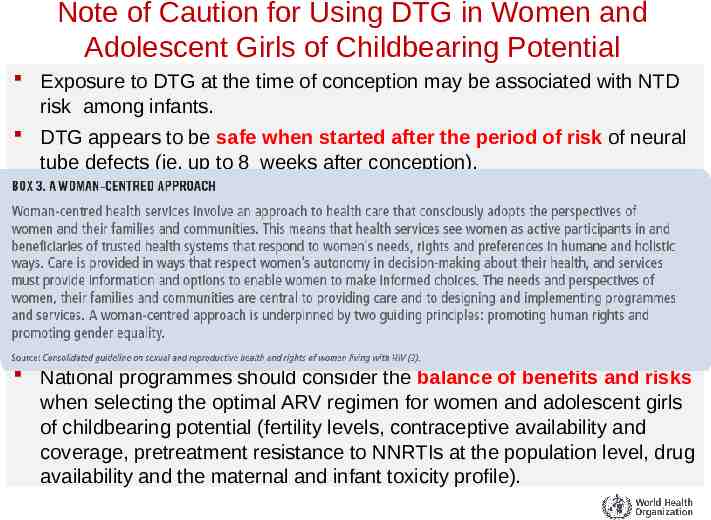
Note of Caution for Using DTG in Women and Adolescent Girls of Childbearing Potential Exposure to DTG at the time of conception may be associated with NTD risk among infants. DTG appears to be safe when started after the period of risk of neural tube defects (ie, up to 8 weeks after conception). Adolescent girls and women of childbearing potential who do not currently want to become pregnant can receive DTG together with consistent contraception (hormonal contraception and DTG have no reported or expected drug–drug interactions). An EFV-based regimen is a safe and effective first-line regimen and can be used among women of childbearing potential during the period of potential risk for developing NTDs. National programmes should consider the balance of benefits and risks when selecting the optimal ARV regimen for women and adolescent girls of childbearing potential (fertility levels, contraceptive availability and coverage, pretreatment resistance to NNRTIs at the population level, drug availability and the maternal and infant toxicity profile).
Prevention of Mother to Child HIV Transmission
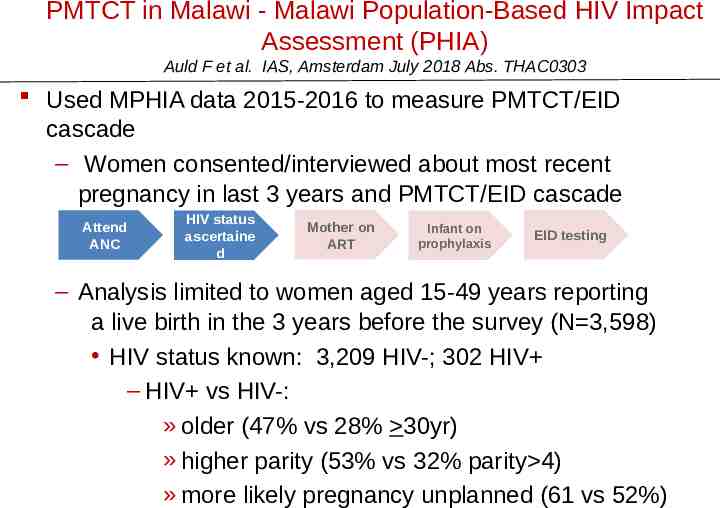
PMTCT in Malawi - Malawi Population-Based HIV Impact Assessment (PHIA) Auld F et al. IAS, Amsterdam July 2018 Abs. THAC0303 Used MPHIA data 2015-2016 to measure PMTCT/EID cascade – Women consented/interviewed about most recent pregnancy in last 3 years and PMTCT/EID cascade Attend ANC HIV status ascertaine d Mother on ART Infant on prophylaxis EID testing – Analysis limited to women aged 15-49 years reporting a live birth in the 3 years before the survey (N 3,598) HIV status known: 3,209 HIV-; 302 HIV – HIV vs HIV-: » older (47% vs 28% 30yr) » higher parity (53% vs 32% parity 4) » more likely pregnancy unplanned (61 vs 52%)
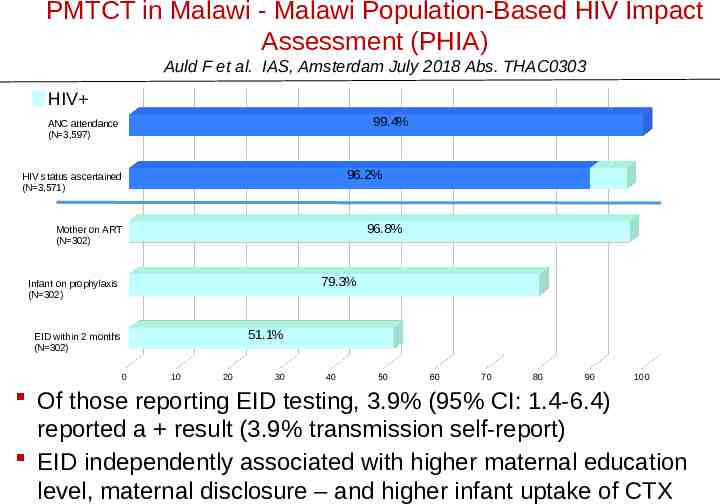
PMTCT in Malawi - Malawi Population-Based HIV Impact Assessment (PHIA) Auld F et al. IAS, Amsterdam July 2018 Abs. THAC0303 HIV 99.4% ANC attendance (N 3,597) 96.2% HIV status ascertained (N 3,571) 96.8% Mother on ART (N 302) 79.3% Infant on prophylaxis (N 302) 51.1% EID within 2 months (N 302) 0 10 20 30 40 50 60 70 80 90 100 Of those reporting EID testing, 3.9% (95% CI: 1.4-6.4) reported a result (3.9% transmission self-report) EID independently associated with higher maternal education level, maternal disclosure – and higher infant uptake of CTX
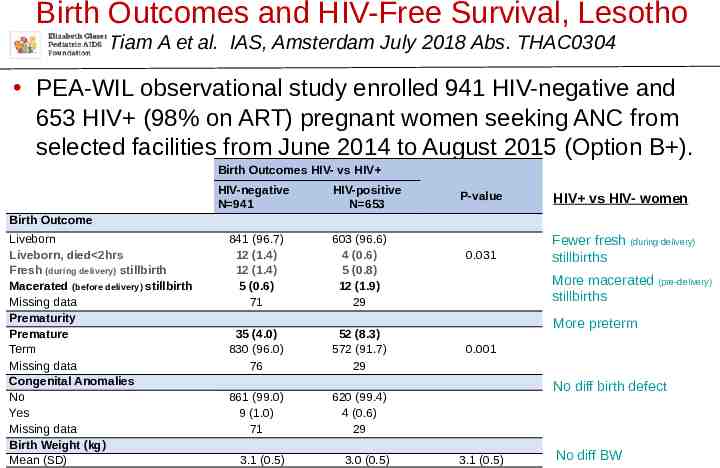
Birth Outcomes and HIV-Free Survival, Lesotho Tiam A et al. IAS, Amsterdam July 2018 Abs. THAC0304 PEA-WIL observational study enrolled 941 HIV-negative and 653 HIV (98% on ART) pregnant women seeking ANC from selected facilities from June 2014 to August 2015 (Option B ). Birth Outcomes HIV- vs HIV HIV-negative N 941 HIV-positive N 653 P-value HIV vs HIV- women 0.031 Fewer fresh (during delivery) stillbirths Birth Outcome Liveborn Liveborn, died 2hrs Fresh (during delivery) stillbirth Macerated (before delivery) stillbirth Missing data Prematurity Premature Term Missing data Congenital Anomalies No Yes Missing data Birth Weight (kg) Mean (SD) 841 (96.7) 12 (1.4) 12 (1.4) 5 (0.6) 71 603 (96.6) 4 (0.6) 5 (0.8) 12 (1.9) 29 35 (4.0) 830 (96.0) 76 52 (8.3) 572 (91.7) 29 861 (99.0) 9 (1.0) 71 620 (99.4) 4 (0.6) 29 3.1 (0.5) 3.0 (0.5) More macerated (pre-delivery) stillbirths More preterm 0.001 No diff birth defect 3.1 (0.5) No diff BW
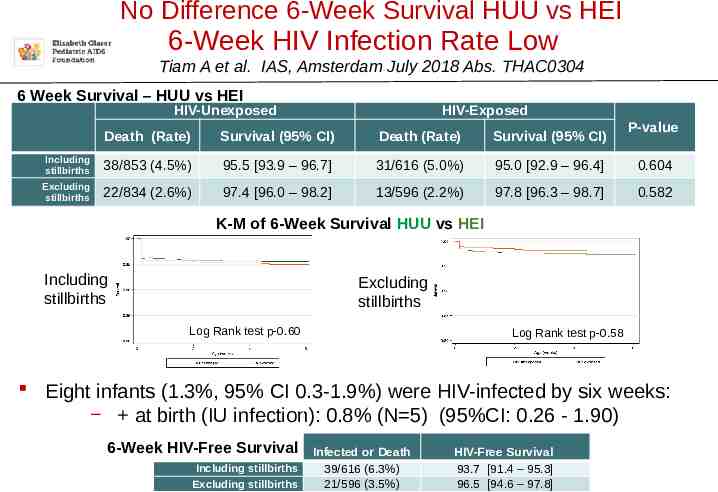
No Difference 6-Week Survival HUU vs HEI 6-Week HIV Infection Rate Low Tiam A et al. IAS, Amsterdam July 2018 Abs. THAC0304 6 Week Survival – HUU vs HEI HIV-Unexposed HIV-Exposed P-value Death (Rate) Survival (95% CI) Death (Rate) Survival (95% CI) Including stillbirths 38/853 (4.5%) 95.5 [93.9 – 96.7] 31/616 (5.0%) 95.0 [92.9 – 96.4] 0.604 Excluding stillbirths 22/834 (2.6%) 97.4 [96.0 – 98.2] 13/596 (2.2%) 97.8 [96.3 – 98.7] 0.582 K-M of 6-Week Survival HUU vs HEI Including stillbirths Excluding stillbirths Log Rank test p-0.60 Log Rank test p-0.58 Eight infants (1.3%, 95% CI 0.3-1.9%) were HIV-infected by six weeks: at birth (IU infection): 0.8% (N 5) (95%CI: 0.26 - 1.90) 6-Week HIV-Free Survival Including stillbirths Excluding stillbirths Infected or Death 39/616 (6.3%) 21/596 (3.5%) HIV-Free Survival 93.7 [91.4 – 95.3] 96.5 [94.6 – 97.8]
Safer Conception
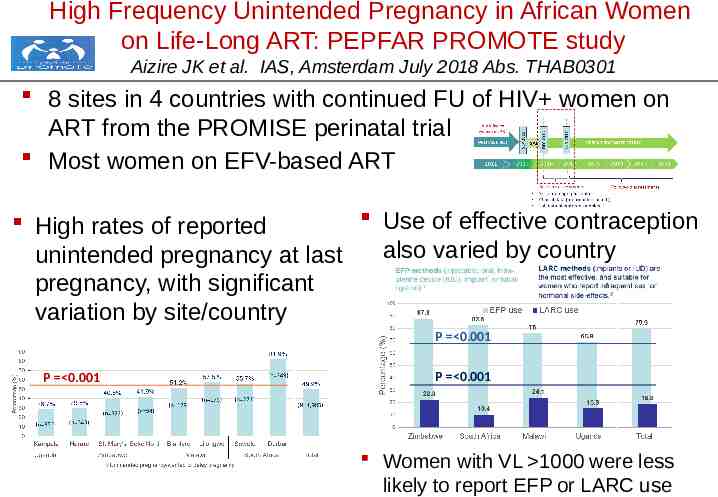
High Frequency Unintended Pregnancy in African Women on Life-Long ART: PEPFAR PROMOTE study Aizire JK et al. IAS, Amsterdam July 2018 Abs. THAB0301 8 sites in 4 countries with continued FU of HIV women on ART from the PROMISE perinatal trial Most women on EFV-based ART Use of effective contraception High rates of reported also varied by country unintended pregnancy at last pregnancy, with significant variation by site/country P 0.001 P 0.001 P 0.001 Women with VL 1000 were less likely to report EFP or LARC use
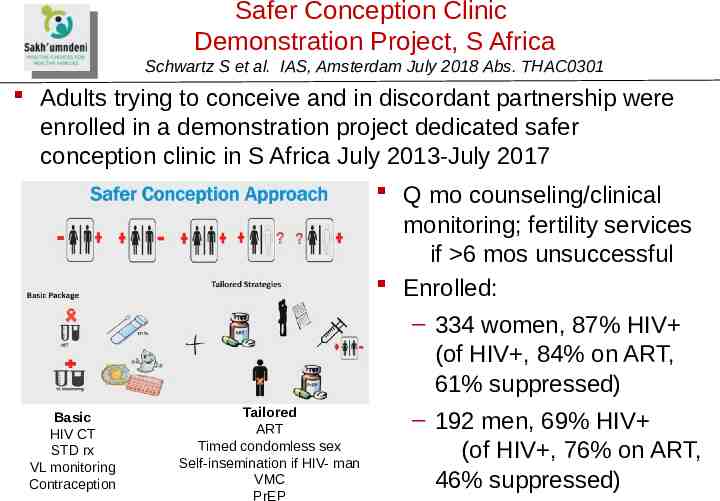
Safer Conception Clinic Demonstration Project, S Africa Schwartz S et al. IAS, Amsterdam July 2018 Abs. THAC0301 Adults trying to conceive and in discordant partnership were enrolled in a demonstration project dedicated safer conception clinic in S Africa July 2013-July 2017 Q mo counseling/clinical monitoring; fertility services if 6 mos unsuccessful Enrolled: – 334 women, 87% HIV (of HIV , 84% on ART, 61% suppressed) Tailored Basic – 192 men, 69% HIV ART HIV CT Timed condomless sex STD rx (of HIV , 76% on ART, Self-insemination if HIV- man VL monitoring VMC 46% suppressed) Contraception PrEP
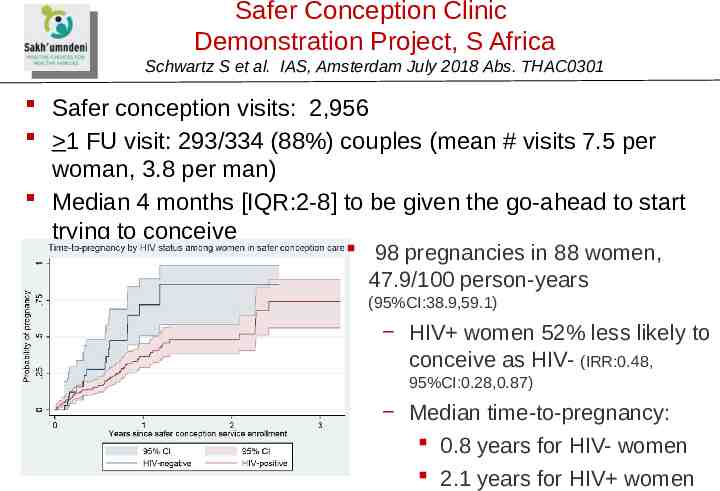
Safer Conception Clinic Demonstration Project, S Africa Schwartz S et al. IAS, Amsterdam July 2018 Abs. THAC0301 Safer conception visits: 2,956 1 FU visit: 293/334 (88%) couples (mean # visits 7.5 per woman, 3.8 per man) Median 4 months [IQR:2-8] to be given the go-ahead to start trying to conceive 98 pregnancies in 88 women, 47.9/100 person-years (95%CI:38.9,59.1) HIV women 52% less likely to conceive as HIV- (IRR:0.48, 95%CI:0.28,0.87) Median time-to-pregnancy: 0.8 years for HIV- women 2.1 years for HIV women
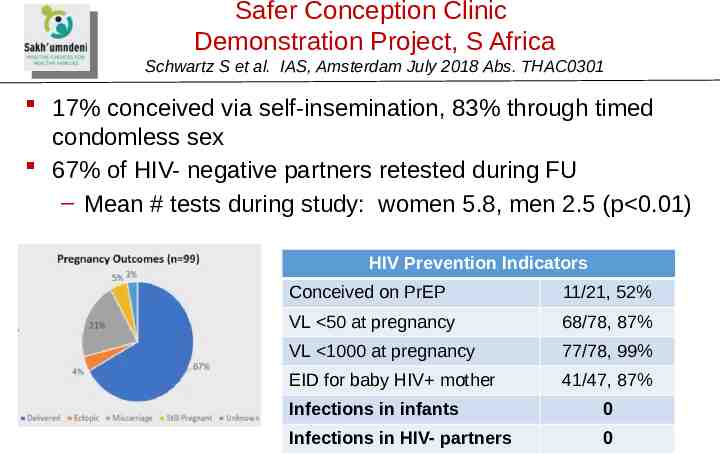
Safer Conception Clinic Demonstration Project, S Africa Schwartz S et al. IAS, Amsterdam July 2018 Abs. THAC0301 17% conceived via self-insemination, 83% through timed condomless sex 67% of HIV- negative partners retested during FU – Mean # tests during study: women 5.8, men 2.5 (p 0.01) HIV Prevention Indicators Conceived on PrEP 11/21, 52% VL 50 at pregnancy 68/78, 87% VL 1000 at pregnancy 77/78, 99% EID for baby HIV mother 41/47, 87% Infections in infants 0 Infections in HIV- partners 0
Infant HIV Diagnosis and HIV Testing Older Children
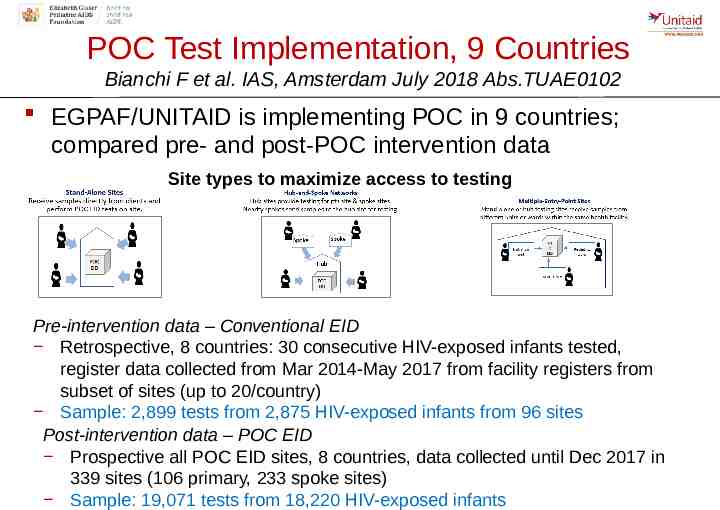
POC Test Implementation, 9 Countries Bianchi F et al. IAS, Amsterdam July 2018 Abs.TUAE0102 EGPAF/UNITAID is implementing POC in 9 countries; compared pre- and post-POC intervention data Site types to maximize access to testing Pre-intervention data – Conventional EID Retrospective, 8 countries: 30 consecutive HIV-exposed infants tested, register data collected from Mar 2014-May 2017 from facility registers from subset of sites (up to 20/country) Sample: 2,899 tests from 2,875 HIV-exposed infants from 96 sites Post-intervention data – POC EID Prospective all POC EID sites, 8 countries, data collected until Dec 2017 in 339 sites (106 primary, 233 spoke sites) Sample: 19,071 tests from 18,220 HIV-exposed infants
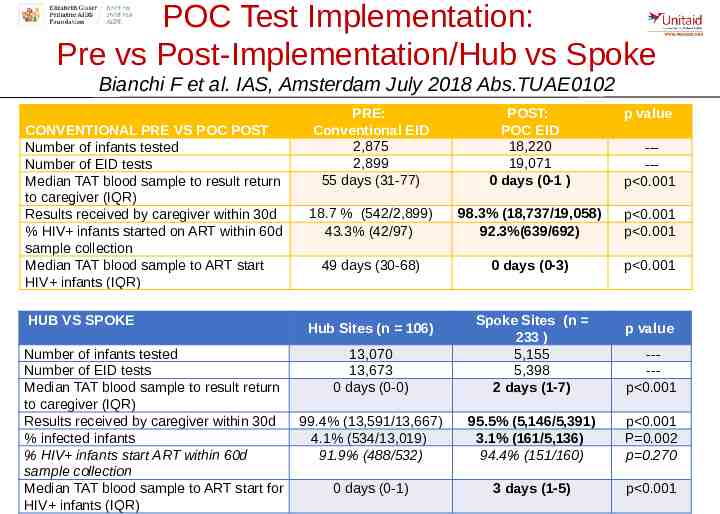
POC Test Implementation: Pre vs Post-Implementation/Hub vs Spoke Bianchi F et al. IAS, Amsterdam July 2018 Abs.TUAE0102 CONVENTIONAL PRE VS POC POST Number of infants tested Number of EID tests Median TAT blood sample to result return to caregiver (IQR) Results received by caregiver within 30d % HIV infants started on ART within 60d sample collection Median TAT blood sample to ART start HIV infants (IQR) HUB VS SPOKE Number of infants tested Number of EID tests Median TAT blood sample to result return to caregiver (IQR) Results received by caregiver within 30d % infected infants % HIV infants start ART within 60d sample collection Median TAT blood sample to ART start for HIV infants (IQR) PRE: Conventional EID 2,875 2,899 55 days (31-77) POST: POC EID 18,220 19,071 0 days (0-1 ) p value 18.7 % (542/2,899) 43.3% (42/97) 98.3% (18,737/19,058) 92.3%(639/692) p 0.001 p 0.001 49 days (30-68) 0 days (0-3) p 0.001 ----p 0.001 13,070 13,673 0 days (0-0) Spoke Sites (n 233 ) 5,155 5,398 2 days (1-7) 99.4% (13,591/13,667) 4.1% (534/13,019) 91.9% (488/532) 95.5% (5,146/5,391) 3.1% (161/5,136) 94.4% (151/160) p 0.001 P 0.002 p 0.270 0 days (0-1) 3 days (1-5) p 0.001 Hub Sites (n 106) p value ----p 0.001
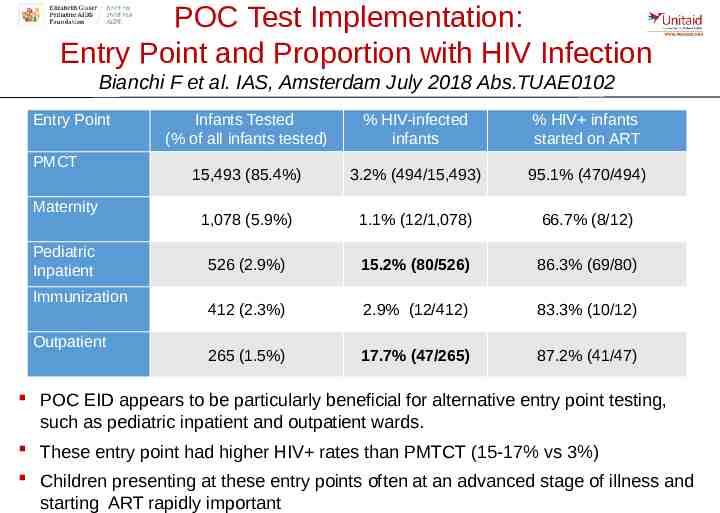
POC Test Implementation: Entry Point and Proportion with HIV Infection Bianchi F et al. IAS, Amsterdam July 2018 Abs.TUAE0102 Entry Point PMCT Maternity Pediatric Inpatient Immunization Outpatient Infants Tested (% of all infants tested) % HIV-infected infants % HIV infants started on ART 15,493 (85.4%) 3.2% (494/15,493) 95.1% (470/494) 1,078 (5.9%) 1.1% (12/1,078) 66.7% (8/12) 526 (2.9%) 15.2% (80/526) 86.3% (69/80) 412 (2.3%) 2.9% (12/412) 83.3% (10/12) 265 (1.5%) 17.7% (47/265) 87.2% (41/47) POC EID appears to be particularly beneficial for alternative entry point testing, such as pediatric inpatient and outpatient wards. These entry point had higher HIV rates than PMTCT (15-17% vs 3%) Children presenting at these entry points often at an advanced stage of illness and starting ART rapidly important
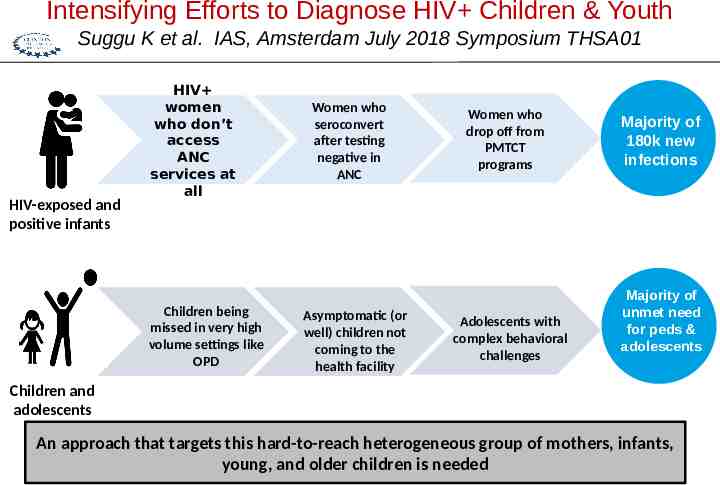
Intensifying Efforts to Diagnose HIV Children & Youth Suggu K et al. IAS, Amsterdam July 2018 Symposium THSA01 HIV-exposed and positive infants HIV women who don’t access ANC services at all Children being missed in very high volume settings like OPD Women who seroconvert after testing negative in ANC Asymptomatic (or well) children not coming to the health facility Women who drop off from PMTCT programs Adolescents with complex behavioral challenges Majority of 180k new infections Majority of unmet need for peds & adolescents Children and adolescents An approach that targets this hard-to-reach heterogeneous group of mothers, infants, young, and older children is needed
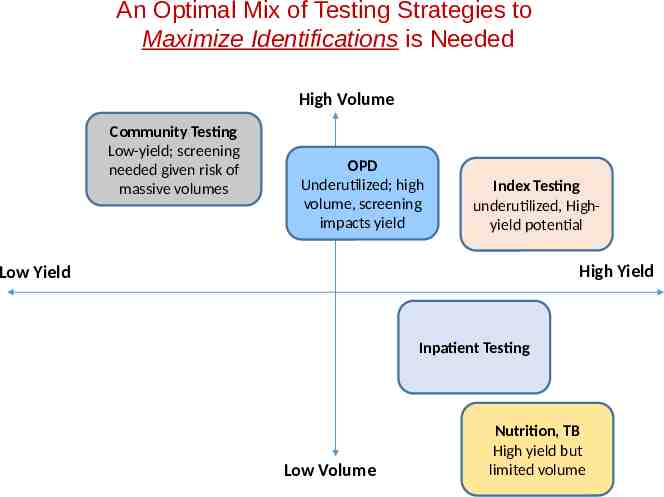
An Optimal Mix of Testing Strategies to Maximize Identifications is Needed High Volume Community Testing Low-yield; screening needed given risk of massive volumes OPD Underutilized; high volume, screening impacts yield Index Testing underutilized, Highyield potential High Yield Low Yield Inpatient Testing Low Volume Nutrition, TB High yield but limited volume
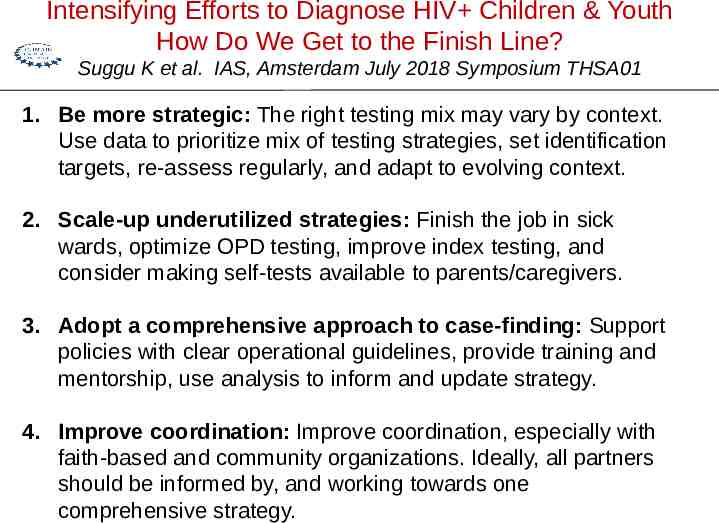
Intensifying Efforts to Diagnose HIV Children & Youth How Do We Get to the Finish Line? Suggu K et al. IAS, Amsterdam July 2018 Symposium THSA01 1. Be more strategic: The right testing mix may vary by context. Use data to prioritize mix of testing strategies, set identification targets, re-assess regularly, and adapt to evolving context. 2. Scale-up underutilized strategies: Finish the job in sick wards, optimize OPD testing, improve index testing, and consider making self-tests available to parents/caregivers. 3. Adopt a comprehensive approach to case-finding: Support policies with clear operational guidelines, provide training and mentorship, use analysis to inform and update strategy. 4. Improve coordination: Improve coordination, especially with faith-based and community organizations. Ideally, all partners should be informed by, and working towards one comprehensive strategy.
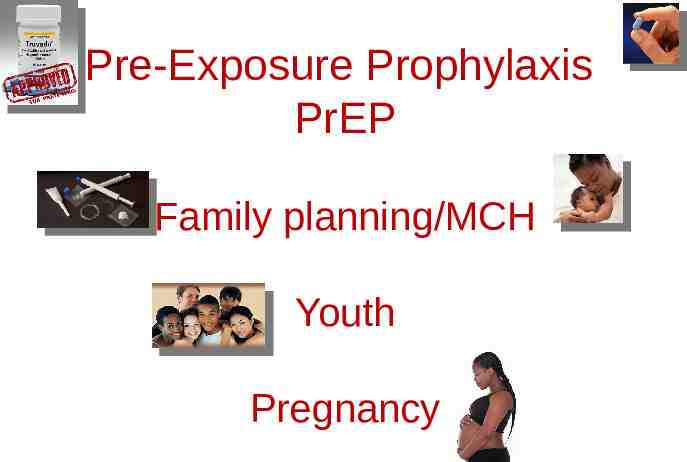
Pre-Exposure Prophylaxis PrEP Family planning/MCH Youth Pregnancy
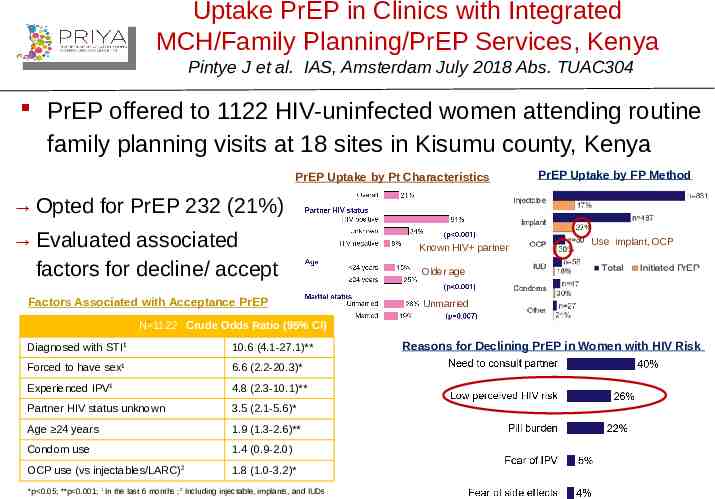
Uptake PrEP in Clinics with Integrated MCH/Family Planning/PrEP Services, Kenya Pintye J et al. IAS, Amsterdam July 2018 Abs. TUAC304 PrEP offered to 1122 HIV-uninfected women attending routine family planning visits at 18 sites in Kisumu county, Kenya PrEP Uptake by Pt Characteristics PrEP Uptake by FP Method Opted for PrEP 232 (21%) Evaluated associated factors for decline/ accept Factors Associated with Acceptance PrEP Known HIV partner Use implant, OCP Older age Unmarried N 1122 Crude Odds Ratio (95% CI) Diagnosed with STI1 10.6 (4.1-27.1)** Forced to have sex1 6.6 (2.2-20.3)* Experienced IPV1 4.8 (2.3-10.1)** Partner HIV status unknown 3.5 (2.1-5.6)* Age 24 years 1.9 (1.3-2.6)** Condom use 1.4 (0.9-2.0) OCP use (vs injectables/LARC)2 1.8 (1.0-3.2)* *p 0.05; **p 0.001; 1 In the last 6 months ;2 Including injectable, implants, and IUDs Reasons for Declining PrEP in Women with HIV Risk
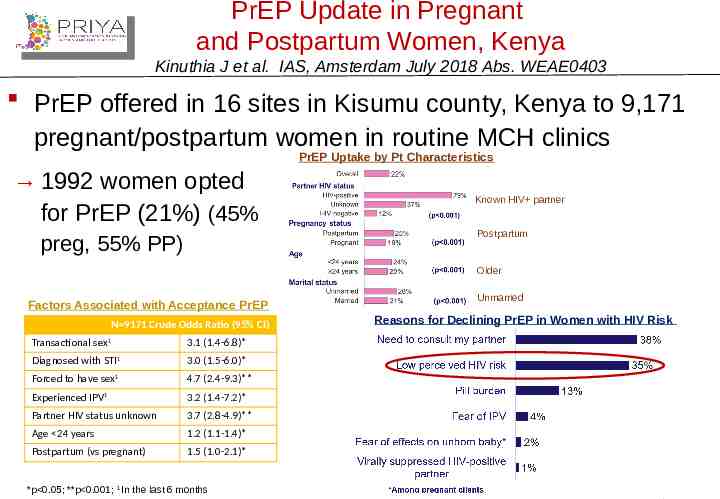
PrEP Update in Pregnant and Postpartum Women, Kenya Kinuthia J et al. IAS, Amsterdam July 2018 Abs. WEAE0403 PrEP offered in 16 sites in Kisumu county, Kenya to 9,171 pregnant/postpartum women in routine MCH clinics PrEP Uptake by Pt Characteristics 1992 women opted for PrEP (21%) (45% Known HIV partner Postpartum preg, 55% PP) Older Factors Associated with Acceptance PrEP N 9171 Crude Odds Ratio (95% CI) Transactional sex1 3.1 (1.4-6.8)* Diagnosed with STI1 3.0 (1.5-6.0)* Forced to have sex1 4.7 (2.4-9.3)** Experienced IPV1 3.2 (1.4-7.2)* Partner HIV status unknown 3.7 (2.8-4.9)** Age 24 years 1.2 (1.1-1.4)* Postpartum (vs pregnant) 1.5 (1.0-2.1)* *p 0.05; **p 0.001; 1 In the last 6 months Unmarried Reasons for Declining PrEP in Women with HIV Risk
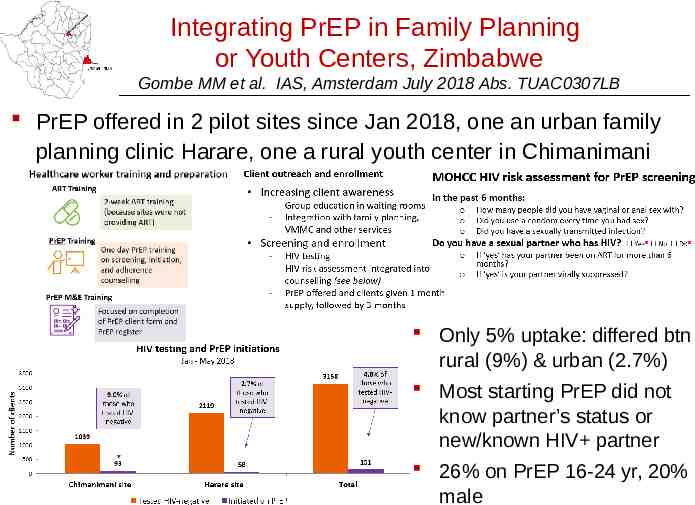
Integrating PrEP in Family Planning or Youth Centers, Zimbabwe Gombe MM et al. IAS, Amsterdam July 2018 Abs. TUAC0307LB PrEP offered in 2 pilot sites since Jan 2018, one an urban family planning clinic Harare, one a rural youth center in Chimanimani Only 5% uptake: differed btn rural (9%) & urban (2.7%) Most starting PrEP did not know partner’s status or new/known HIV partner 26% on PrEP 16-24 yr, 20% male
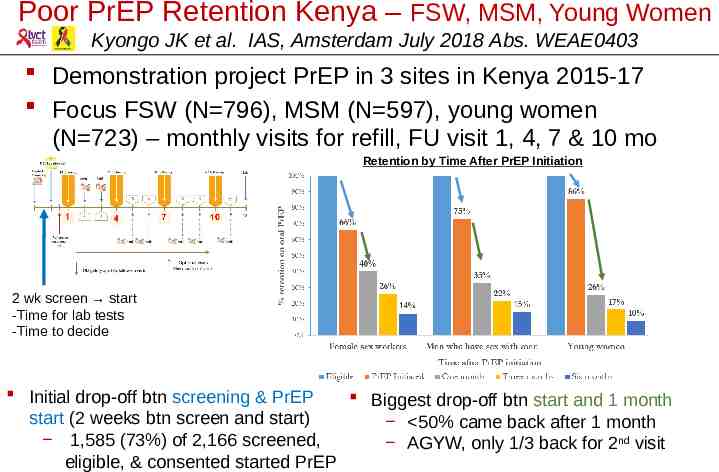
Poor PrEP Retention Kenya – FSW, MSM, Young Women Kyongo JK et al. IAS, Amsterdam July 2018 Abs. WEAE0403 Demonstration project PrEP in 3 sites in Kenya 2015-17 Focus FSW (N 796), MSM (N 597), young women (N 723) – monthly visits for refill, FU visit 1, 4, 7 & 10 mo Retention by Time After PrEP Initiation 2 wk screen start -Time for lab tests -Time to decide Initial drop-off btn screening & PrEP Biggest drop-off btn start and 1 month start (2 weeks btn screen and start) 50% came back after 1 month 1,585 (73%) of 2,166 screened, AGYW, only 1/3 back for 2nd visit eligible, & consented started PrEP
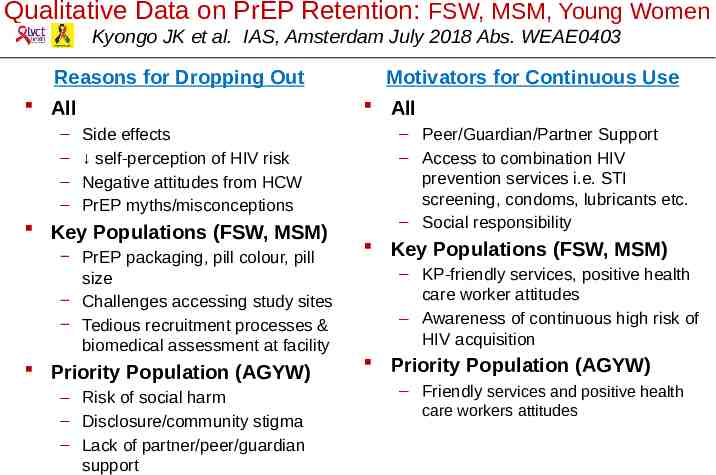
Qualitative Data on PrEP Retention: FSW, MSM, Young Women Kyongo JK et al. IAS, Amsterdam July 2018 Abs. WEAE0403 Reasons for Dropping Out All – – – – Motivators for Continuous Use All Side effects self-perception of HIV risk Negative attitudes from HCW PrEP myths/misconceptions Key Populations (FSW, MSM) PrEP packaging, pill colour, pill size Challenges accessing study sites Tedious recruitment processes & biomedical assessment at facility Priority Population (AGYW) – Risk of social harm – Disclosure/community stigma – Lack of partner/peer/guardian support – Peer/Guardian/Partner Support – Access to combination HIV prevention services i.e. STI screening, condoms, lubricants etc. – Social responsibility Key Populations (FSW, MSM) – KP-friendly services, positive health care worker attitudes – Awareness of continuous high risk of HIV acquisition Priority Population (AGYW) – Friendly services and positive health care workers attitudes
Pediatric Antiretroviral Treatment and Care
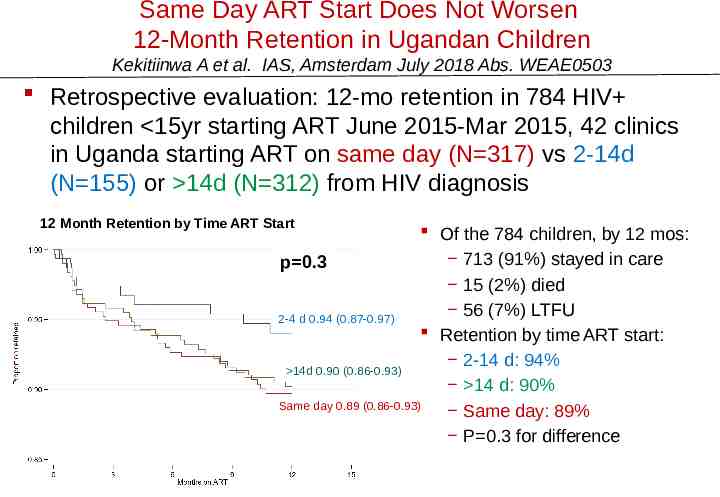
Same Day ART Start Does Not Worsen 12-Month Retention in Ugandan Children Kekitiinwa A et al. IAS, Amsterdam July 2018 Abs. WEAE0503 Retrospective evaluation: 12-mo retention in 784 HIV children 15yr starting ART June 2015-Mar 2015, 42 clinics in Uganda starting ART on same day (N 317) vs 2-14d (N 155) or 14d (N 312) from HIV diagnosis 12 Month Retention by Time ART Start Of the 784 children, by 12 mos: 713 (91%) stayed in care p 0.3 15 (2%) died 56 (7%) LTFU 2-4 d 0.94 (0.87-0.97) Retention by time ART start: 2-14 d: 94% 14d 0.90 (0.86-0.93) 14 d: 90% Same day 0.89 (0.86-0.93) Same day: 89% P 0.3 for difference
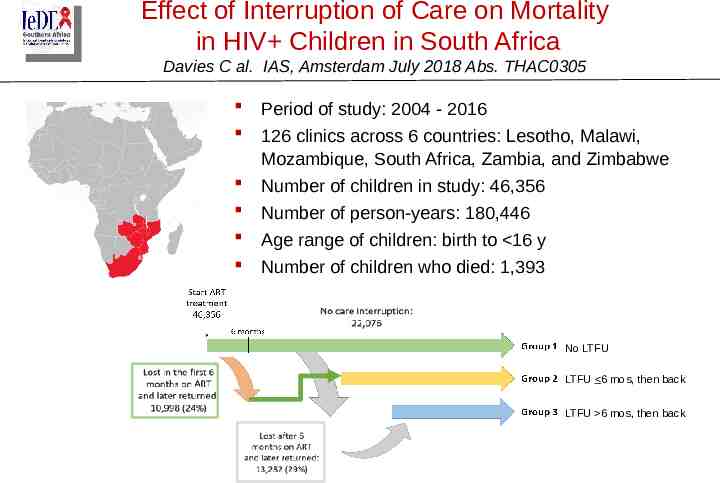
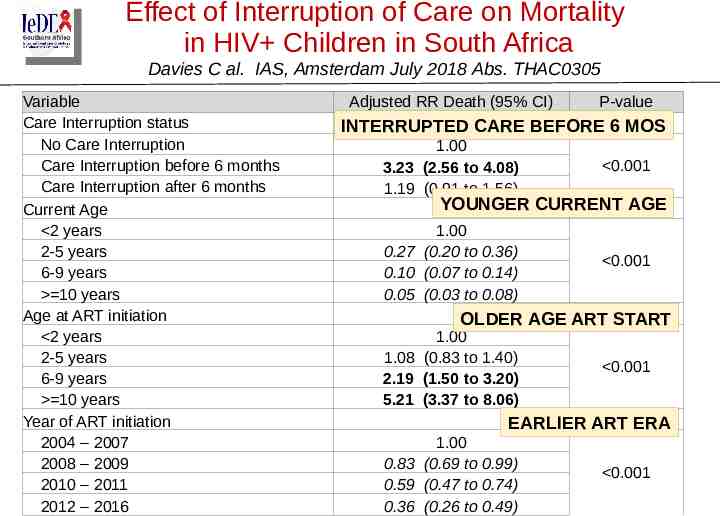
Effect of Interruption of Care on Mortality in HIV Children in South Africa Davies C al. IAS, Amsterdam July 2018 Abs. THAC0305 Period of study: 2004 - 2016 126 clinics across 6 countries: Lesotho, Malawi, Mozambique, South Africa, Zambia, and Zimbabwe Number of children in study: 46,356 Number of person-years: 180,446 Age range of children: birth to 16 y Number of children who died: 1,393 No LTFU LTFU 6 mos, then back LTFU 6 mos, then back
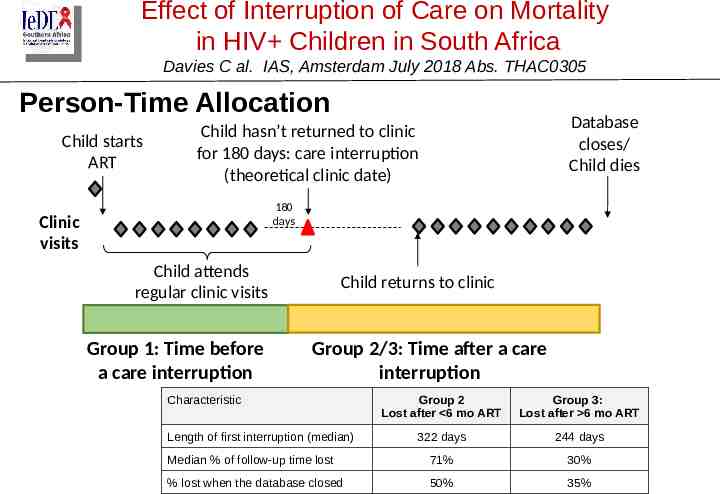
Effect of Interruption of Care on Mortality in HIV Children in South Africa Davies C al. IAS, Amsterdam July 2018 Abs. THAC0305 Person-Time Allocation Child starts ART Database closes/ Child dies Child hasn’t returned to clinic for 180 days: care interruption (theoretical clinic date) 180 days Clinic visits Child attends regular clinic visits Group 1: Time before a care interruption Child returns to clinic Group 2/3: Time after a care interruption Characteristic Group 2 Lost after 6 mo ART Group 3: Lost after 6 mo ART 322 days 244 days Median % of follow-up time lost 71% 30% % lost when the database closed 50% 35% Length of first interruption (median)
Effect of Interruption of Care on Mortality in HIV Children in South Africa Davies C al. IAS, Amsterdam July 2018 Abs. THAC0305 Variable Care Interruption status No Care Interruption Care Interruption before 6 months Care Interruption after 6 months Current Age 2 years 2-5 years 6-9 years 10 years Age at ART initiation 2 years 2-5 years 6-9 years 10 years Year of ART initiation 2004 – 2007 2008 – 2009 2010 – 2011 2012 – 2016 Adjusted RR Death (95% CI) P-value INTERRUPTED CARE BEFORE 6 MOS 1.00 3.23 (2.56 to 4.08) 1.19 (0.91 to 1.56) 0.001 1.00 0.27 (0.20 to 0.36) 0.10 (0.07 to 0.14) 0.05 (0.03 to 0.08) 0.001 YOUNGER CURRENT AGE OLDER AGE ART START 1.00 1.08 (0.83 to 1.40) 2.19 (1.50 to 3.20) 5.21 (3.37 to 8.06) 0.001 EARLIER ART ERA 1.00 0.83 (0.69 to 0.99) 0.59 (0.47 to 0.74) 0.36 (0.26 to 0.49) 0.001
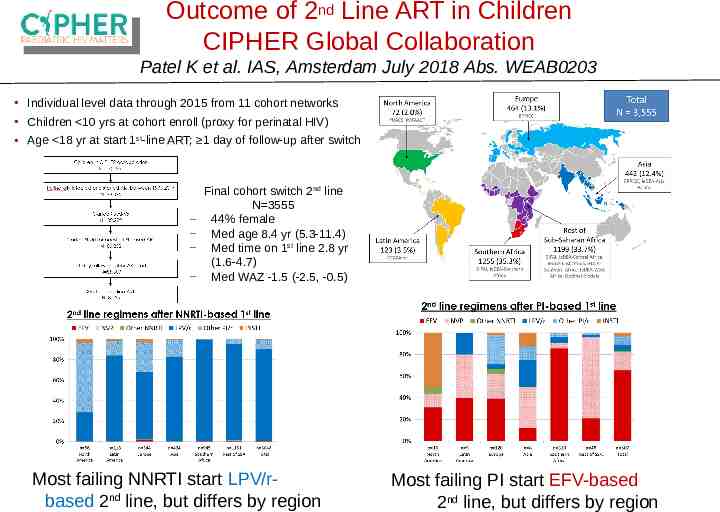
Outcome of 2nd Line ART in Children CIPHER Global Collaboration Patel K et al. IAS, Amsterdam July 2018 Abs. WEAB0203 Individual level data through 2015 from 11 cohort networks Children 10 yrs at cohort enroll (proxy for perinatal HIV) Age 18 yr at start 1st-line ART; 1 day of follow-up after switch Final cohort switch 2nd line N 3555 44% female Med age 8.4 yr (5.3-11.4) Med time on 1st line 2.8 yr (1.6-4.7) Med WAZ -1.5 (-2.5, -0.5) Most failing NNRTI start LPV/rbased 2nd line, but differs by region Most failing PI start EFV-based 2nd line, but differs by region
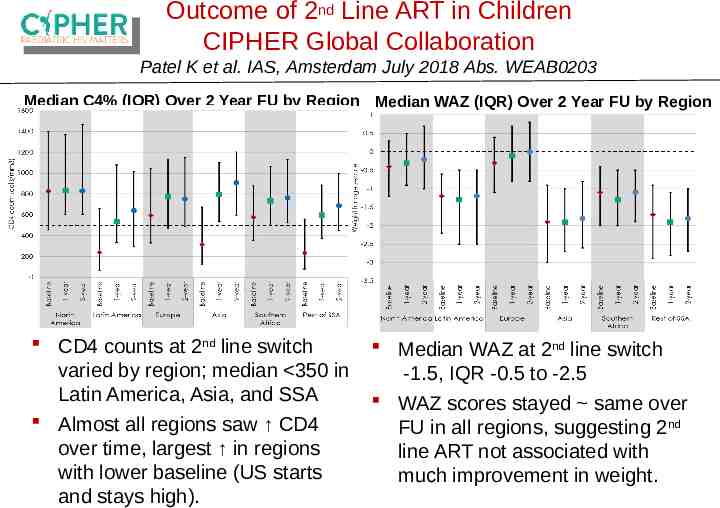
Outcome of 2nd Line ART in Children CIPHER Global Collaboration Patel K et al. IAS, Amsterdam July 2018 Abs. WEAB0203 Median C4% (IQR) Over 2 Year FU by Region Median WAZ (IQR) Over 2 Year FU by Region CD4 counts at 2nd line switch varied by region; median 350 in Latin America, Asia, and SSA Almost all regions saw CD4 over time, largest in regions with lower baseline (US starts and stays high). Median WAZ at 2nd line switch -1.5, IQR -0.5 to -2.5 WAZ scores stayed same over FU in all regions, suggesting 2nd line ART not associated with much improvement in weight.
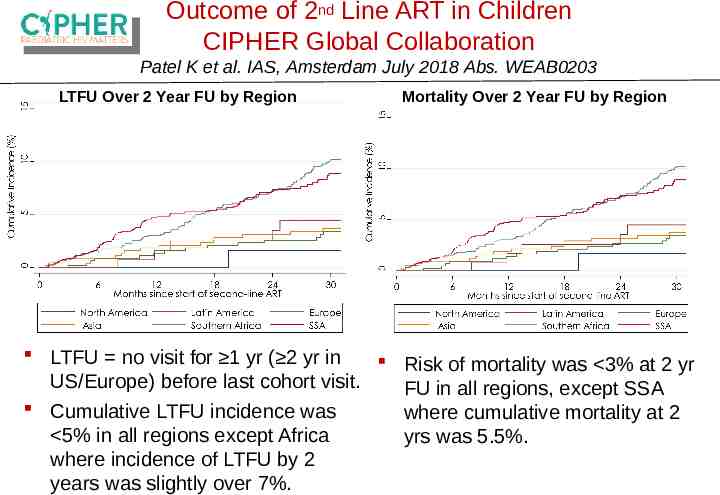
Outcome of 2nd Line ART in Children CIPHER Global Collaboration Patel K et al. IAS, Amsterdam July 2018 Abs. WEAB0203 LTFU Over 2 Year FU by Region Mortality Over 2 Year FU by Region LTFU no visit for 1 yr ( 2 yr in Risk of mortality was 3% at 2 yr US/Europe) before last cohort visit. FU in all regions, except SSA Cumulative LTFU incidence was where cumulative mortality at 2 5% in all regions except Africa yrs was 5.5%. where incidence of LTFU by 2 years was slightly over 7%.
Adolescents and HIV
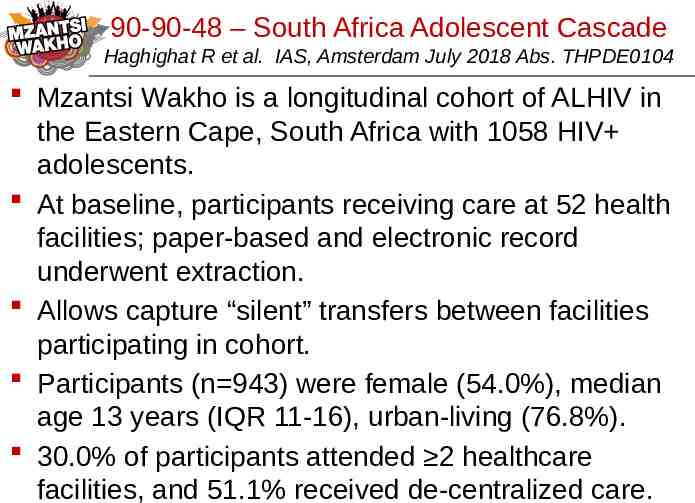
90-90-48 – South Africa Adolescent Cascade Haghighat R et al. IAS, Amsterdam July 2018 Abs. THPDE0104 Mzantsi Wakho is a longitudinal cohort of ALHIV in the Eastern Cape, South Africa with 1058 HIV adolescents. At baseline, participants receiving care at 52 health facilities; paper-based and electronic record underwent extraction. Allows capture “silent” transfers between facilities participating in cohort. Participants (n 943) were female (54.0%), median age 13 years (IQR 11-16), urban-living (76.8%). 30.0% of participants attended 2 healthcare facilities, and 51.1% received de-centralized care.
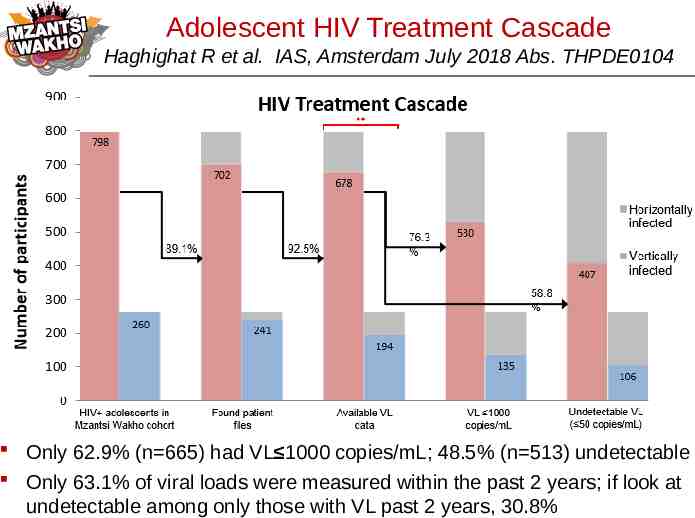
Adolescent HIV Treatment Cascade Haghighat R et al. IAS, Amsterdam July 2018 Abs. THPDE0104 Only 62.9% (n 665) had VL 1000 copies/mL; 48.5% (n 513) undetectable Only 63.1% of viral loads were measured within the past 2 years; if look at undetectable among only those with VL past 2 years, 30.8%
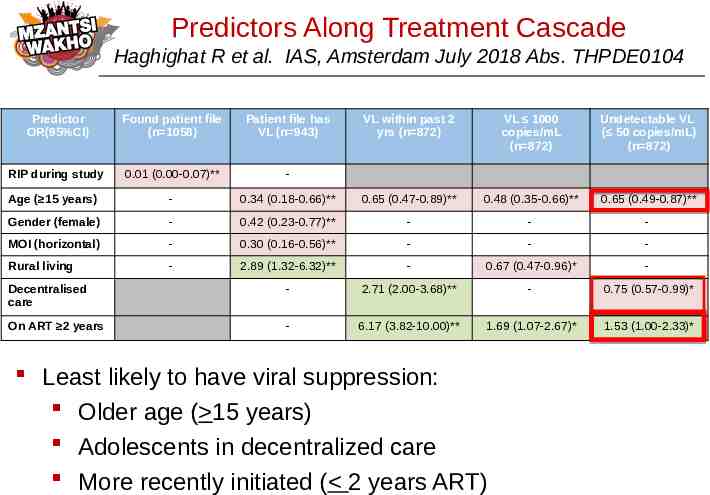
Predictors Along Treatment Cascade Haghighat R et al. IAS, Amsterdam July 2018 Abs. THPDE0104 Predictor OR(95%CI) Found patient file (n 1058) Patient file has VL (n 943) VL within past 2 yrs (n 872) VL 1000 copies/mL (n 872) Undetectable VL ( 50 copies/mL) (n 872) RIP during study 0.01 (0.00-0.07)** - Age ( 15 years) - 0.34 (0.18-0.66)** 0.65 (0.47-0.89)** 0.48 (0.35-0.66)** 0.65 (0.49-0.87)** Gender (female) - 0.42 (0.23-0.77)** - - - MOI (horizontal) - 0.30 (0.16-0.56)** - - - Rural living - 2.89 (1.32-6.32)** - 0.67 (0.47-0.96)* - Decentralised care - 2.71 (2.00-3.68)** - 0.75 (0.57-0.99)* On ART 2 years - 6.17 (3.82-10.00)** 1.69 (1.07-2.67)* 1.53 (1.00-2.33)* Least likely to have viral suppression: Older age ( 15 years) Adolescents in decentralized care More recently initiated ( 2 years ART)
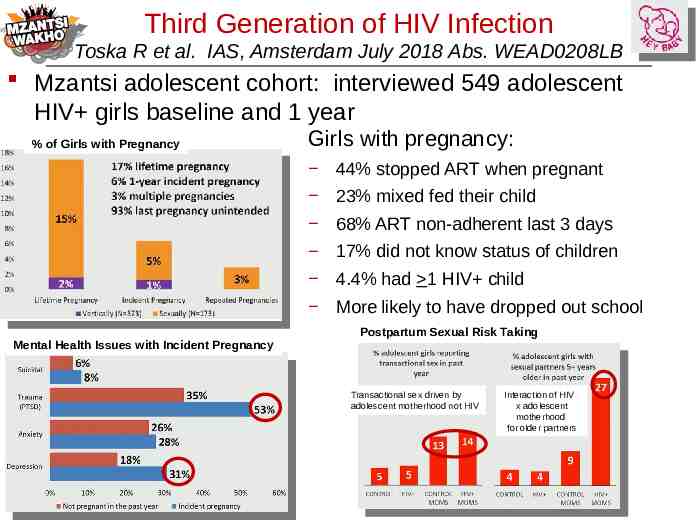
Third Generation of HIV Infection Toska R et al. IAS, Amsterdam July 2018 Abs. WEAD0208LB Mzantsi adolescent cohort: interviewed 549 adolescent HIV girls baseline and 1 year % of Girls with Pregnancy Girls with pregnancy: 44% stopped ART when pregnant 23% mixed fed their child 68% ART non-adherent last 3 days 17% did not know status of children 4.4% had 1 HIV child More likely to have dropped out school Mental Health Issues with Incident Pregnancy Postpartum Sexual Risk Taking Transactional sex driven by adolescent motherhood not HIV Interaction of HIV x adolescent motherhood for older partners
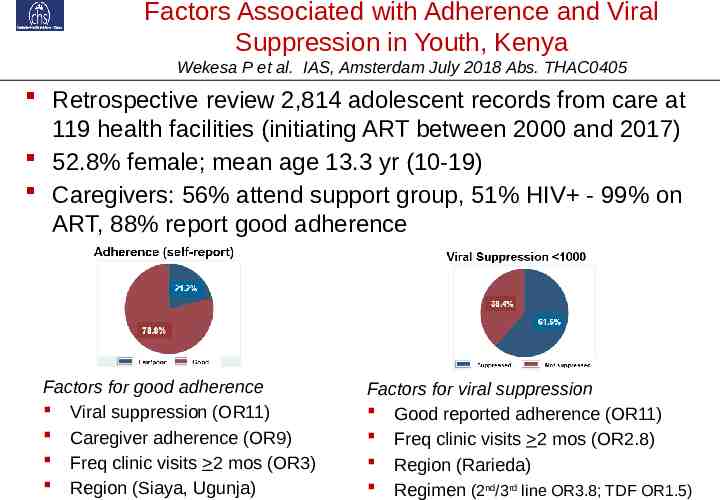
Factors Associated with Adherence and Viral Suppression in Youth, Kenya Wekesa P et al. IAS, Amsterdam July 2018 Abs. THAC0405 Retrospective review 2,814 adolescent records from care at 119 health facilities (initiating ART between 2000 and 2017) 52.8% female; mean age 13.3 yr (10-19) Caregivers: 56% attend support group, 51% HIV - 99% on ART, 88% report good adherence Factors for good adherence Viral suppression (OR11) Caregiver adherence (OR9) Freq clinic visits 2 mos (OR3) Region (Siaya, Ugunja) Factors for viral suppression Good reported adherence (OR11) Freq clinic visits 2 mos (OR2.8) Region (Rarieda) Regimen (2nd/3rd line OR3.8; TDF OR1.5)
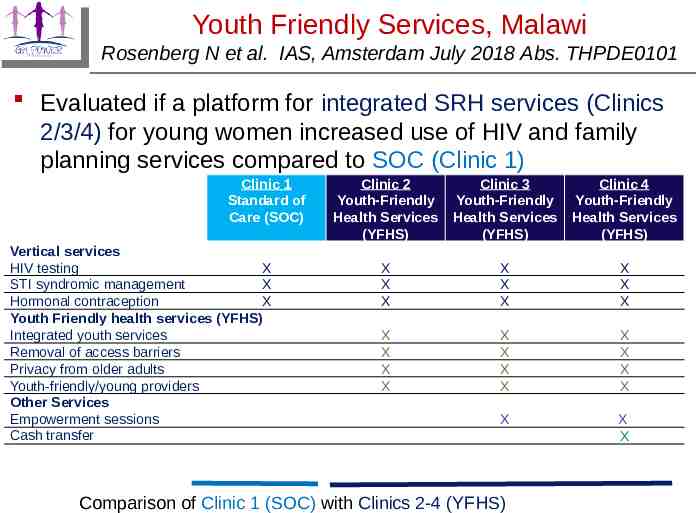
Youth Friendly Services, Malawi Rosenberg N et al. IAS, Amsterdam July 2018 Abs. THPDE0101 Evaluated if a platform for integrated SRH services (Clinics 2/3/4) for young women increased use of HIV and family planning services compared to SOC (Clinic 1) Clinic 1 Standard of Care (SOC) Vertical services HIV testing X STI syndromic management X Hormonal contraception X Youth Friendly health services (YFHS) Integrated youth services Removal of access barriers Privacy from older adults Youth-friendly/young providers Other Services Empowerment sessions Cash transfer Clinic 2 Youth-Friendly Health Services (YFHS) Clinic 3 Youth-Friendly Health Services (YFHS) Clinic 4 Youth-Friendly Health Services (YFHS) X X X X X X X X X X X X X X X X X X X X X X X X Comparison of Clinic 1 (SOC) with Clinics 2-4 (YFHS)
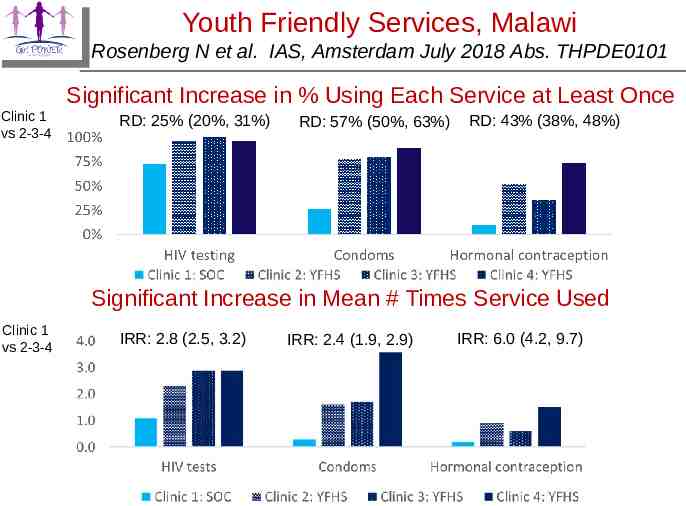
Youth Friendly Services, Malawi Rosenberg N et al. IAS, Amsterdam July 2018 Abs. THPDE0101 Significant Increase in % Using Each Service at Least Once Clinic 1 vs 2-3-4 RD: 25% (20%, 31%) RD: 57% (50%, 63%) RD: 43% (38%, 48%) Significant Increase in Mean # Times Service Used Clinic 1 vs 2-3-4 IRR: 2.8 (2.5, 3.2) IRR: 2.4 (1.9, 2.9) IRR: 6.0 (4.2, 9.7)
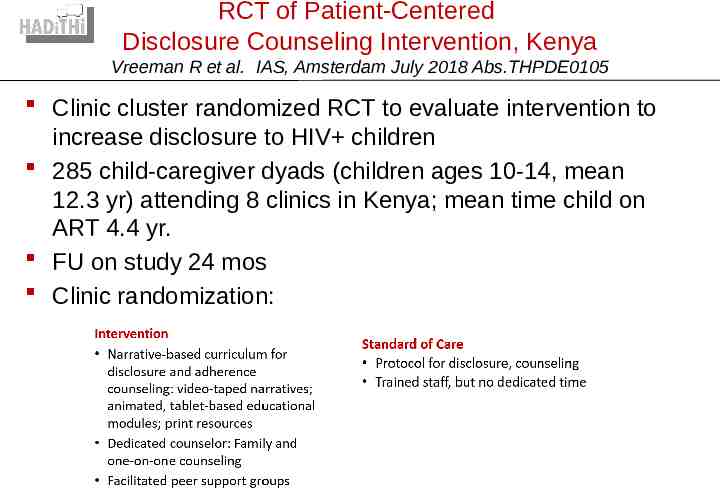
RCT of Patient-Centered Disclosure Counseling Intervention, Kenya Vreeman R et al. IAS, Amsterdam July 2018 Abs.THPDE0105 Clinic cluster randomized RCT to evaluate intervention to increase disclosure to HIV children 285 child-caregiver dyads (children ages 10-14, mean 12.3 yr) attending 8 clinics in Kenya; mean time child on ART 4.4 yr. FU on study 24 mos Clinic randomization:
RCT of Patient-Centered Disclosure Counseling Intervention, Kenya Vreeman R et al. IAS, Amsterdam July 2018 Abs.THPDE0105 At baseline, 32% children reported knew their HIV status (no difference between control and intervention groups). Using child-reported disclosure, prevalence of disclosure increased significantly between baseline and 24 months: – 29.2% to 58.5% control vs 33.2% to 74.0% intervention – Significant difference at 24 months: 15.5% difference, 95% confidence interval: 3.7, 27.3 Both more disclosures and early disclosures for intervention group, with largest increase at 6 months Trends suggested mental and behavioral distress increased at month 6 in intervention group as disclosures increased, and then decreased compared to controls thereafter (PHQ-9, SDQ)
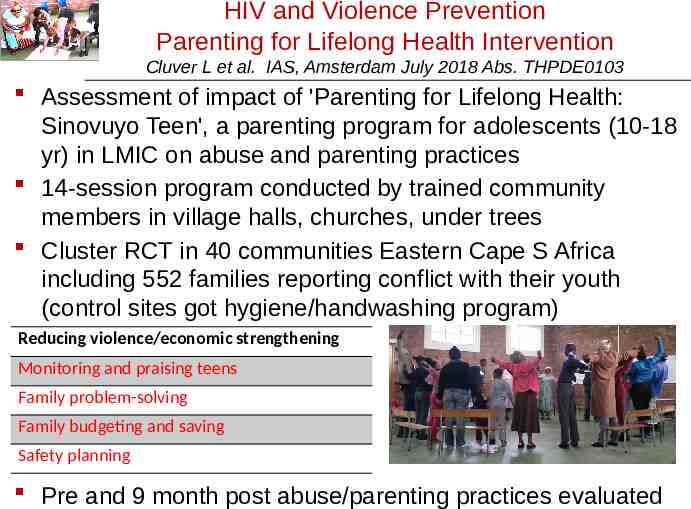
HIV and Violence Prevention Parenting for Lifelong Health Intervention Cluver L et al. IAS, Amsterdam July 2018 Abs. THPDE0103 Assessment of impact of 'Parenting for Lifelong Health: Sinovuyo Teen', a parenting program for adolescents (10-18 yr) in LMIC on abuse and parenting practices 14-session program conducted by trained community members in village halls, churches, under trees Cluster RCT in 40 communities Eastern Cape S Africa including 552 families reporting conflict with their youth (control sites got hygiene/handwashing program) Reducing violence/economic strengthening Monitoring and praising teens Family problem-solving Family budgeting and saving Safety planning Pre and 9 month post abuse/parenting practices evaluated
Parenting for Lifelong Health Intervention Cluver L et al. IAS, Amsterdam July 2018 Abs. THPDE0103 14-session parenting program, ‘Sinovuyo Teen’, run by a local NGO Clowns Without Borders South Africa and funded by UNICEF South Africa. Weekly sessions (10 jointly attended by caregivers and adolescents, 4 attended separately) were conducted in local community halls, churches and outdoors under trees. 19 locally recruited community members, one staff member from a regional NGO (Regional Psychosocial Support Initiative) and 5 local social auxiliary workers were trained for 1 week by Clowns Without Borders South Africa, with weekly peer-led supervision throughout the program. Training was activity based, and emphasized program delivery using non-didactic and participatory methods (stories, songs, role play, modeling, home practice).
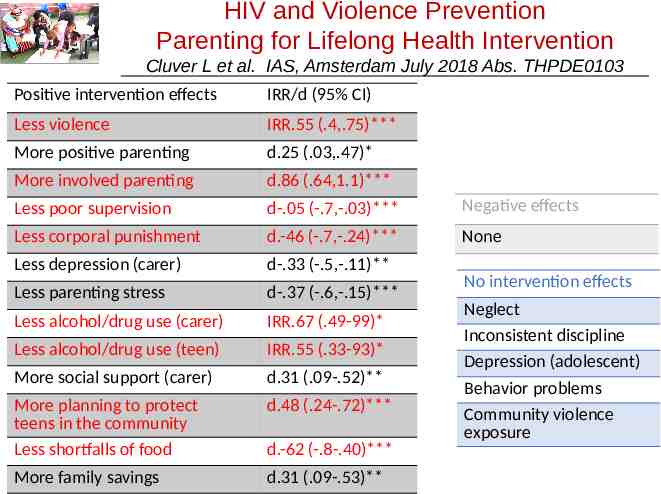
HIV and Violence Prevention Parenting for Lifelong Health Intervention Cluver L et al. IAS, Amsterdam July 2018 Abs. THPDE0103 Positive intervention effects IRR/d (95% CI) Less violence IRR.55 (.4,.75)*** More positive parenting d.25 (.03,.47)* More involved parenting d.86 (.64,1.1)*** Less poor supervision d-.05 (-.7,-.03)*** Negative effects Less corporal punishment d.-46 (-.7,-.24)*** None Less depression (carer) d-.33 (-.5,-.11)** Less parenting stress d-.37 (-.6,-.15)*** Less alcohol/drug use (carer) IRR.67 (.49-99)* Less alcohol/drug use (teen) IRR.55 (.33-93)* More social support (carer) d.31 (.09-.52)** More planning to protect teens in the community Less shortfalls of food d.48 (.24-.72)*** More family savings d.31 (.09-.53)** d.-62 (-.8-.40)*** No intervention effects Neglect Inconsistent discipline Depression (adolescent) Behavior problems Community violence exposure
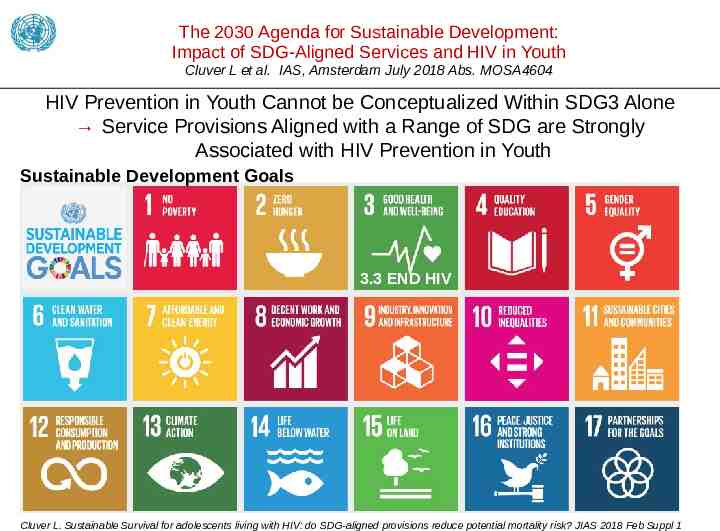
The 2030 Agenda for Sustainable Development: Impact of SDG-Aligned Services and HIV in Youth Cluver L et al. IAS, Amsterdam July 2018 Abs. MOSA4604 HIV Prevention in Youth Cannot be Conceptualized Within SDG3 Alone Service Provisions Aligned with a Range of SDG are Strongly Associated with HIV Prevention in Youth Sustainable Development Goals 3.3 END HIV Cluver L. Sustainable Survival for adolescents living with HIV: do SDG-aligned provisions reduce potential mortality risk? JIAS 2018 Feb Suppl 1
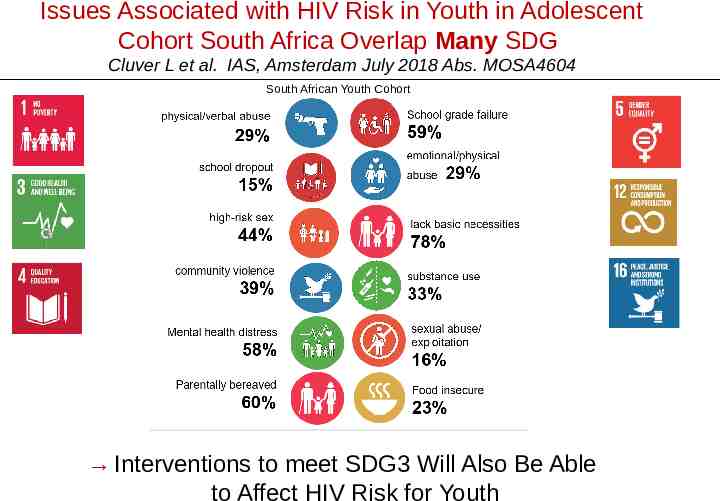
Issues Associated with HIV Risk in Youth in Adolescent Cohort South Africa Overlap Many SDG Cluver L et al. IAS, Amsterdam July 2018 Abs. MOSA4604 South African Youth Cohort Interventions to meet SDG3 Will Also Be Able to Affect HIV Risk for Youth
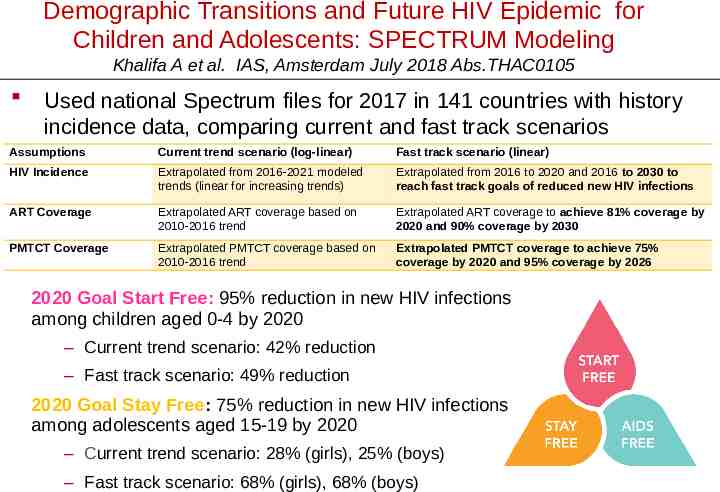
Demographic Transitions and Future HIV Epidemic for Children and Adolescents: SPECTRUM Modeling Khalifa A et al. IAS, Amsterdam July 2018 Abs.THAC0105 Used national Spectrum files for 2017 in 141 countries with history incidence data, comparing current and fast track scenarios Assumptions Current trend scenario (log-linear) Fast track scenario (linear) HIV Incidence Extrapolated from 2016-2021 modeled trends (linear for increasing trends) Extrapolated from 2016 to 2020 and 2016 to 2030 to reach fast track goals of reduced new HIV infections ART Coverage Extrapolated ART coverage based on 2010-2016 trend Extrapolated ART coverage to achieve 81% coverage by 2020 and 90% coverage by 2030 PMTCT Coverage Extrapolated PMTCT coverage based on 2010-2016 trend Extrapolated PMTCT coverage to achieve 75% coverage by 2020 and 95% coverage by 2026 2020 Goal Start Free: 95% reduction in new HIV infections among children aged 0-4 by 2020 – Current trend scenario: 42% reduction – Fast track scenario: 49% reduction 2020 Goal Stay Free: 75% reduction in new HIV infections among adolescents aged 15-19 by 2020 – Current trend scenario: 28% (girls), 25% (boys) – Fast track scenario: 68% (girls), 68% (boys)
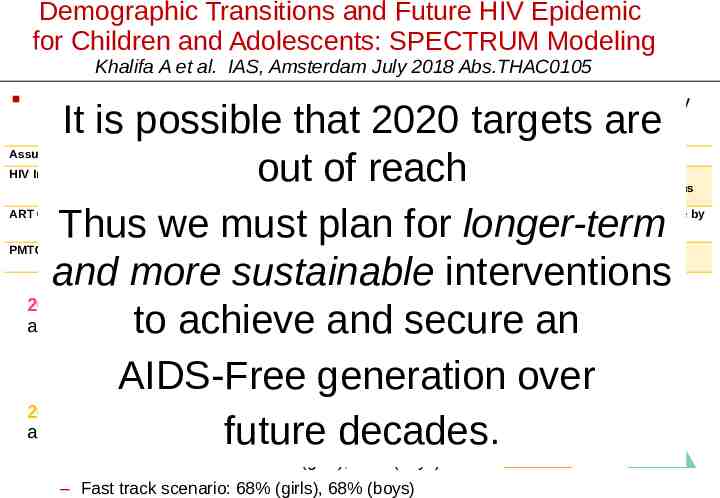
Demographic Transitions and Future HIV Epidemic for Children and Adolescents: SPECTRUM Modeling Khalifa A et al. IAS, Amsterdam July 2018 Abs.THAC0105 Used national Spectrum files for 2017 in 141 countries with history incidence data, comparing current and fast track scenarios It is possible that 2020 targets are out of reach Thus we must plan for longer-term and more sustainable interventions 2020 Goal Start Free: 95% reduction in new HIV infections among children 0-4 by 2020 and secure an toaged achieve – Current trend scenario: 42% reduction track scenario: 49% reduction – Fast AIDS-Free generation over 2020 Goal Stay Free: 75% reduction in new HIV infections among adolescents agedfuture 15-19 by 2020 decades. Assumptions Current trend scenario (log-linear) Fast track scenario (linear) HIV Incidence Extrapolated from 2016-2021 modeled trends (linear for increasing trends) Extrapolated from 2016 to 2020 and 2016 to 2030 to reach fast track goals of reduced new HIV infections ART Coverage Extrapolated ART coverage based on 2010-2016 trend Extrapolated ART coverage to achieve 81% coverage by 2020 and 90% coverage by 2030 PMTCT Coverage Extrapolated PMTCT coverage based on 2010-2016 trend Extrapolated PMTCT coverage to achieve 75% coverage by 2020 and 95% coverage by 2026 – Current trend scenario: 28% (girls), 25% (boys) – Fast track scenario: 68% (girls), 68% (boys)
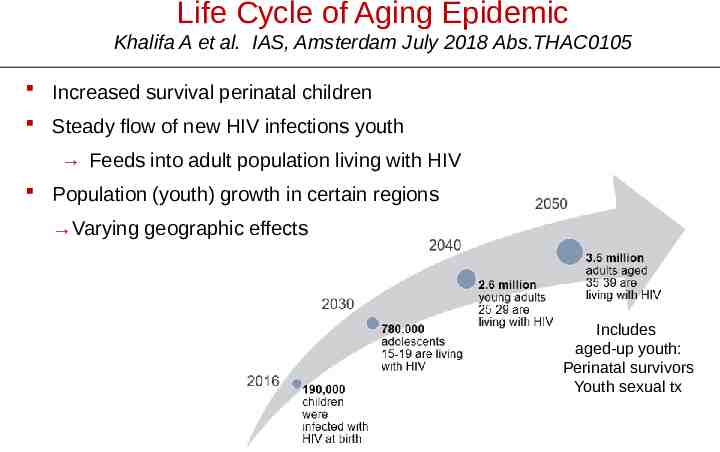
Life Cycle of Aging Epidemic Khalifa A et al. IAS, Amsterdam July 2018 Abs.THAC0105 Increased survival perinatal children Steady flow of new HIV infections youth Feeds into adult population living with HIV Population (youth) growth in certain regions Varying geographic effects Includes aged-up youth: Perinatal survivors Youth sexual tx
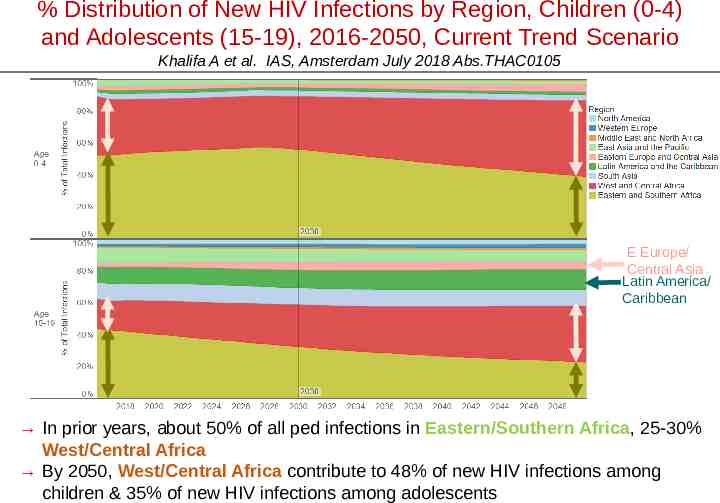
% Distribution of New HIV Infections by Region, Children (0-4) and Adolescents (15-19), 2016-2050, Current Trend Scenario Khalifa A et al. IAS, Amsterdam July 2018 Abs.THAC0105 E Europe/ Central Asia Latin America/ Caribbean In prior years, about 50% of all ped infections in Eastern/Southern Africa, 25-30% West/Central Africa By 2050, West/Central Africa contribute to 48% of new HIV infections among children & 35% of new HIV infections among adolescents