Budgeting & Business Planning: What Managers Should Know


32 Slides1.75 MB
Budgeting & Business Planning: What Managers Should Know Shannon Szymczak, Corporate Budget Manager 1
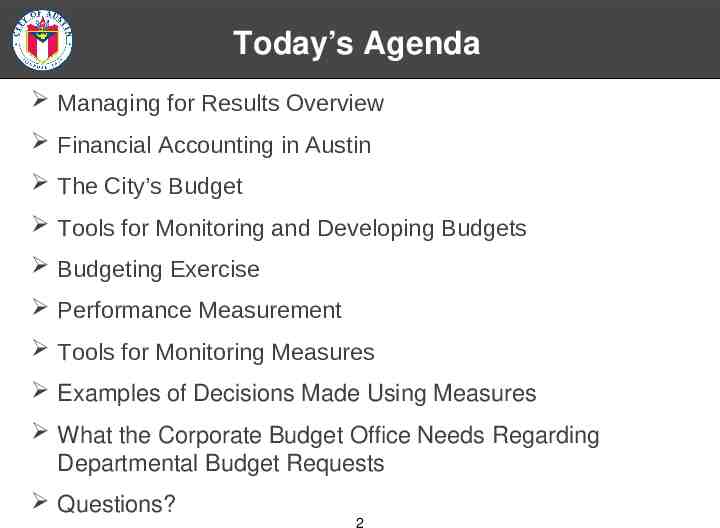
Today’s Agenda Managing for Results Overview Financial Accounting in Austin The City’s Budget Tools for Monitoring and Developing Budgets Budgeting Exercise Performance Measurement Tools for Monitoring Measures Examples of Decisions Made Using Measures What the Corporate Budget Office Needs Regarding Departmental Budget Requests Questions? 2
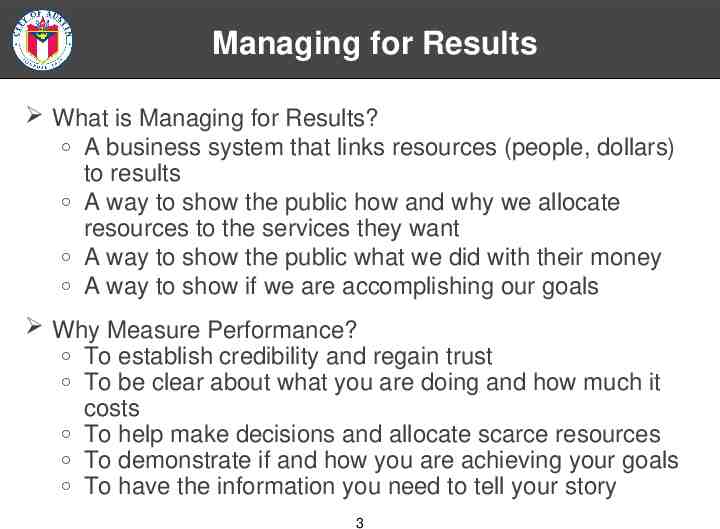
Managing for Results What is Managing for Results? A business system that links resources (people, dollars) to results A way to show the public how and why we allocate resources to the services they want A way to show the public what we did with their money A way to show if we are accomplishing our goals Why Measure Performance? To establish credibility and regain trust To be clear about what you are doing and how much it costs To help make decisions and allocate scarce resources To demonstrate if and how you are achieving your goals To have the information you need to tell your story 3
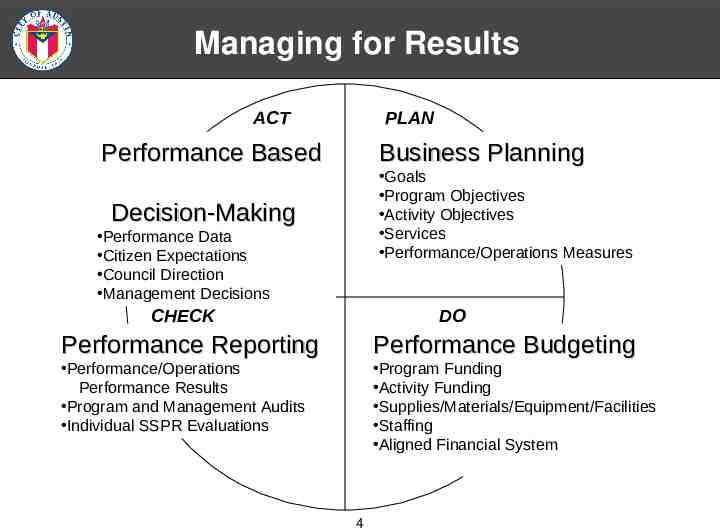
Managing for Results ACT PLAN Performance Based Business Planning Goals Program Objectives Activity Objectives Services Performance/Operations Measures Decision-Making Performance Data Citizen Expectations Council Direction Management Decisions CHECK DO Performance Reporting Performance Budgeting Performance/Operations Performance Results Program and Management Audits Individual SSPR Evaluations Program Funding Activity Funding Supplies/Materials/Equipment/Facilities Staffing Aligned Financial System 4
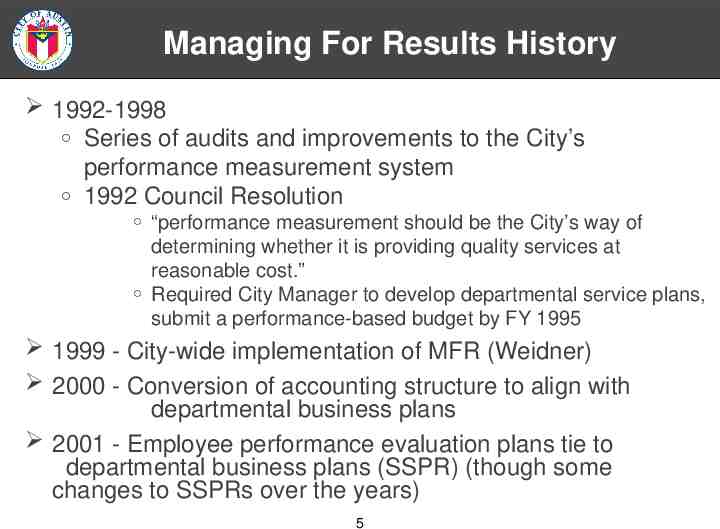
Managing For Results History 1992-1998 Series of audits and improvements to the City’s performance measurement system 1992 Council Resolution “performance measurement should be the City’s way of determining whether it is providing quality services at reasonable cost.” Required City Manager to develop departmental service plans, submit a performance-based budget by FY 1995 1999 - City-wide implementation of MFR (Weidner) 2000 - Conversion of accounting structure to align with departmental business plans 2001 - Employee performance evaluation plans tie to departmental business plans (SSPR) (though some changes to SSPRs over the years) 5
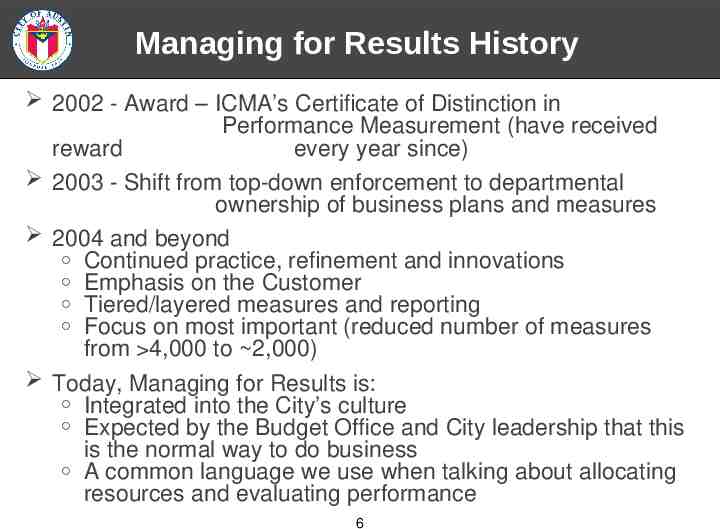
Managing for Results History 2002 - Award – ICMA’s Certificate of Distinction in Performance Measurement (have received reward every year since) 2003 - Shift from top-down enforcement to departmental ownership of business plans and measures 2004 and beyond Continued practice, refinement and innovations Emphasis on the Customer Tiered/layered measures and reporting Focus on most important (reduced number of measures from 4,000 to 2,000) Today, Managing for Results is: Integrated into the City’s culture Expected by the Budget Office and City leadership that this is the normal way to do business A common language we use when talking about allocating resources and evaluating performance 6
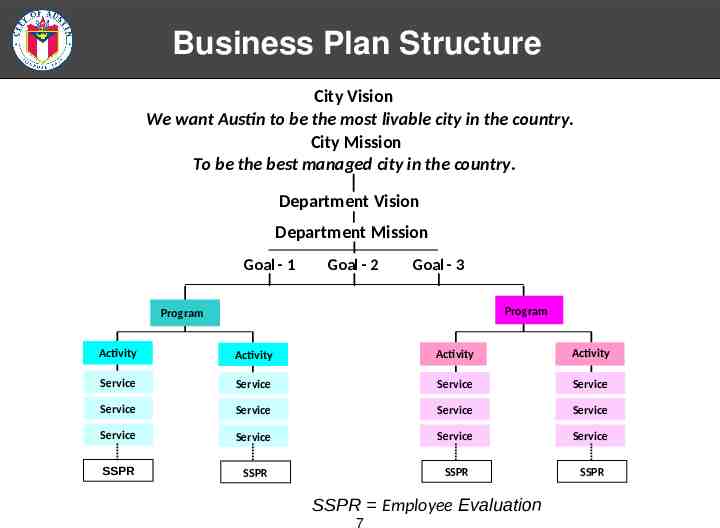
Business Plan Structure City Vision We want Austin to be the most livable city in the country. City Mission To be the best managed city in the country. Department Vision Department Mission Goal - 1 Goal - 2 Goal - 3 Program Program Activity Activity Activity Activity Service Service Service Service Service Service Service Service Service Service Service Service SSPR SSPR SSPR SSPR SSPR Employee Evaluation 7
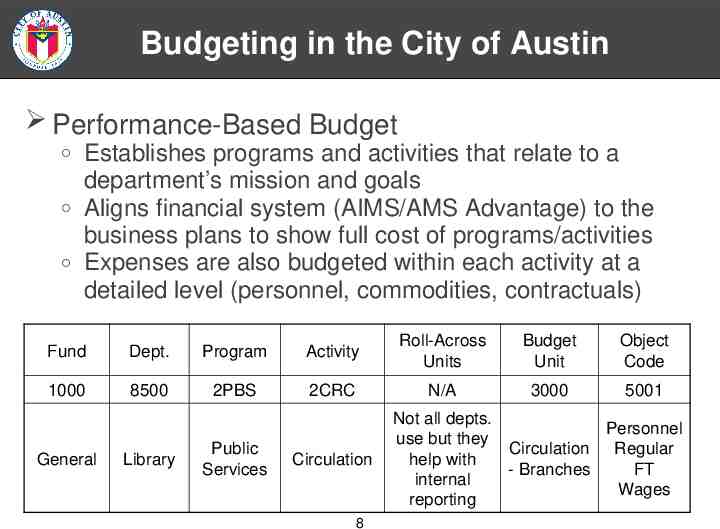
Budgeting in the City of Austin Performance-Based Budget Establishes programs and activities that relate to a department’s mission and goals Aligns financial system (AIMS/AMS Advantage) to the business plans to show full cost of programs/activities Expenses are also budgeted within each activity at a detailed level (personnel, commodities, contractuals) Fund Dept. Program Activity Roll-Across Units Budget Unit Object Code 1000 8500 2PBS 2CRC N/A 3000 5001 General Library Public Services Circulation 8 Not all depts. Personnel use but they Circulation Regular help with - Branches FT internal Wages reporting
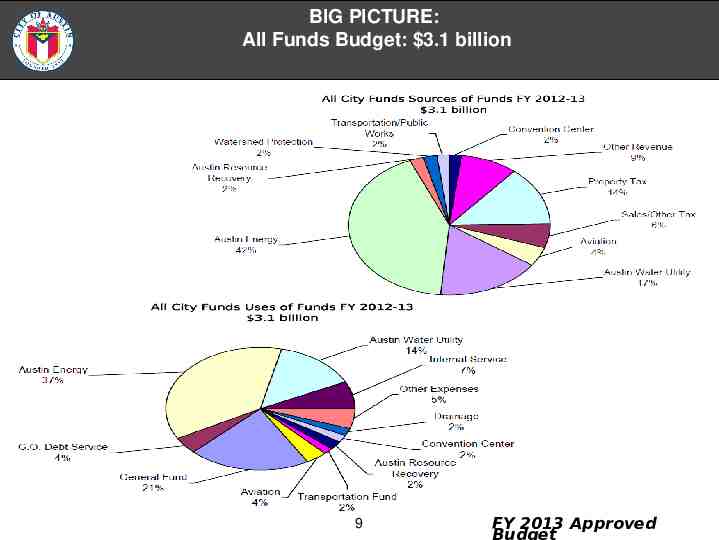
BIG PICTURE: All Funds Budget: 3.1 billion 9 FY 2013 Approved
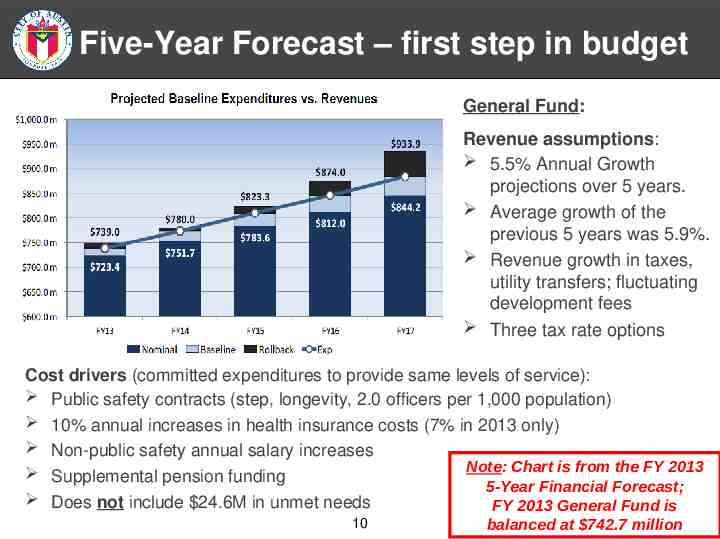
Five-Year Forecast – first step in budget General Fund: Revenue assumptions: 5.5% Annual Growth projections over 5 years. Average growth of the previous 5 years was 5.9%. Revenue growth in taxes, utility transfers; fluctuating development fees Three tax rate options Cost drivers (committed expenditures to provide same levels of service): Public safety contracts (step, longevity, 2.0 officers per 1,000 population) 10% annual increases in health insurance costs (7% in 2013 only) Non-public safety annual salary increases Note: Chart is from the FY 2013 Supplemental pension funding 5-Year Financial Forecast; Does not include 24.6M in unmet needs FY 2013 General Fund is 10 balanced at 742.7 million
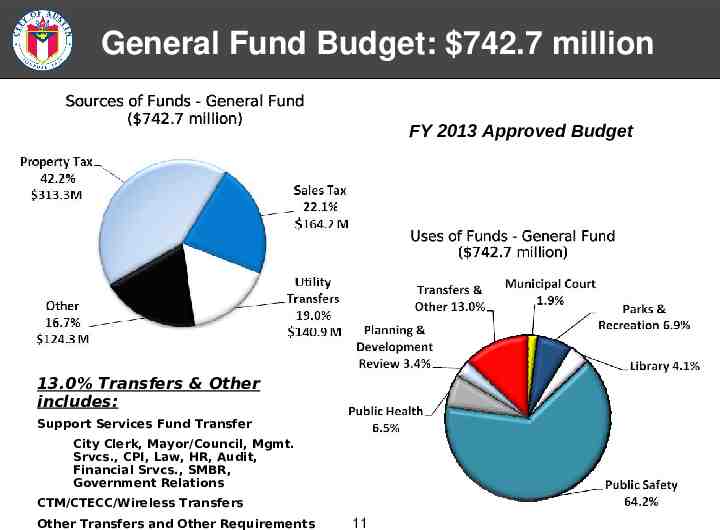
General Fund Budget: 742.7 million FY 2013 Approved Budget 13.0% Transfers & Other includes: Support Services Fund Transfer City Clerk, Mayor/Council, Mgmt. Srvcs., CPI, Law, HR, Audit, Financial Srvcs., SMBR, Government Relations CTM/CTECC/Wireless Transfers Other Transfers and Other Requirements 11
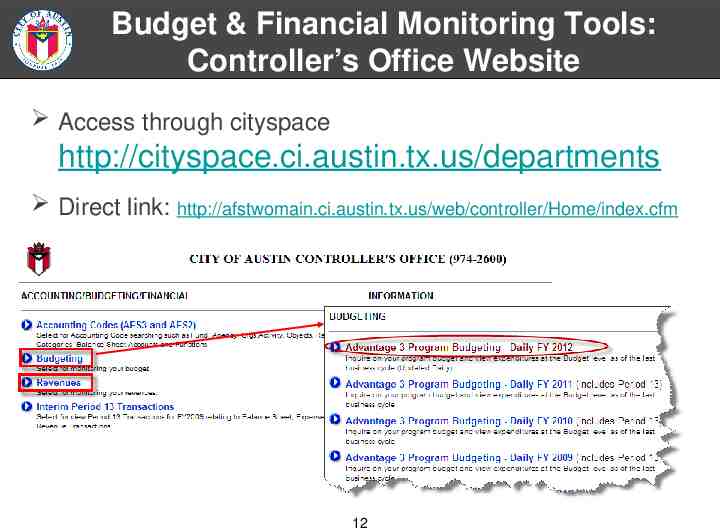
Budget & Financial Monitoring Tools: Controller’s Office Website Access through cityspace http://cityspace.ci.austin.tx.us/departments Direct link: http://afstwomain.ci.austin.tx.us/web/controller/Home/index.cfm 12
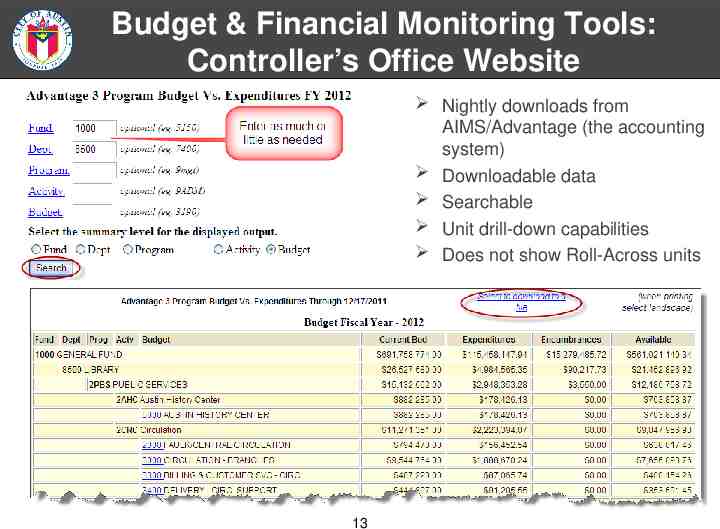
Budget & Financial Monitoring Tools: Controller’s Office Website Nightly downloads from AIMS/Advantage (the accounting system) Downloadable data Searchable Unit drill-down capabilities Does not show Roll-Across units 13
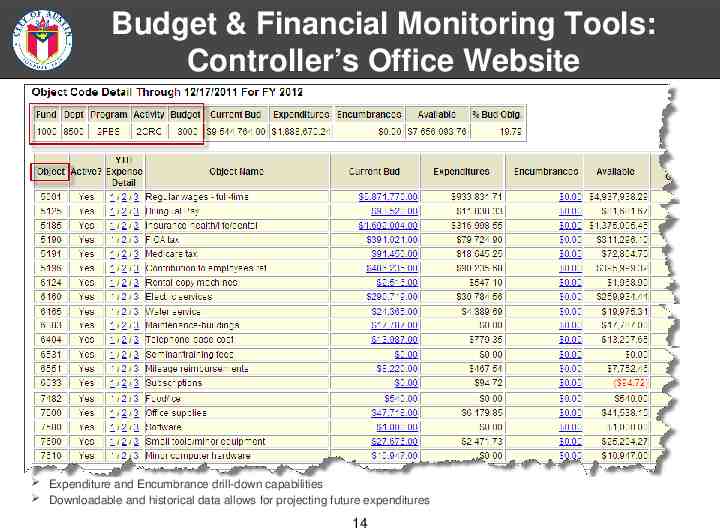
Budget & Financial Monitoring Tools: Controller’s Office Website Expenditure and Encumbrance drill-down capabilities Downloadable and historical data allows for projecting future expenditures 14
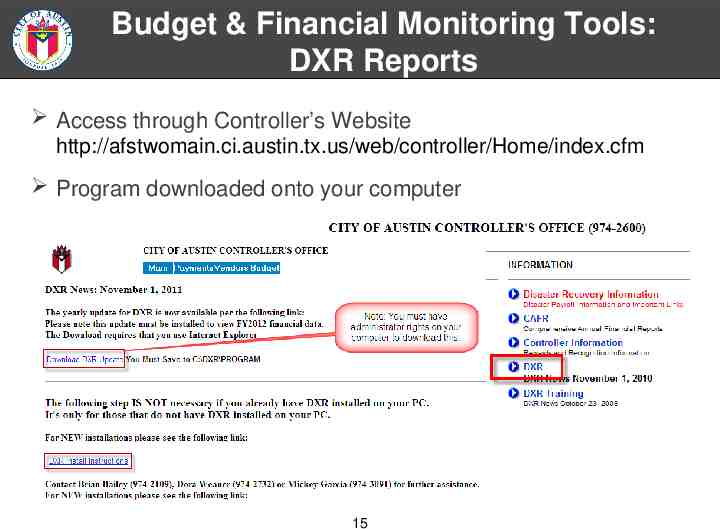
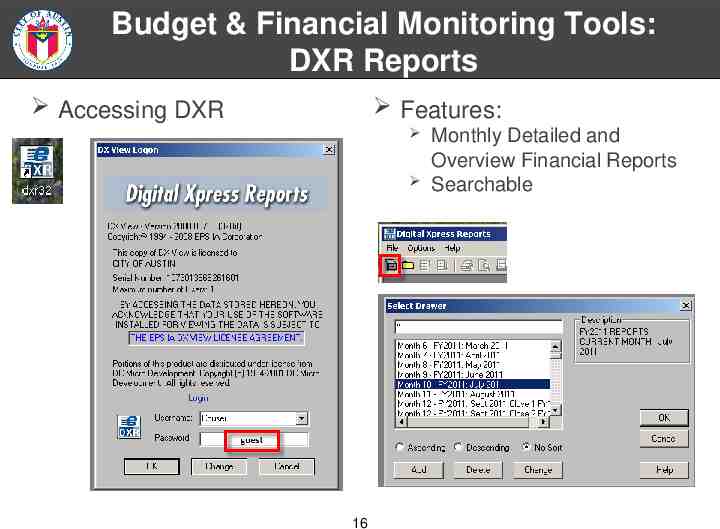
Budget & Financial Monitoring Tools: DXR Reports Access through Controller’s Website http://afstwomain.ci.austin.tx.us/web/controller/Home/index.cfm Program downloaded onto your computer 15
Budget & Financial Monitoring Tools: DXR Reports Accessing DXR Features: 16 Monthly Detailed and Overview Financial Reports Searchable
Budget & Financial Monitoring Tools: Additional Resources Your department’s Financial Manager is a valuable asset He or she can provide you with information you need to monitor your budget Other financial monitoring tools: eCOMBS – login id required Data Warehouse – permissions required 17
Budgeting Exercise 18
Performance Measurement Layers of reporting for measures Dashboard Key Indicators Performance Measures Operational Measures Internal Measures Measure Definitions Description – Why is the measure important? Data Source – Where is the information from? Calculation – What are the measure components? Data Limitations – Vulnerabilities of the measure Reporting Frequency Staff contact 19
Performance Measurement Performance Measure Standards Have a clear relation to the activity Understandable to a general audience Reliable and verifiable Able to track progress over time Should help determine whether goals are being accomplished Measure what matters Types of Measures Demand (citizen requests, need) Output (count) Efficiency (cost) Result (percentage) 20 Family of Measures. Not all required for each activity, but each activity requires a variety of measures that can tell a story.
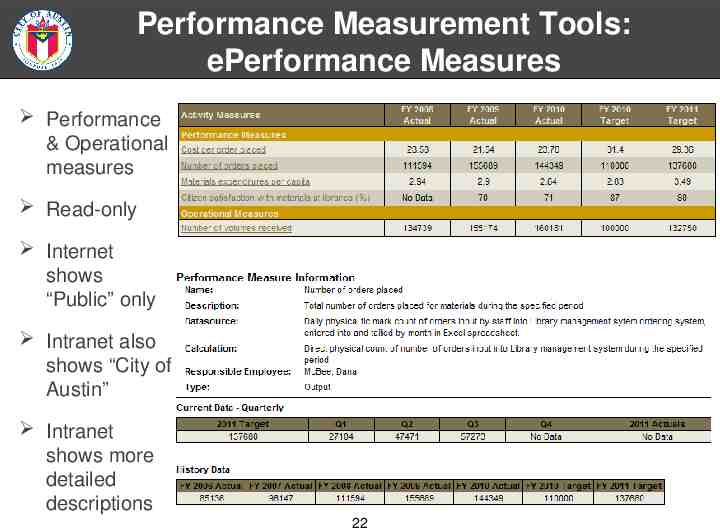
Performance Measurement Tools: ePerformance Measures Internet: http://www.austintexas.gov/budget/eperf Intranet: http://eperf/ Features: Daily/Weekly download Searchable 5 years of prior data Drill-down of Department Mission and Measure info Key indicator button 21
Performance Measurement Tools: ePerformance Measures Performance & Operational measures Read-only Internet shows “Public” only Intranet also shows “City of Austin” Intranet shows more detailed descriptions 22
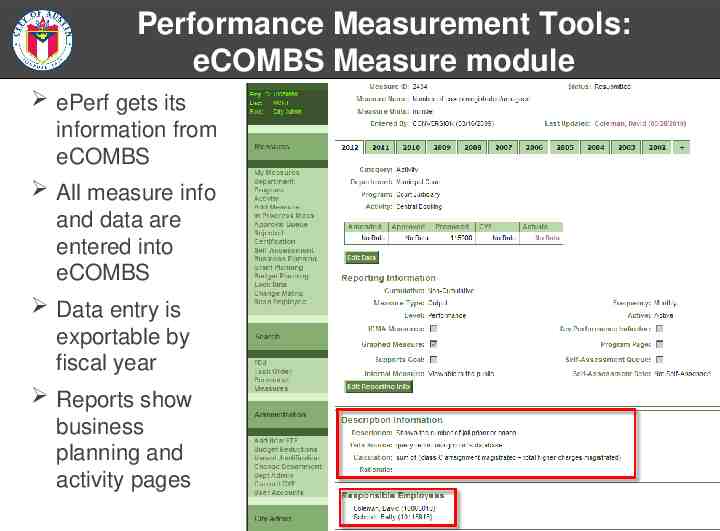
Performance Measurement Tools: eCOMBS Measure module ePerf gets its information from eCOMBS All measure info and data are entered into eCOMBS Data entry is exportable by fiscal year Reports show business planning and activity pages 23
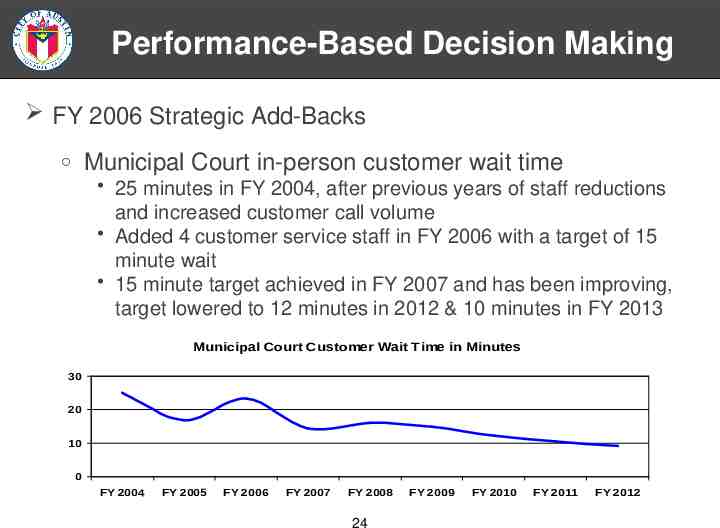
Performance-Based Decision Making FY 2006 Strategic Add-Backs Municipal Court in-person customer wait time 25 minutes in FY 2004, after previous years of staff reductions and increased customer call volume Added 4 customer service staff in FY 2006 with a target of 15 minute wait 15 minute target achieved in FY 2007 and has been improving, target lowered to 12 minutes in 2012 & 10 minutes in FY 2013 Municipal Court Customer Wait Time in Minutes 30 20 10 0 FY 2004 FY 2005 FY 2006 FY 2007 FY 2008 24 FY 2009 FY 2010 FY 2011 FY 2012
Performance-Based Decision Making FY 2010 & 2012 Budget Reductions Mitigating the impact of budget reductions Projected revenue shortfalls in the General Fund Cost drivers exceeding revenue projections Menu of Potential Budget Reductions Outlined more than 250 proposals each year, including service impacts if approved Impacts addressed included affected performance measures In 2010, ultimately approved more than 180 proposals, totaling 26 million and 100 FTEs in reductions 2012 reductions totaled 12 million and 6 FTEs Having the service and measure impacts helped make budget decisions 25
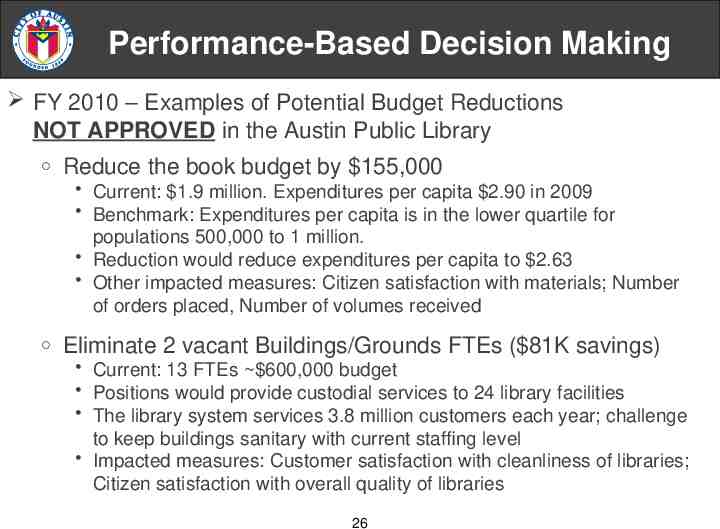
Performance-Based Decision Making FY 2010 – Examples of Potential Budget Reductions NOT APPROVED in the Austin Public Library Reduce the book budget by 155,000 Current: 1.9 million. Expenditures per capita 2.90 in 2009 Benchmark: Expenditures per capita is in the lower quartile for populations 500,000 to 1 million. Reduction would reduce expenditures per capita to 2.63 Other impacted measures: Citizen satisfaction with materials; Number of orders placed, Number of volumes received Eliminate 2 vacant Buildings/Grounds FTEs ( 81K savings) Current: 13 FTEs 600,000 budget Positions would provide custodial services to 24 library facilities The library system services 3.8 million customers each year; challenge to keep buildings sanitary with current staffing level Impacted measures: Customer satisfaction with cleanliness of libraries; Citizen satisfaction with overall quality of libraries 26
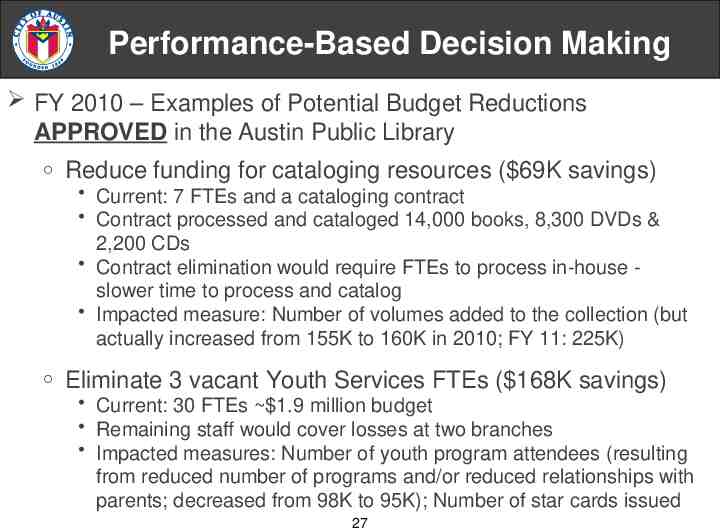
Performance-Based Decision Making FY 2010 – Examples of Potential Budget Reductions APPROVED in the Austin Public Library Reduce funding for cataloging resources ( 69K savings) Current: 7 FTEs and a cataloging contract Contract processed and cataloged 14,000 books, 8,300 DVDs & 2,200 CDs Contract elimination would require FTEs to process in-house slower time to process and catalog Impacted measure: Number of volumes added to the collection (but actually increased from 155K to 160K in 2010; FY 11: 225K) Eliminate 3 vacant Youth Services FTEs ( 168K savings) Current: 30 FTEs 1.9 million budget Remaining staff would cover losses at two branches Impacted measures: Number of youth program attendees (resulting from reduced number of programs and/or reduced relationships with parents; decreased from 98K to 95K); Number of star cards issued 27
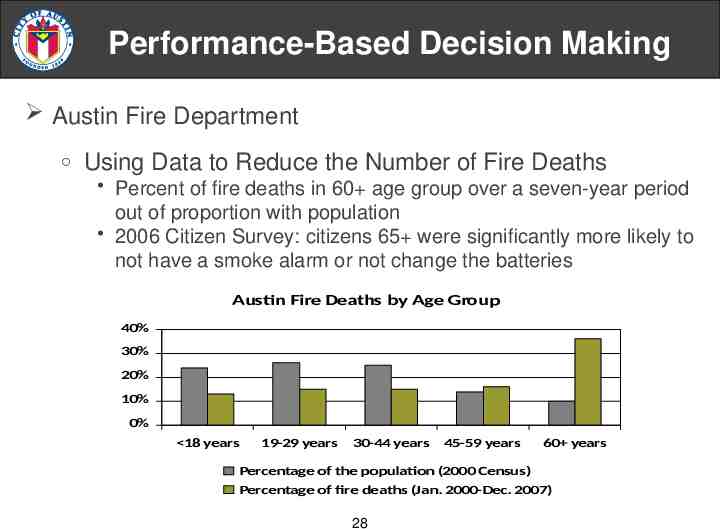
Performance-Based Decision Making Austin Fire Department Using Data to Reduce the Number of Fire Deaths Percent of fire deaths in 60 age group over a seven-year period out of proportion with population 2006 Citizen Survey: citizens 65 were significantly more likely to not have a smoke alarm or not change the batteries Austin Fire Deaths by Age Group 40% 30% 20% 10% 0% 18 years 19-29 years 30-44 years 45-59 years 60 years Percentage of the population (2000 Census) Percentage of fire deaths (Jan. 2000-Dec. 2007) 28
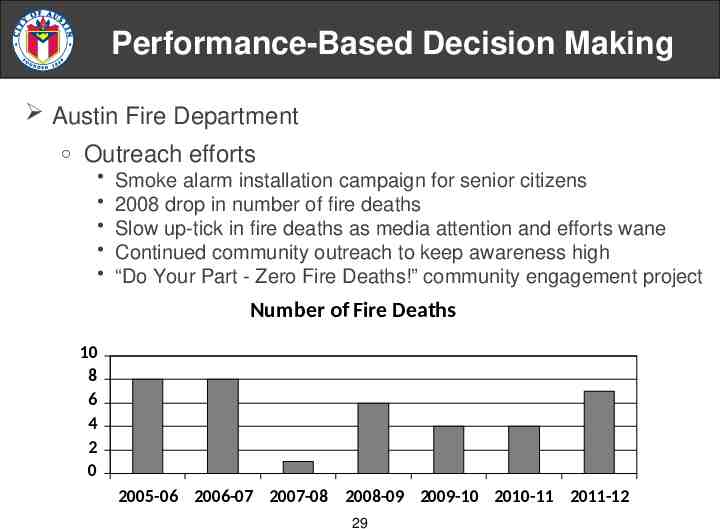
Performance-Based Decision Making Austin Fire Department Outreach efforts Smoke alarm installation campaign for senior citizens 2008 drop in number of fire deaths Slow up-tick in fire deaths as media attention and efforts wane Continued community outreach to keep awareness high “Do Your Part - Zero Fire Deaths!” community engagement project Number of Fire Deaths 10 8 6 4 2 0 2005-06 2006-07 2007-08 2008-09 2009-10 2010-11 2011-12 29
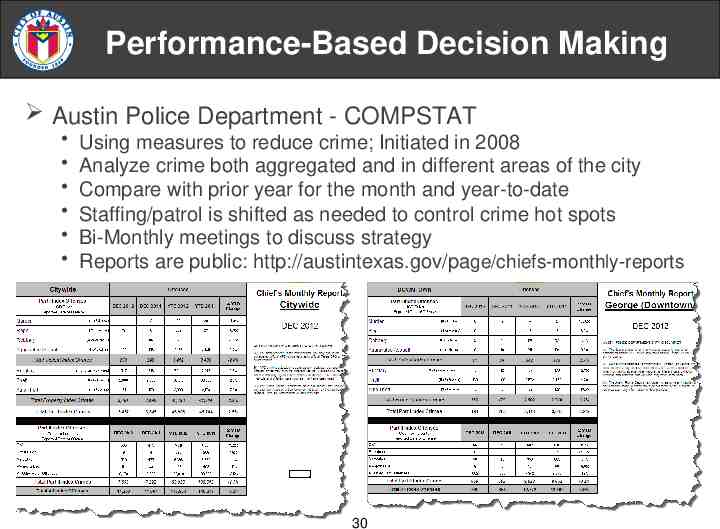
Performance-Based Decision Making Austin Police Department - COMPSTAT Using measures to reduce crime; Initiated in 2008 Analyze crime both aggregated and in different areas of the city Compare with prior year for the month and year-to-date Staffing/patrol is shifted as needed to control crime hot spots Bi-Monthly meetings to discuss strategy Reports are public: http://austintexas.gov/page/chiefs-monthly-reports 30
What the Budget Office Needs Regarding Budget Requests Budget Requests Need Both Performance and Financial Data. For example: Why is there a need? What are you doing now to accommodate the need? Are you meeting your performance targets? What has past performance been? What will the performance impact be of getting / not getting the budget request? How will citizens or customers be affected? Is there a legal mandate driving the request? What is it? Was this service included on the Citizen Survey? If so, what was citizen satisfaction? 31
Questions / Comments www.austintexas.gov/finance [email protected] 32