Pricing of MAXL treaties Conference R in Insurance – 29/06/2015


24 Slides509.44 KB
Pricing of MAXL treaties Conference R in Insurance – 29/06/2015 Indra LOLJEEH – Technical Advisor Analytics at QBE Re – [email protected]
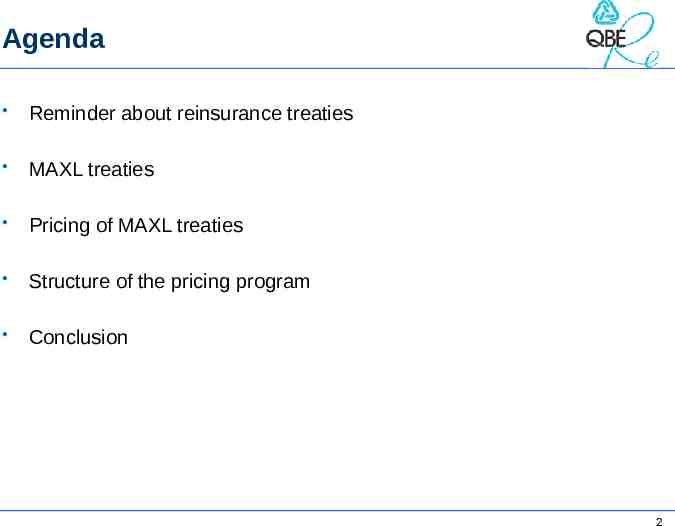
Agenda Reminder about reinsurance treaties MAXL treaties Pricing of MAXL treaties Structure of the pricing program Conclusion 2
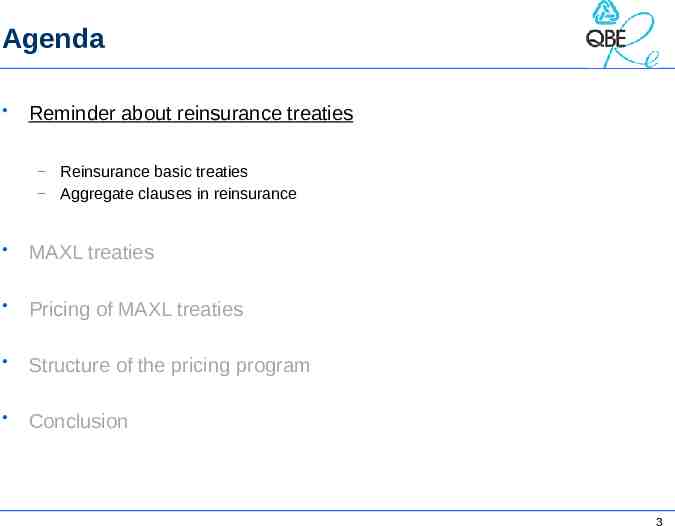
Agenda Reminder about reinsurance treaties Reinsurance basic treaties – Aggregate clauses in reinsurance – MAXL treaties Pricing of MAXL treaties Structure of the pricing program Conclusion 3
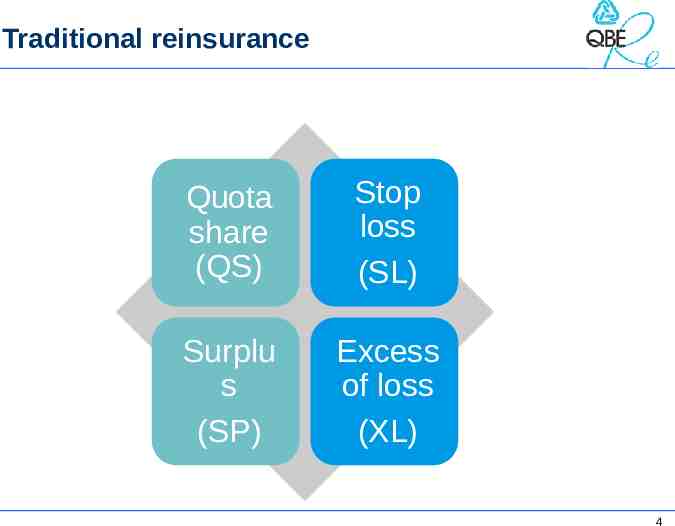
Traditional reinsurance Quota share (QS) Stop loss (SL) Surplu s (SP) Excess of loss (XL) 4
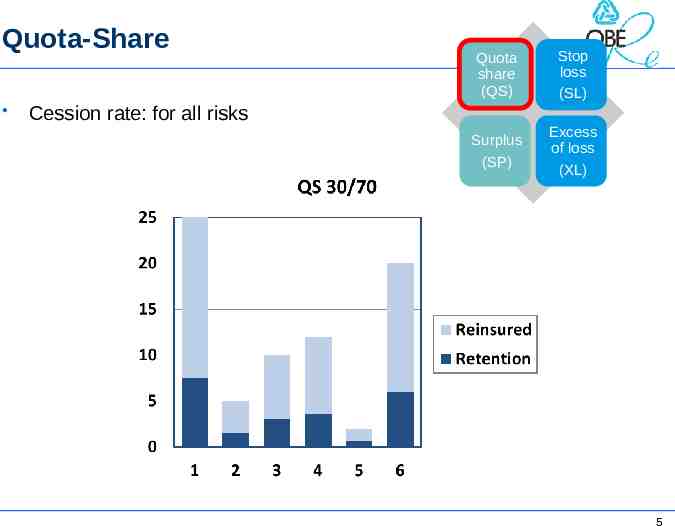
Quota-Share Quota share (QS) Stop loss (SL) Surplus (SP) Excess of loss (XL) Cession rate: for all risks 5
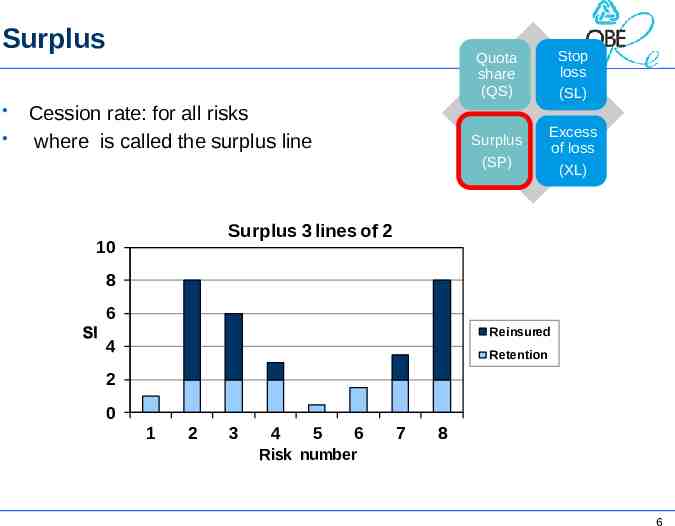
Surplus Cession rate: for all risks where is called the surplus line Quota share (QS) Stop loss (SL) Surplus (SP) Excess of loss (XL) Surplus 3 lines of 2 10 8 6 Reinsured 4 Retention 2 0 1 2 3 4 5 6 7 8 Risk number 6
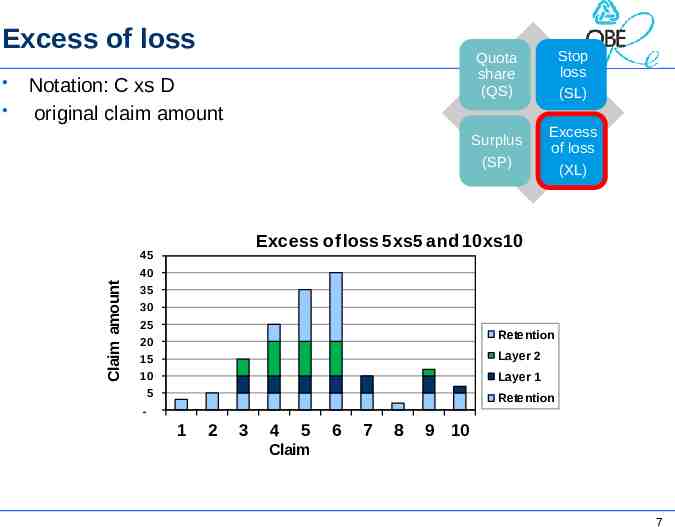
Excess of loss Notation: C xs D original claim amount Stop loss (SL) Surplus (SP) Excess of loss (XL) Excess of loss 5xs5 and 10xs10 45 40 Claim amount Quota share (QS) 35 30 25 Retention 20 15 Layer 2 10 Layer 1 5 Retention - 1 2 3 4 5 6 7 8 9 10 Claim 7
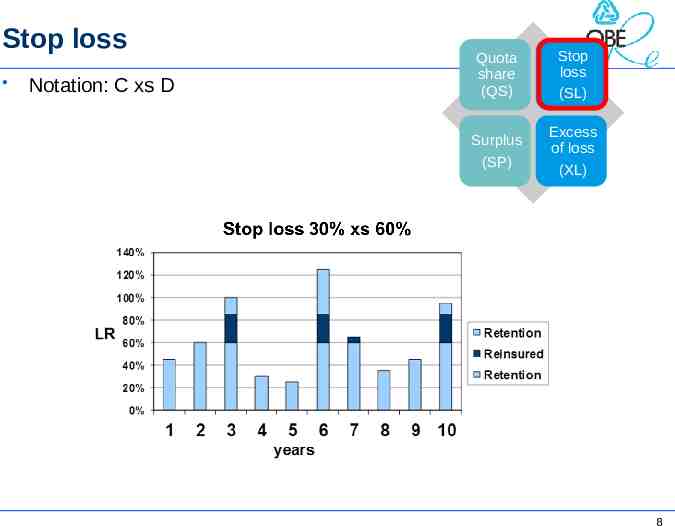
Stop loss Notation: C xs D Quota share (QS) Stop loss (SL) Surplus (SP) Excess of loss (XL) 8
Aggregate clauses in reinsurance AAD: Aggregate Annual Deductible AAL: Aggregate Annual Limit Link with Stop-Loss treaties These elements are the basis of most currently existing reinsurance structures 9
Agenda Reminder about reinsurance treaties MAXL treaties Concept of MAXL treaties – Illustration/Example – Pricing of MAXL treaties Structure of the pricing program Conclusion 10
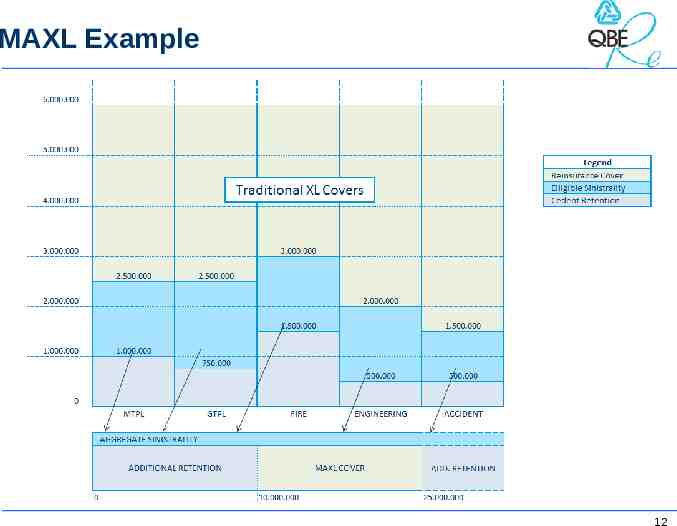
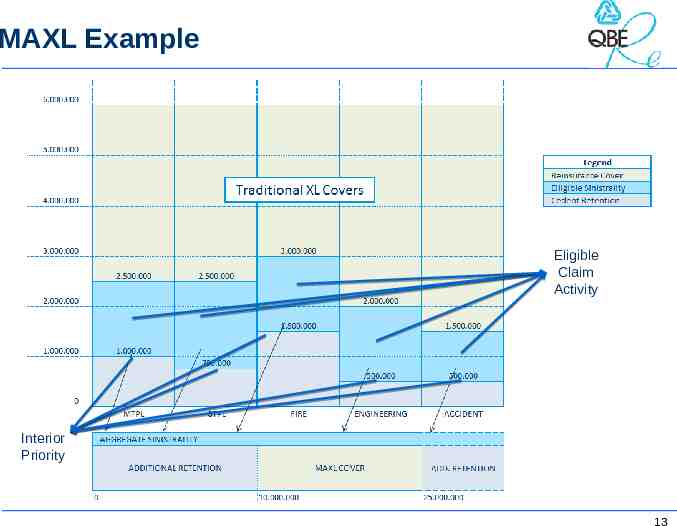
Concept of MAXL treaties Multiline: Reinsurance treaty covering several lines of business at the same time – Common protection for several portfolios – Aggregate Structure that contains aggregate clauses (MAAD/MAAL) – These clauses are applied on a global level – eXcess of Loss Non-proportional structure – Protection against medium/high claims – 11
MAXL Example 12
MAXL Example Eligible Claim Activity Interior Priority 13
Advantages of such structures Improved protection against medium sized claims Towards frequency – Towards changes in legislation – Protection of insurer’s global results Can cover several lines of business at the same time Cheaper than lower XL cover Optimization of the reinsurance structure (Solvency II) 14
Agenda Reminder about reinsurance treaties MAXL treaties Pricing of MAXL treaties Collective risk model / Monte-Carlo methods – Problems inherent to MAXL treaties Correlations Lines of business (ST/LT) Time – What R brought to us – Structure of the pricing program Conclusion 15
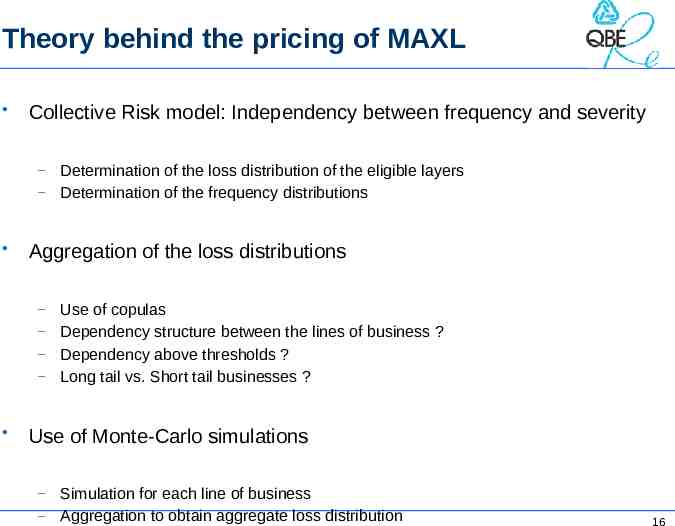
Theory behind the pricing of MAXL Collective Risk model: Independency between frequency and severity Determination of the loss distribution of the eligible layers – Determination of the frequency distributions – Aggregation of the loss distributions Use of copulas – Dependency structure between the lines of business ? – Dependency above thresholds ? – Long tail vs. Short tail businesses ? – Use of Monte-Carlo simulations Simulation for each line of business – Aggregation to obtain aggregate loss distribution – 16
Problems inherent to such methods Time-consuming process Need for an efficient software Many underlying structures possible Need for program flexibility Still some developments needed for the copula part Need for a modular program Difficult to take account of some distributions (CAT Softwares) 17
Problems inherent to such methods Time-consuming process Need for an efficient software Many underlying structures possible Need for program flexibility Still some developments needed for the copula part Need for a modular program Difficult to take account of some distributions (CAT Softwares) R is our savior !!! 18
Agenda Reminder about reinsurance treaties MAXL treaties Pricing of MAXL treaties Structure of the pricing program Conclusion 19
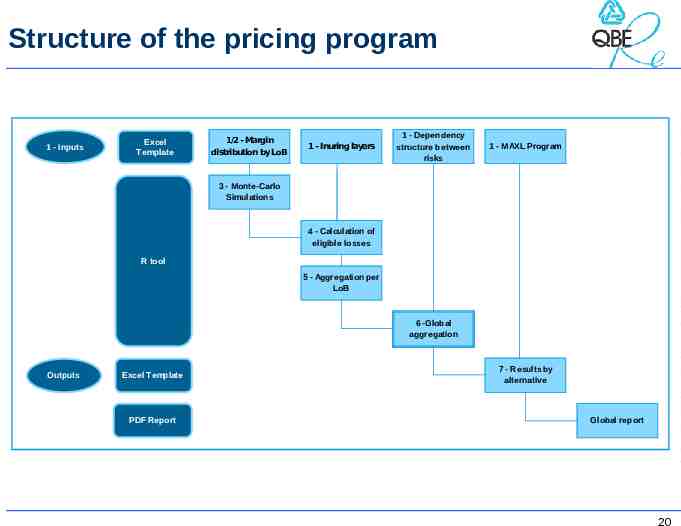
Structure of the pricing program 1 - Inputs Excel Template 1/2 - Margin distribution by LoB 1 - Inuring layers 1 - Dependency structure between risks 1 - MAXL Program 3 - Monte-Carlo Simulations 4 - Calculation of eligible losses R tool 5 - Aggregation per LoB 6 -Global aggregation Outputs Excel Template PDF Report 7 - Results by alternative Global report 20
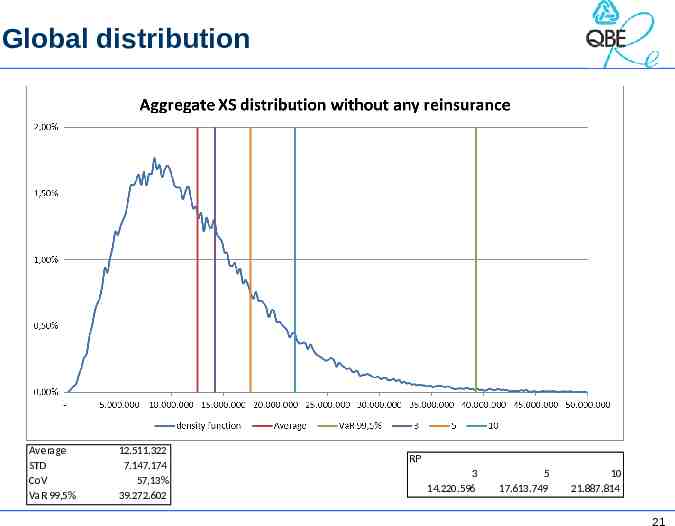
Global distribution Average STD CoV VaR 99,5% 12.511.322 7.147.174 57,13% 39.272.602 RP 3 14.220.596 5 17.613.749 10 21.887.814 21
Agenda Reminder about reinsurance treaties MAXL treaties Pricing of MAXL treaties Structure of the pricing program Conclusion 22
Advantages of R in our case Ideal for simulation based tools Simplification of the audit process Program easy to modify and improve Packages already existing Possibility for further analysis on data Graphs – Sensitivity analysis – Reporting – 23
Questions? 24