The Strategy Map Presentation Templates
22 Slides738.51 KB
The Strategy Map Presentation Templates
The Strategy Map A Strategy Map is a diagram that describes how a company or organisation can create value by linking strategic objectives in a cause and effect relationship. It is based on the four Balanced Scorecard Perspectives: Financial, Customer, Internal Processes and Organisational Capacity. The key element of the Strategy Map is that it is linked to the ‘scorecards’ that monitor the progress towards the Strategic Objectives. The ‘scorecards’ will include: metrics, targets for the metrics and strategic initiatives to drive performance towards achieving the objectives.
The Balanced Scorecard The Balanced Scorecard is a strategic planning and management method used to: align business activities to a vision and strategy of an organisation improve internal and external communications monitor organisational performance against strategic goals. The design of Balanced Scorecard concerns itself with: the identification of a small number of financial and non-financial measures referred to as Perspectives setting targets for the measures and then measuring them on a regular basis to determine success or failure.
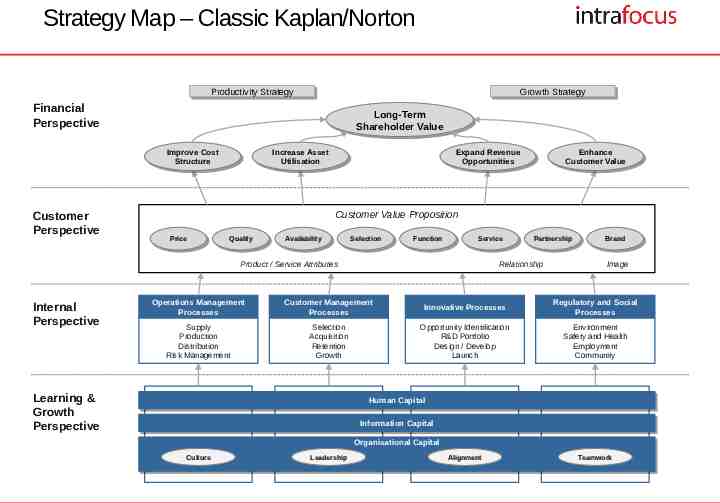
Strategy Map – Classic Kaplan/Norton Productivity Productivity Strategy Strategy Growth Growth Strategy Strategy Financial Perspective Long-Term Long-Term Shareholder Shareholder Value Value Improve ImproveCost Cost Structure Structure Customer Perspective Increase IncreaseAsset Asset Utilisation Utilisation Expand ExpandRevenue Revenue Opportunities Opportunities Customer Value Proposition Price Price Quality Quality Availability Availability Selection Selection Function Function Service Service Product / Service Attributes Internal Perspective Enhance Enhance Customer CustomerValue Value Partnership Partnership Relationship Brand Brand Image Operations Management Processes Customer Management Processes Innovative Processes Regulatory and Social Processes Supply Production Distribution Risk Management Selection Acquisition Retention Growth Opportunity Identification R&D Portfolio Design / Develop Launch Environment Safety and Health Employment Community Learning & Growth Perspective Human HumanCapital Capital Information InformationCapital Capital Organisational OrganisationalCapital Capital Culture Leadership Alignment Teamwork
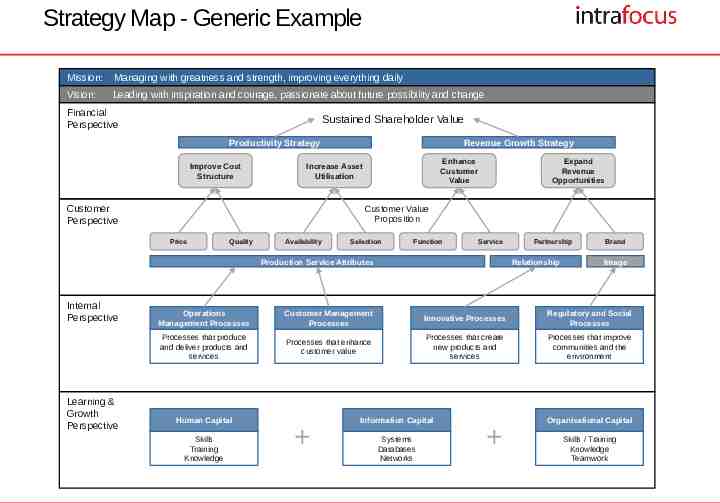
Strategy Map - Generic Example Mission: Managing with greatness and strength, improving everything daily Vision: Leading with inspiration and courage, passionate about future possibility and change Financial Perspective Sustained Shareholder Value Productivity Strategy Improve Cost Structure Revenue Growth Strategy Enhance Customer Value Increase Asset Utilisation Expand Revenue Opportunities Customer Value Proposition Customer Perspective Price Quality Availability Selection Function Service Production Service Attributes Internal Perspective Learning & Growth Perspective Partnership Relationship Brand Image Operations Management Processes Customer Management Processes Innovative Processes Regulatory and Social Processes Processes that produce and deliver products and services Processes that enhance customer value Processes that create new products and services Processes that improve communities and the environment Human Capital Skills Training Knowledge Information Capital Systems Databases Networks Organisational Capital Skills / Training Knowledge Teamwork
Capacity Processes Customer Financial Basic Strategy Map Background
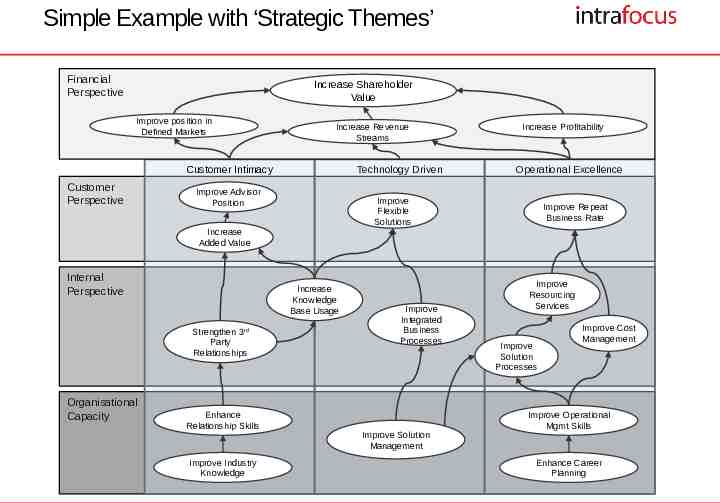
Simple Example with ‘Strategic Themes’ Financial Perspective Increase Shareholder Value Improve position in Defined Markets Increase Revenue Streams Customer Intimacy Customer Perspective Technology Driven Improve Advisor Position Increase Profitability Operational Excellence Improve Flexible Solutions Improve Repeat Business Rate Increase Added Value Internal Perspective Increase Knowledge Base Usage Strengthen 3rd Party Relationships Organisational Capacity Enhance Relationship Skills Improve Industry Knowledge Improve Integrated Business Processes Improve Solution Management Improve Resourcing Services Improve Solution Processes Improve Cost Management Improve Operational Mgmt Skills Enhance Career Planning
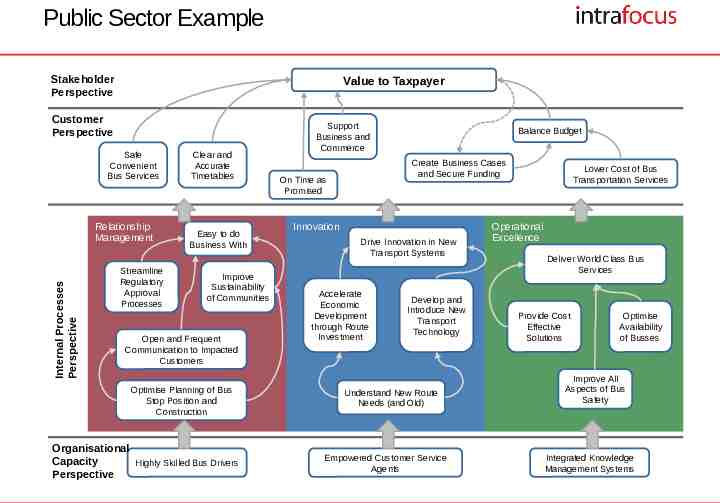
Public Sector Example Stakeholder Perspective Value to Taxpayer Customer Perspective Safe Convenient Bus Services Internal Processes Perspective Relationship Management Streamline Regulatory Approval Processes Clear and Accurate Timetables Easy to do Business With Improve Sustainability of Communities Open and Frequent Communication to Impacted Customers Optimise Planning of Bus Stop Position and Construction Organisational Capacity Highly Skilled Bus Drivers Perspective Support Business and Commerce Balance Budget Create Business Cases and Secure Funding On Time as Promised Innovation Drive Innovation in New Transport Systems Accelerate Economic Development through Route Investment Develop and Introduce New Transport Technology Understand New Route Needs (and Old) Empowered Customer Service Agents Lower Cost of Bus Transportation Services Operational Excellence Deliver World Class Bus Services Provide Cost Effective Solutions Optimise Availability of Busses Improve All Aspects of Bus Safety Integrated Knowledge Management Systems
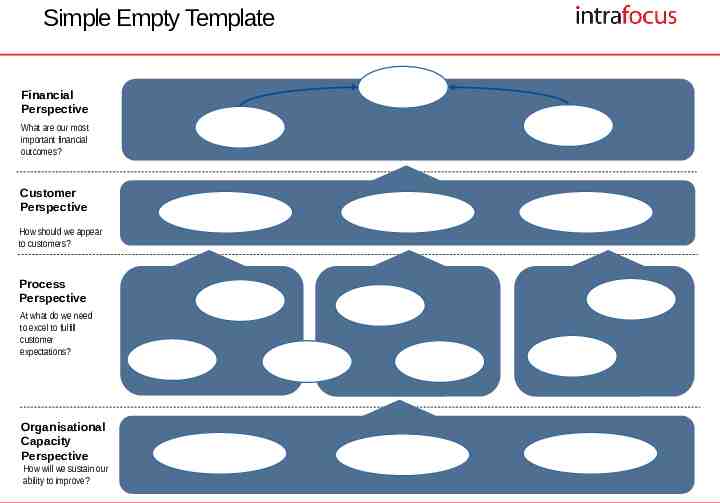
Simple Empty Template Financial Perspective What are our most important financial outcomes? Customer Perspective How should we appear to customers? Process Perspective At what do we need to excel to fulfill customer expectations? Organisational Capacity Perspective How will we sustain our ability to improve?
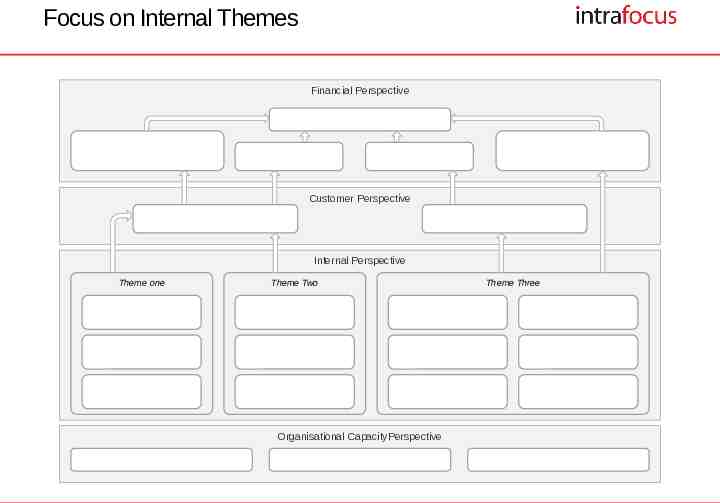
Focus on Internal Themes Financial Perspective Customer Perspective Internal Perspective Theme one Theme Two Organisational CapacityPerspective Theme Three
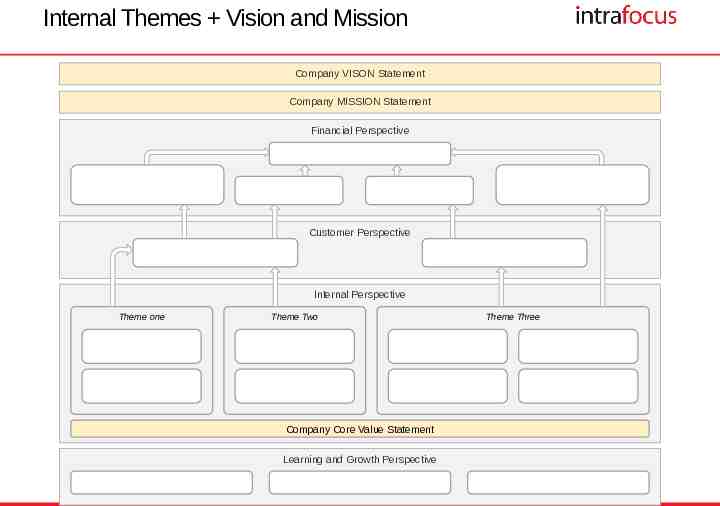
Internal Themes Vision and Mission Company VISON Statement Company MISSION Statement Financial Perspective Customer Perspective Internal Perspective Theme one Theme Two Company Core Value Statement Learning and Growth Perspective Theme Three
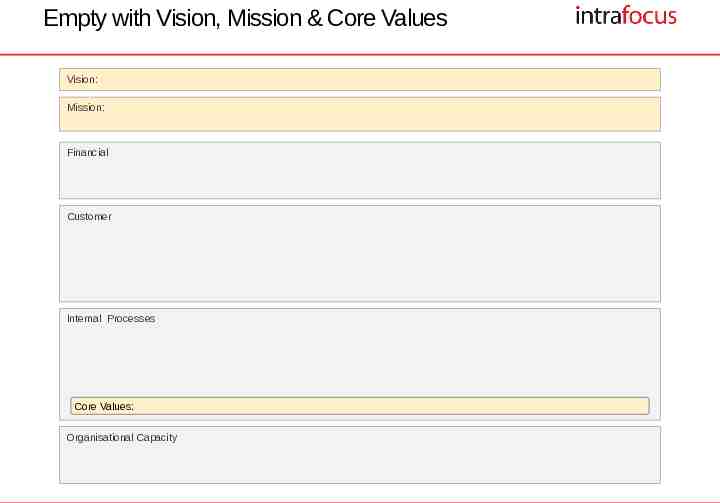
Empty with Vision, Mission & Core Values Vision: Mission: Financial Customer Internal Processes Core Values: Organisational Capacity
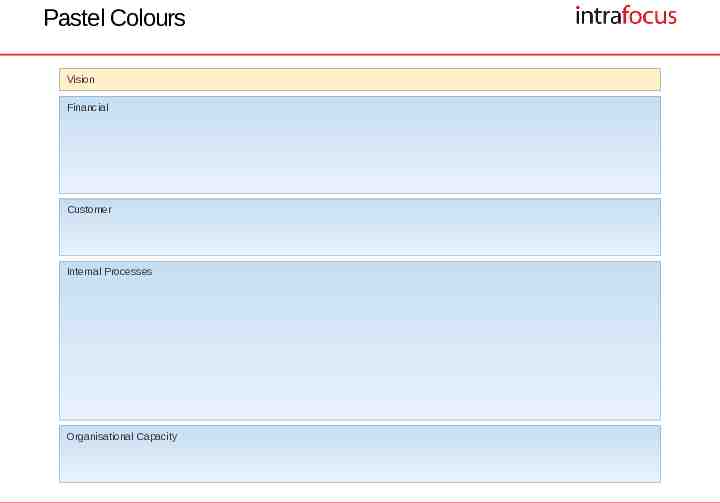
Pastel Colours Vision Financial Customer Internal Processes Organisational Capacity
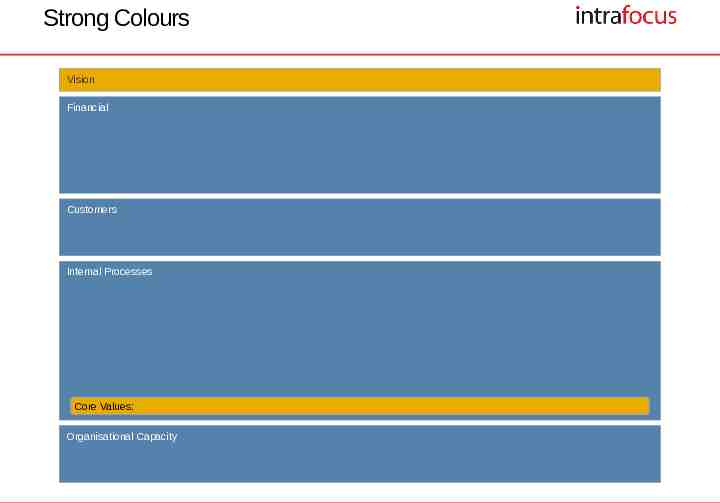
Strong Colours Vision Financial Customers Internal Processes Core Values: Organisational Capacity
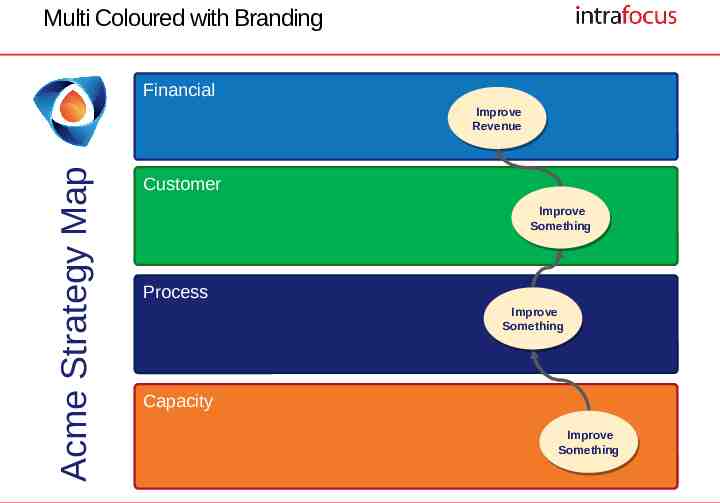
Multi Coloured with Branding Financial Acme Strategy Map Improve Improve Revenue Revenue Customer Improve Improve Something Something Process Improve Improve Something Something Capacity Improve Improve Something Something
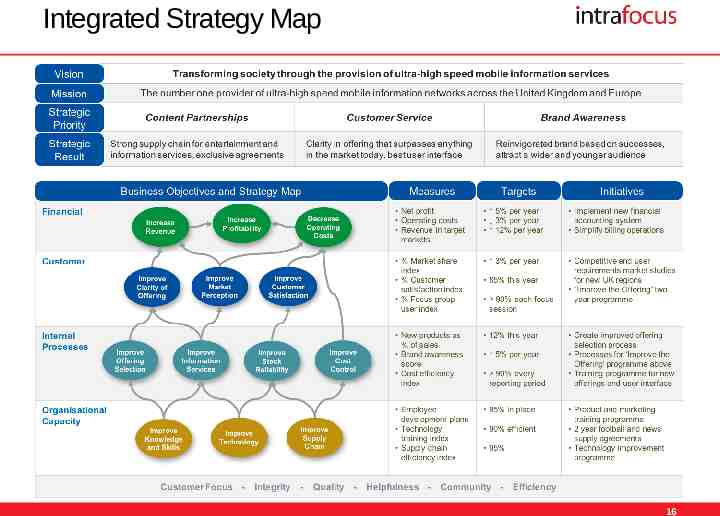
Integrated Strategy Map 16
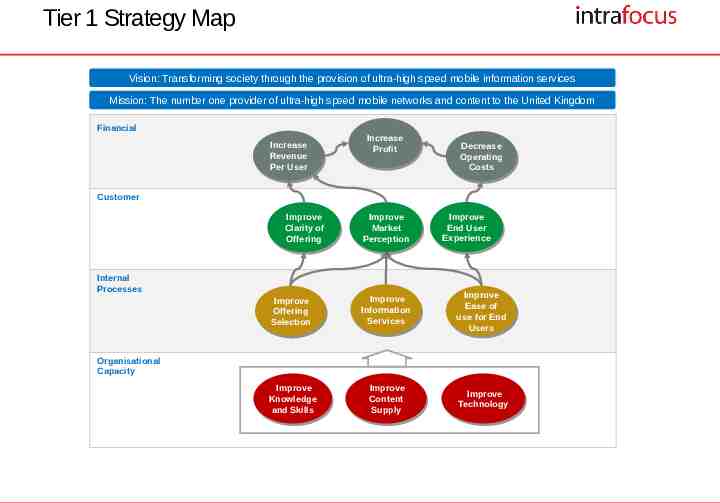
Tier 1 Strategy Map Vision: Transforming society through the provision of ultra-high speed mobile information services Mission: The number one provider of ultra-high speed mobile networks and content to the United Kingdom Financial Increase Increase Revenue Revenue Per Per User User Increase Increase Profit Profit Decrease Decrease Operating Operating Costs Costs Customer Improve Improve Clarity Clarity of of Offering Offering Improve Improve Market Market Perception Perception Internal Processes Improve Improve End End User User Experience Experience Improve Improve Offering Offering Selection Selection Improve Improve Information Information Services Services Improve Improve Ease Ease of of use use for for End End Users Users Improve Improve Knowledge Knowledge and and Skills Skills Improve Improve Content Content Supply Supply Improve Improve Technology Technology Organisational Capacity
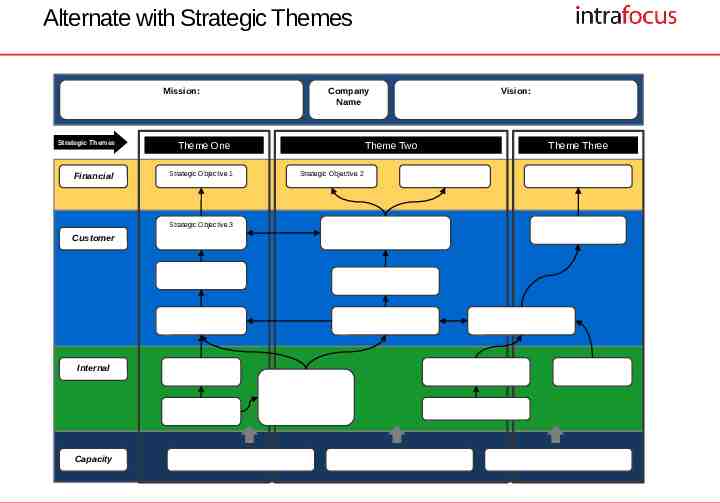
Alternate with Strategic Themes Mission: Strategic Themes Financial Theme One Strategic Objective 1 Strategic Objective 3 Customer Internal Capacity Company Name Theme Two Strategic Objective 2 Vision: Theme Three
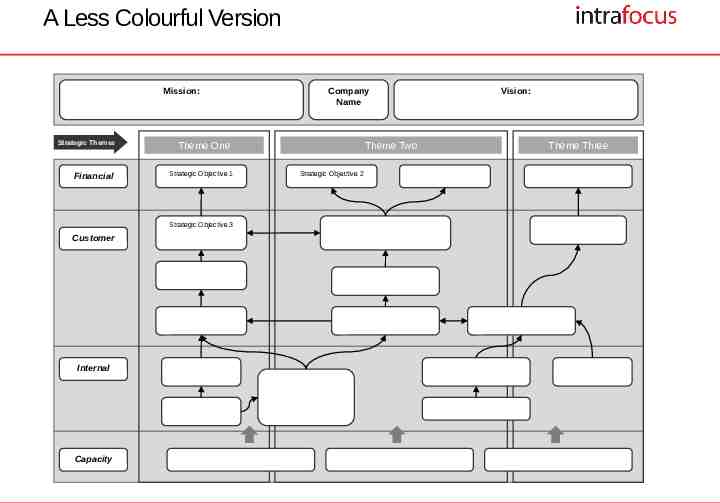
A Less Colourful Version Mission: Strategic Themes Financial Theme One Strategic Objective 1 Strategic Objective 3 Customer Internal Capacity Company Name Theme Two Strategic Objective 2 Vision: Theme Three
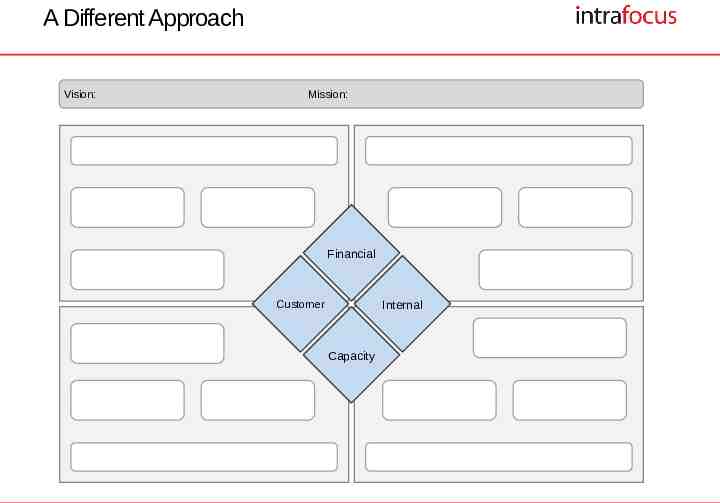
A Different Approach Vision: Mission: Financial Internal Customer Capacity
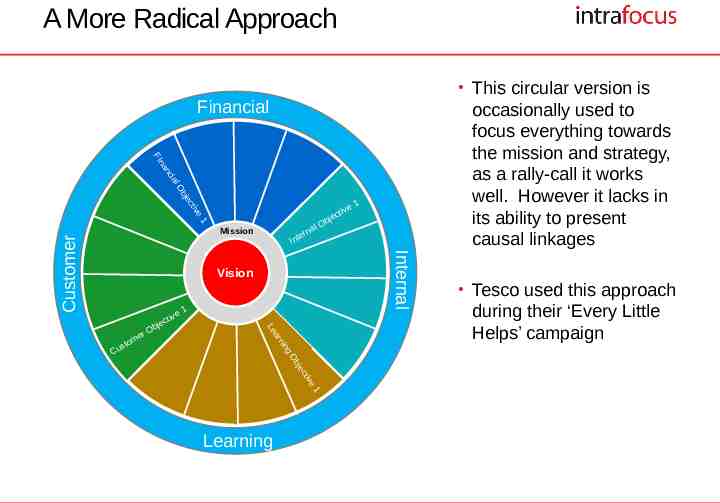
A More Radical Approach This circular version is Financial ci a an Fin occasionally used to focus everything towards the mission and strategy, as a rally-call it works well. However it lacks in its ability to present causal linkages lO c bje e tiv 1 er Int na Vision Mission i ng rn me e1 ti v a Le je Ob sto Cu c bje rO 1 Internal Customer Mission ve ct i e j b lO ve cti 1 Learning Tesco used this approach during their ‘Every Little Helps’ campaign
The Quickscore Application Software is not required to implement a Strategy Map or Balanced Scorecard, but it does help. A good software tool will allow user to: create meaningful Strategy Maps with minimum fuss organise key metrics in a meaningful way display data and combinations of data provide management teams with a clear business overview allow users to input data easily and frequently Provide the means to ‘drill down’ to the underlying data should the need arise to question a specific activity Intrafocus recommends the Quickscore product to those companies that want to take a structured approach to rolling out Strategy Maps and Balanced Scorecards