The New Seven Q.C. Tools A Training Presentation on the N7 By


69 Slides1.79 MB
The New Seven Q.C. Tools A Training Presentation on the N7 By Christopher Diaz
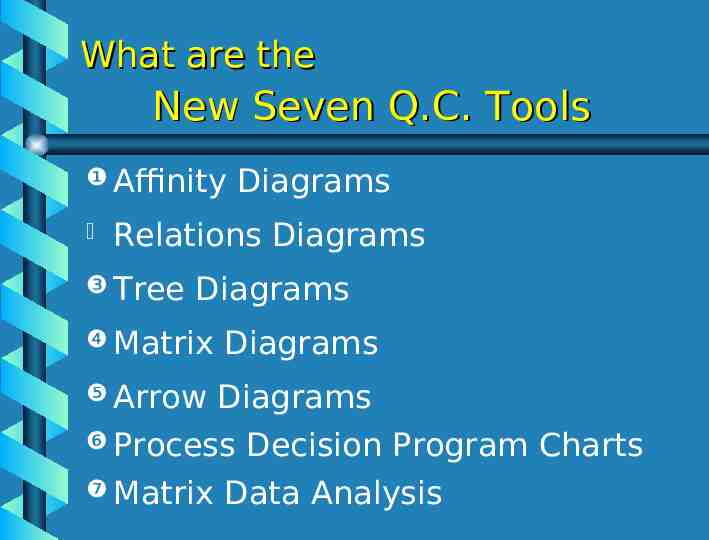
What are the New Seven Q.C. Tools Affinity Diagrams Relations Diagrams Tree Diagrams Matrix Arrow Diagrams Diagrams Process Decision Program Charts Matrix Data Analysis
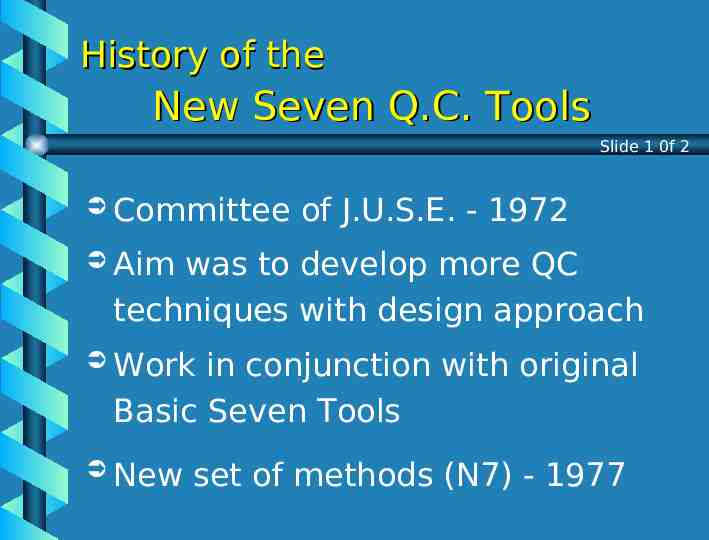
History of the New Seven Q.C. Tools Slide 1 0f 2 Committee of J.U.S.E. - 1972 Aim was to develop more QC techniques with design approach Work in conjunction with original Basic Seven Tools New set of methods (N7) - 1977
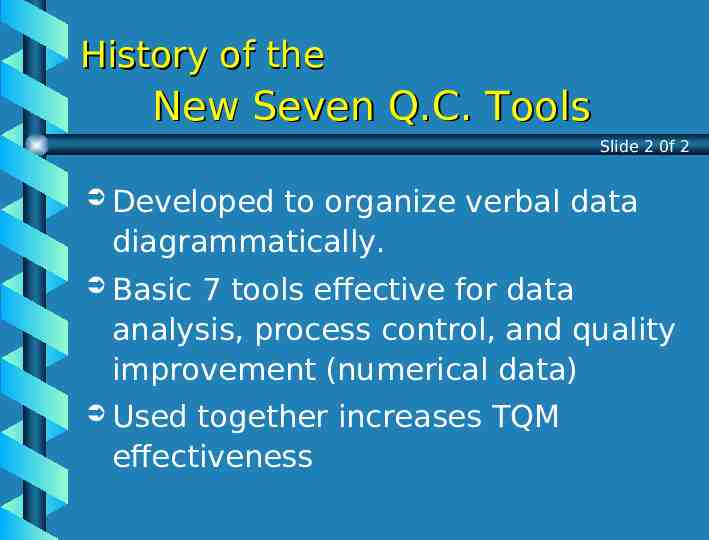
History of the New Seven Q.C. Tools Slide 2 0f 2 Developed to organize verbal data diagrammatically. Basic 7 tools effective for data analysis, process control, and quality improvement (numerical data) Used together increases TQM effectiveness
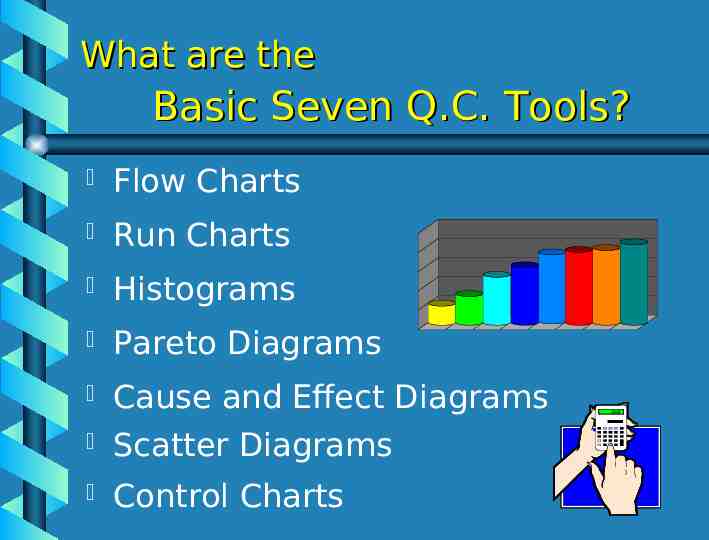
What are the Basic Seven Q.C. Tools? Flow Charts Run Charts Histograms Pareto Diagrams Cause and Effect Diagrams Scatter Diagrams Control Charts
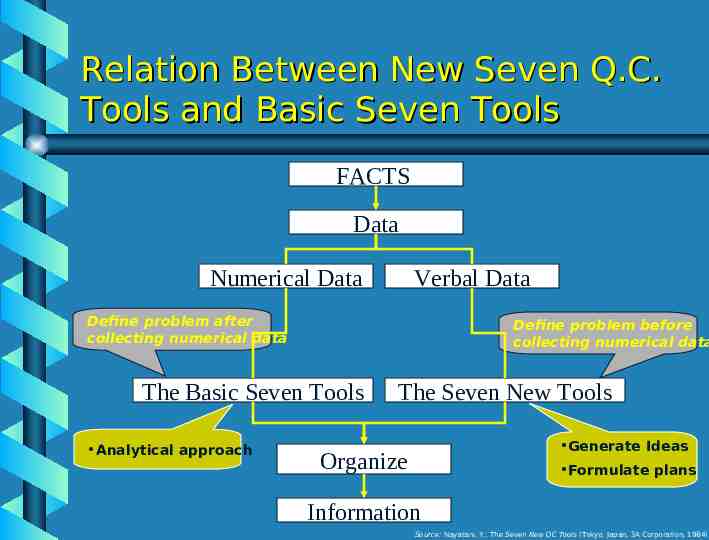
Relation Between New Seven Q.C. Tools and Basic Seven Tools FACTS Data Numerical Data Verbal Data Define problem after collecting numerical data Define problem before collecting numerical data The Basic Seven Tools Analytical approach The Seven New Tools Generate Ideas Organize Formulate plans Information Source: Nayatani, Y., The Seven New QC Tools (Tokyo, Japan, 3A Corporation, 1984)
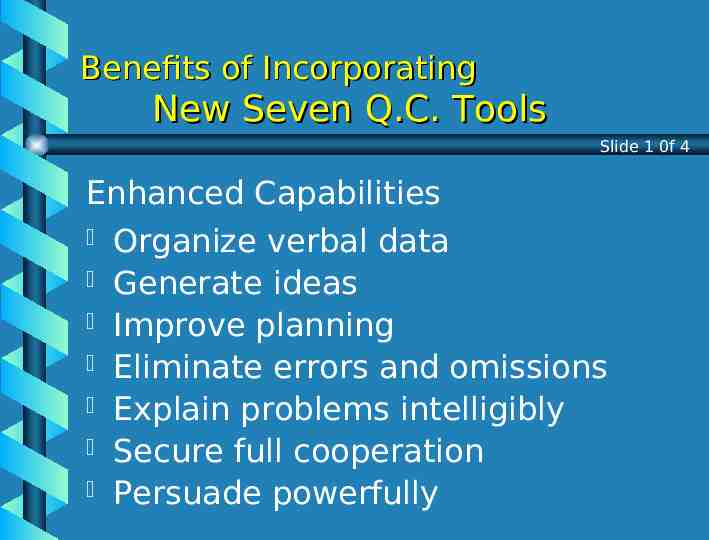
Benefits of Incorporating New Seven Q.C. Tools Slide 1 0f 4 Enhanced Capabilities Organize verbal data Generate ideas Improve planning Eliminate errors and omissions Explain problems intelligibly Secure full cooperation Persuade powerfully
Benefits of Incorporating New Seven Q.C. Tools Slide 2 0f 4 Enhanced Keys to Organizational Reform Assess situations from various angles Clarify the desired situation Prioritize tasks effectively Proceed systematically Anticipate future events Change proactively Get things right the first time
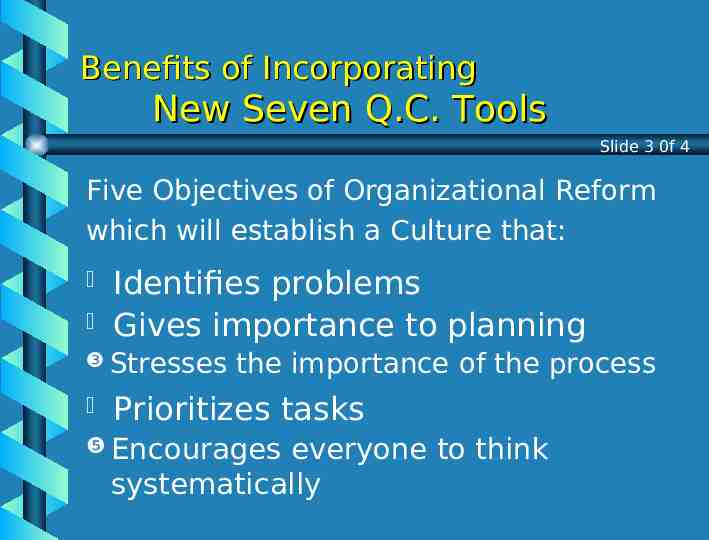
Benefits of Incorporating New Seven Q.C. Tools Slide 3 0f 4 Five Objectives of Organizational Reform which will establish a Culture that: Identifies problems Gives importance to planning Stresses the importance of the process Prioritizes tasks Encourages everyone to think systematically
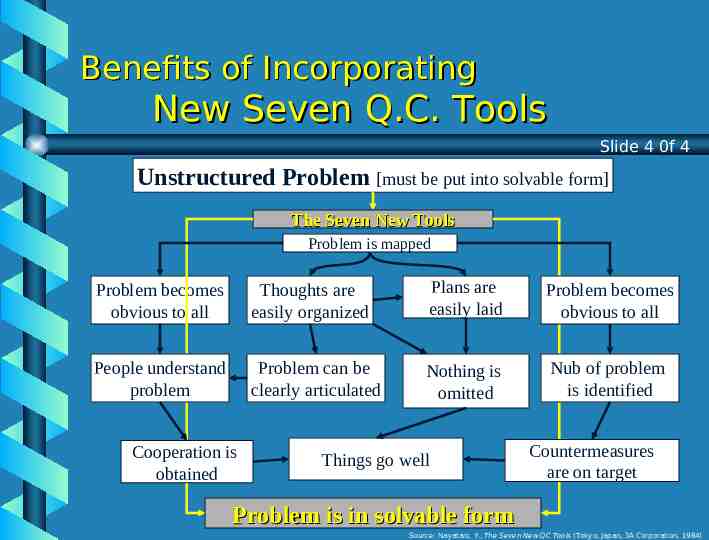
Benefits of Incorporating New Seven Q.C. Tools Slide 4 0f 4 Unstructured Problem [must be put into solvable form] The Seven New Tools Problem is mapped Problem becomes obvious to all Thoughts are easily organized Plans are easily laid Problem becomes obvious to all People understand problem Problem can be clearly articulated Nothing is omitted Nub of problem is identified Cooperation is obtained Things go well Countermeasures are on target Problem is in solvable form Source: Nayatani, Y., The Seven New QC Tools (Tokyo, Japan, 3A Corporation, 1984)
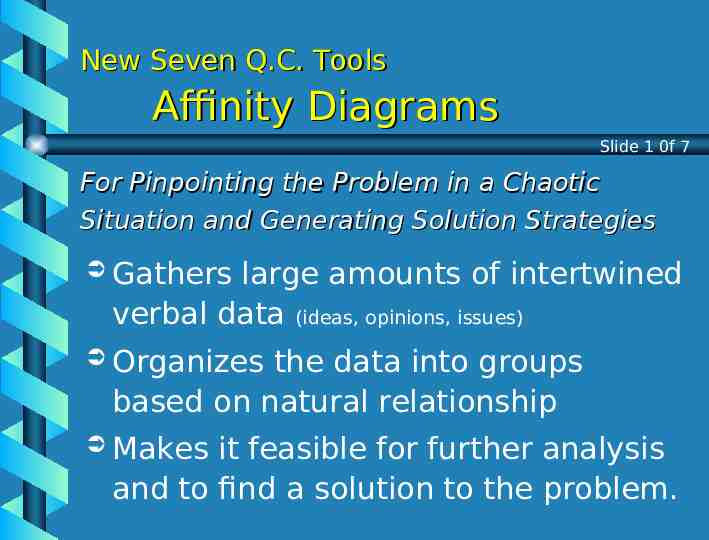
New Seven Q.C. Tools Affinity Diagrams Slide 1 0f 7 For Pinpointing the Problem in a Chaotic Situation and Generating Solution Strategies Gathers large amounts of intertwined verbal data (ideas, opinions, issues) Organizes the data into groups based on natural relationship Makes it feasible for further analysis and to find a solution to the problem.
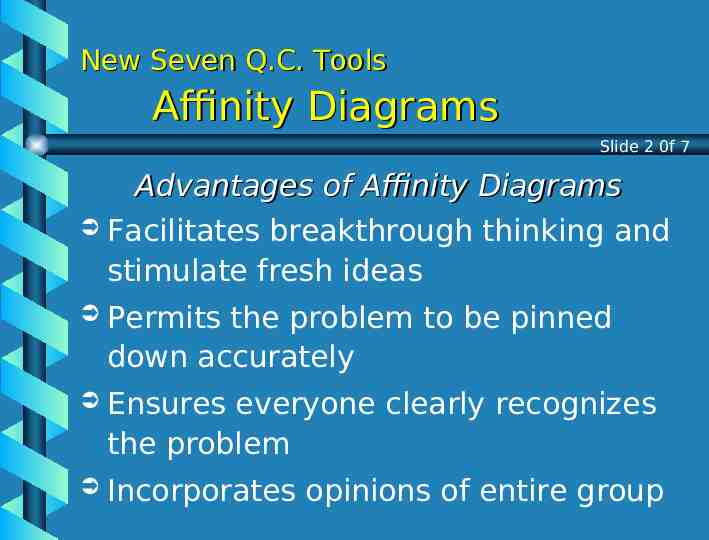
New Seven Q.C. Tools Affinity Diagrams Slide 2 0f 7 Advantages of Affinity Diagrams Facilitates breakthrough thinking and stimulate fresh ideas Permits the problem to be pinned down accurately Ensures everyone clearly recognizes the problem Incorporates opinions of entire group
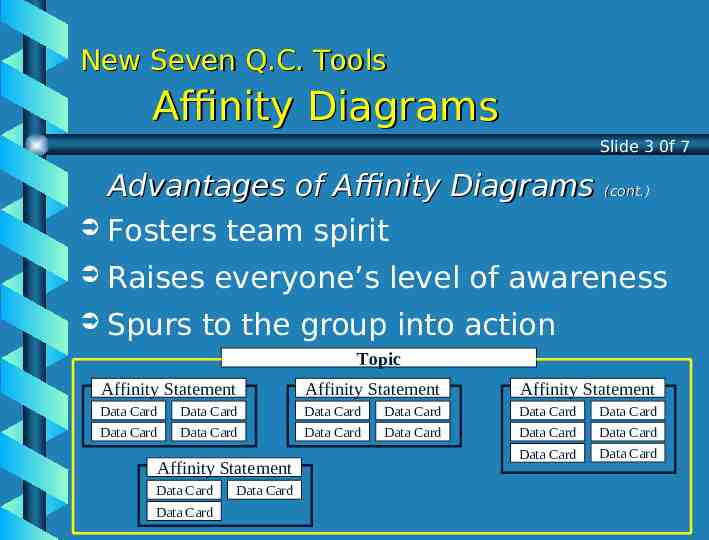
New Seven Q.C. Tools Affinity Diagrams Slide 3 0f 7 Advantages of Affinity Diagrams (cont.) Fosters team spirit Raises everyone’s level of awareness Spurs to the group into action Topic Affinity Statement Affinity Statement Affinity Statement Data Card Data Card Data Card Data Card Data Card Data Card Data Card Data Card Data Card Data Card Data Card Data Card Data Card Data Card Affinity Statement Data Card Data Card Data Card
New Seven Q.C. Tools Affinity Diagrams Slide 4 0f 7 Constructing an Affinity Diagram Group Method Approach Select a topic Collect verbal data by brainstorming Discuss info collected until everyone understands it thoroughly Write each item on separate data card Spread out all cards on table
New Seven Q.C. Tools Affinity Diagrams Slide 5 0f 7 Constructing an Affinity Diagram Group Method Approach (cont.) Move data cards into groups of similar themes (natural affinity for each other) Combine statements on data cards to new Affinity statement Make new card with Affinity statement Continue groups to combine until less than 5
New Seven Q.C. Tools Affinity Diagrams Slide 6 0f 7 Constructing an Affinity Diagram Group Method Approach (cont.) Lay the groups outs, keeping the affinity clusters together Next, complete the diagram
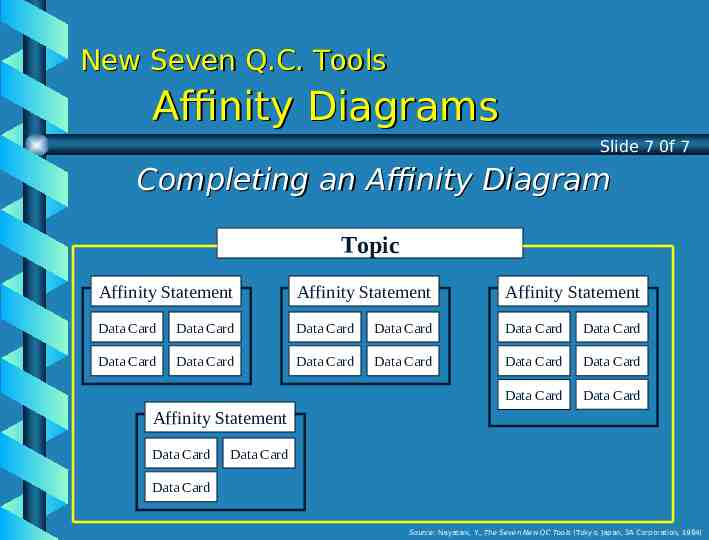
New Seven Q.C. Tools Affinity Diagrams Slide 7 0f 7 Completing an Affinity Diagram Topic Affinity Statement Affinity Statement Affinity Statement Data Card Data Card Data Card Data Card Data Card Data Card Data Card Data Card Data Card Data Card Data Card Data Card Data Card Data Card Affinity Statement Data Card Data Card Data Card Source: Nayatani, Y., The Seven New QC Tools (Tokyo, Japan, 3A Corporation, 1984)
New Seven Q.C. Tools Relations Diagrams Slide 1 0f 7 For Finding Solutions Strategies by Clarifying Relationships with Complex Interrelated Causes Resolves tangled issues by unraveling the logical connection Allows for “Multi-directional” thinking rather than linear Also known as Interrelationship diagrams
New Seven Q.C. Tools Relations Diagrams Slide 2 0f 7 Advantages of Relations Diagrams Useful at planning stage for obtaining perspective on overall situation Facilitates consensus among team Assists to develop and change people’s thinking Enables priorities to be identified accurately
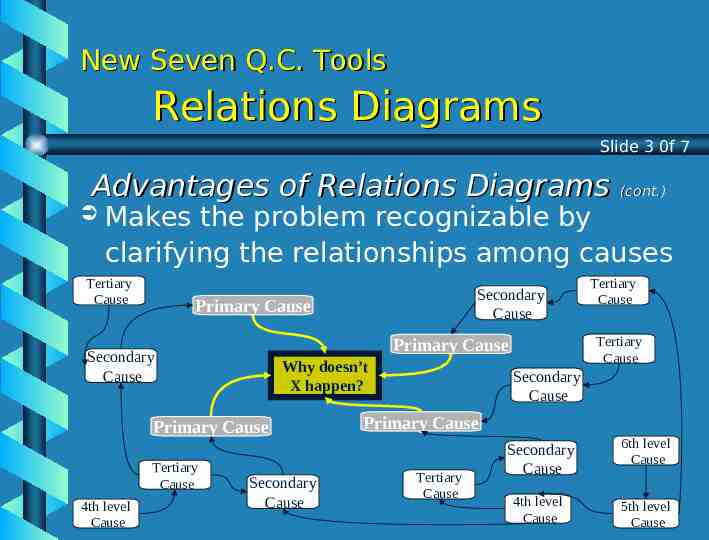
New Seven Q.C. Tools Relations Diagrams Slide 3 0f 7 Advantages of Relations Diagrams (cont.) Makes the problem recognizable by clarifying the relationships among causes Tertiary Cause Primary Cause Why doesn’t X happen? Primary Cause Tertiary Cause Secondary Cause Tertiary Cause Tertiary Cause Primary Cause Secondary Cause 4th level Cause Secondary Cause Secondary Cause Primary Cause Tertiary Cause Secondary Cause 6th level Cause 4th level Cause 5th level Cause
New Seven Q.C. Tools Relations Diagrams Slide 4 0f 7 Constructing a Relations Diagram Express Group Method Approach the problem in form of “Why isn’t something happening?” Each member lists 5 causes affecting problem Write each item on a card Discuss info collected until everyone understands it thoroughly
New Seven Q.C. Tools Relations Diagrams Slide 5 0f 7 Constructing a Relations Diagram Group Method Approach (cont.) Move cards into similar groups Asking why, explore the cause-effect relationships, and divide the cards into primary, secondary and tertiary causes Connect all cards by these relationships Further discuss until all possible causes have been identified
New Seven Q.C. Tools Relations Diagrams Slide 6 0f 7 Constructing a Relations Diagram Group Method Approach (cont.) Review whole diagram looking for relationships among causes Connect all related groups Next, complete the diagram
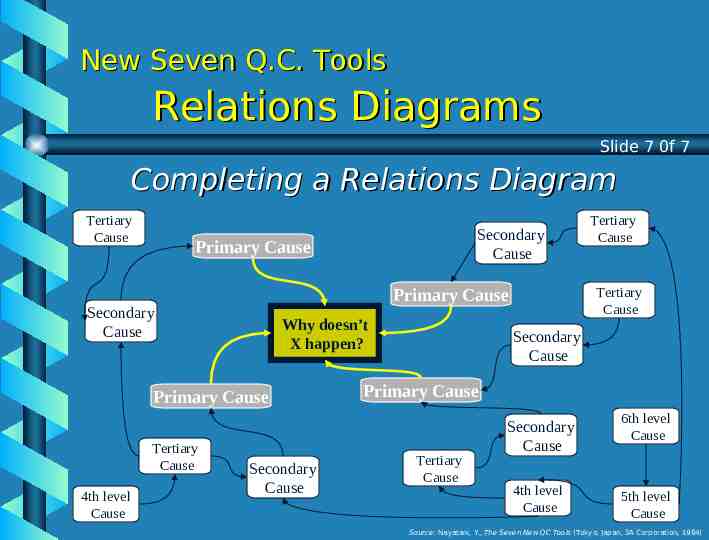
New Seven Q.C. Tools Relations Diagrams Slide 7 0f 7 Completing a Relations Diagram Tertiary Cause Primary Cause Why doesn’t X happen? Primary Cause Tertiary Cause Secondary Cause Tertiary Cause Tertiary Cause Primary Cause Secondary Cause 4th level Cause Secondary Cause Secondary Cause Primary Cause Tertiary Cause Secondary Cause 6th level Cause 4th level Cause 5th level Cause Source: Nayatani, Y., The Seven New QC Tools (Tokyo, Japan, 3A Corporation, 1984)
New Seven Q.C. Tools Tree Diagrams Slide 1 0f 5 For Systematically Pursuing the Best Strategies for Attaining an Objective Develops a succession of strategies for achieving objectives Reveals Also methods to achieve the results. known as Systematic diagrams or Dendrograms
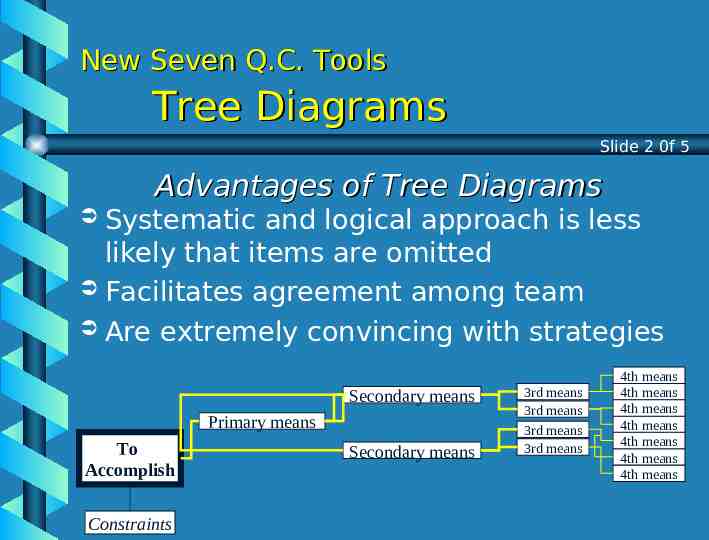
New Seven Q.C. Tools Tree Diagrams Slide 2 0f 5 Advantages of Tree Diagrams Systematic and logical approach is less likely that items are omitted Facilitates agreement among team Are extremely convincing with strategies Secondary means Primary means To Accomplish Constraints Secondary means 3rd means 3rd means 3rd means 3rd means 4th means 4th means 4th means 4th means 4th means 4th means 4th means
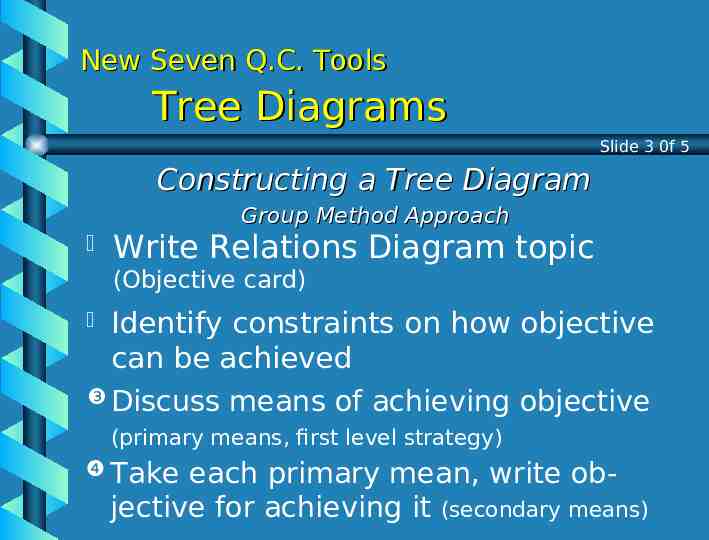
New Seven Q.C. Tools Tree Diagrams Slide 3 0f 5 Constructing a Tree Diagram Group Method Approach Write Relations Diagram topic (Objective card) Identify constraints on how objective can be achieved Discuss means of achieving objective (primary means, first level strategy) Take each primary mean, write objective for achieving it (secondary means)
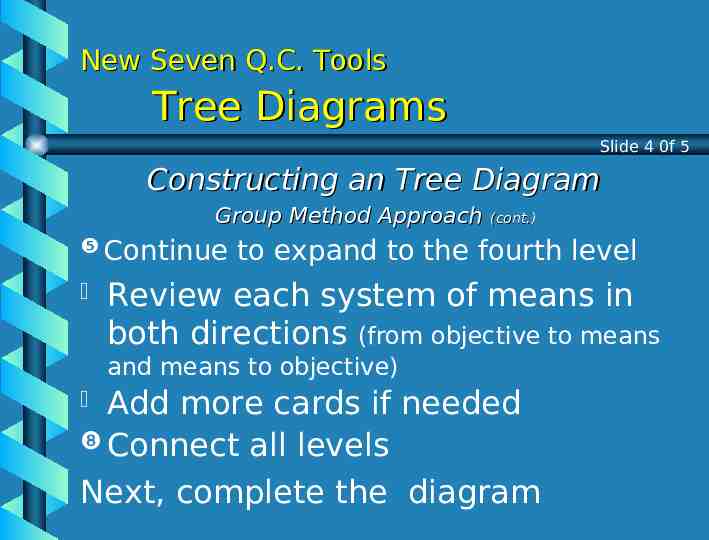
New Seven Q.C. Tools Tree Diagrams Slide 4 0f 5 Constructing an Tree Diagram Group Method Approach (cont.) Continue to expand to the fourth level Review each system of means in both directions (from objective to means and means to objective) Add more cards if needed Connect all levels Next, complete the diagram
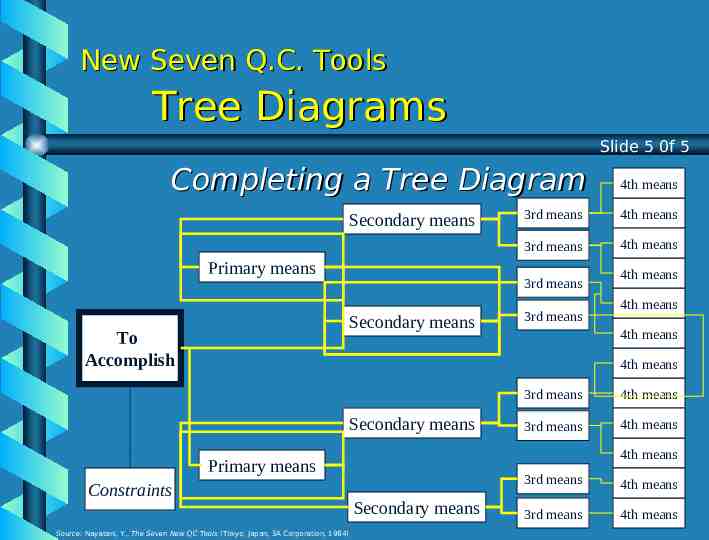
New Seven Q.C. Tools Tree Diagrams Slide 5 0f 5 Completing a Tree Diagram Secondary means Primary means To Accomplish 3rd means 4th means 3rd means 4th means 3rd means Secondary means 4th means 3rd means 4th means 4th means 4th means 4th means Secondary means Source: Nayatani, Y., The Seven New QC Tools (Tokyo, Japan, 3A Corporation, 1984) 4th means 3rd means 4th means 4th means Primary means Constraints 3rd means Secondary means 3rd means 4th means 3rd means 4th means
New Seven Q.C. Tools Matrix Diagrams Slide 1 0f 7 For Clarifying Problems by “Thinking Multidimensionally” Consists of a two-dimensional array to determine location and nature of problem Discovers key ideas by relationships represented by the cells in matrix.
New Seven Q.C. Tools Matrix Diagrams Slide 2 0f 7 Advantages of Matrix Diagrams Enable data on ideas based on extensive experience Clarifies relationships among different elements Makes overall structure of problem immediately obvious Combined from two to four types of diagrams, location of problem is clearer.
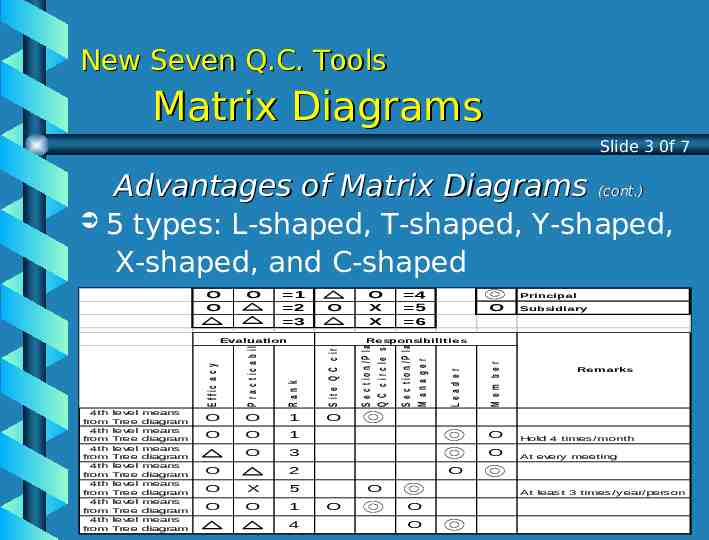
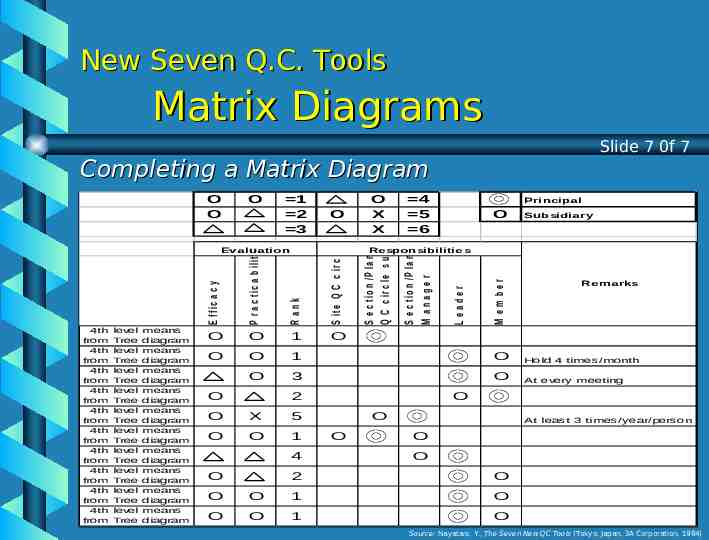
New Seven Q.C. Tools Matrix Diagrams Slide 3 0f 7 Advantages of Matrix Diagrams (cont.) 5 types: L-shaped, T-shaped, Y-shaped, X-shaped, and C-shaped means diagram means diagram means diagram means diagram means diagram means diagram means diagram S e c t io n /P la n t Q C c ir c le s u p p o r t e r 4 5 6 Principa l O Subsidia ry O 1 O O O 1 O Hold 4 times/month O 3 O At every meeting O S e c t io n /P la n t M anager S it e Q C c ir c le level Tree level Tree level Tree level Tree level Tree level Tree level Tree O X X O 2 O X 5 O O 1 4 M em ber Responsibilities Leader Eva luation 4th from 4th from 4th from 4th from 4th from 4th from 4th from O Rank 1 2 3 P r a c t ic a b ilit y O E f f ic a c y O O Rema rks O O O At least 3 times/year/person O O
New Seven Q.C. Tools Matrix Diagrams Slide 4 0f 7 Constructing a Matrix Diagram Write final-level means from Tree diagram forming vertical axis Write in Evaluation categories (efficacy, practicability, and rank) on horizontal axis. Examine final-level means to identify whom will implement them Write names along horizontal axis
New Seven Q.C. Tools Matrix Diagrams Slide 5 0f 7 Constructing a Matrix Diagram (cont.) Label group of columns as Label “Responsibilities” right-hand end of horizontal axis as “Remarks” Examine each cell and insert the appropriate symbol: Efficacy: O good, satisfactory, X none Practicability: O good, satisfactory, X none
New Seven Q.C. Tools Matrix Diagrams Slide 6 0f 7 Constructing a Matrix Diagram (cont.) Determine score for each combination of symbols, record in rank column Examine cells under Responsibility Columns, insert double-circle for Principal and single-circle for Subsidiary Fill out remarks column and record meanings of symbol Next, complete the diagram
New Seven Q.C. Tools Matrix Diagrams Slide 7 0f 7 Completing a Matrix Diagram O 1 2 3 Subsidiary Responsibilitie s 1 O O O 1 O Hold 4 times/month O 3 O At every meeting O 2 O X 5 O O 1 4 O M em ber O Leader O S e c t io n /P la n t M anager S it e Q C c ir c le means diagram means diagram means diagram means diagram means diagram means diagram means diagram means diagram means diagram means diagram O Rank level Tree level Tree level Tree level Tree level Tree level Tree level Tree level Tree level Tree level Tree Principal P r a c t ic a b ilit y 4th from 4th from 4th from 4th from 4th from 4th from 4th from 4th from 4th from 4th from 4 5 6 E f f ic a c y Eva lua tion O O X X S e c t io n /P la n t Q C c ir c le s u p p o r t e r O O O O O At least 3 times/year/person O O 2 O O O O 1 O O 1 Re ma rks O Source: Nayatani, Y., The Seven New QC Tools (Tokyo, Japan, 3A Corporation, 1984)
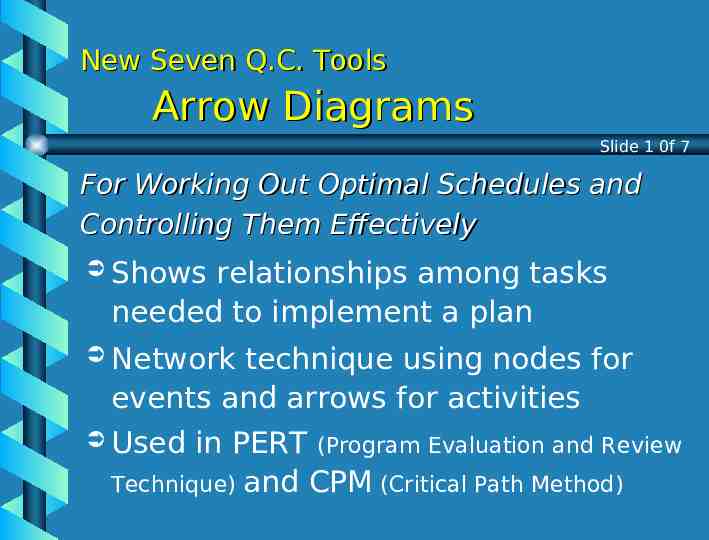
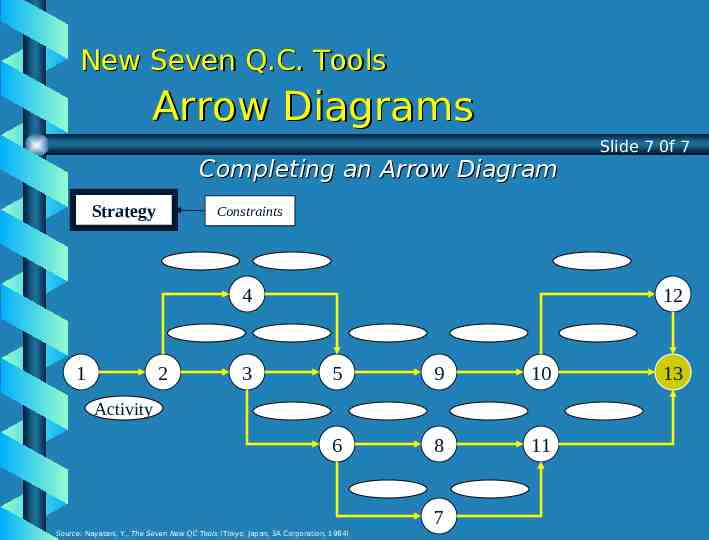
New Seven Q.C. Tools Arrow Diagrams Slide 1 0f 7 For Working Out Optimal Schedules and Controlling Them Effectively Shows relationships among tasks needed to implement a plan Network technique using nodes for events and arrows for activities Used in PERT (Program Evaluation and Review Technique) and CPM (Critical Path Method)
New Seven Q.C. Tools Arrow Diagrams Slide 2 0f 7 Advantages of Arrow Diagrams Allows overall task to viewed and potential snags to be identified before work starts Leads to discovery of possible improvements Makes it easy to monitor progress of work Deals promptly with changes to plan Improves communication among team
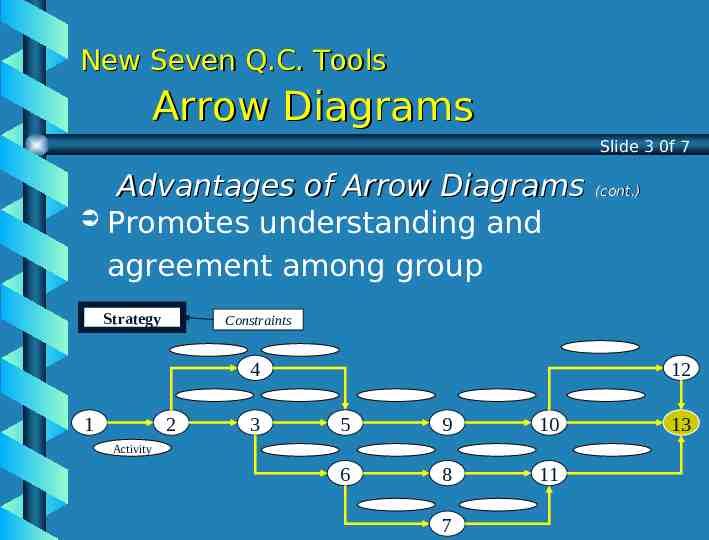
New Seven Q.C. Tools Arrow Diagrams Slide 3 0f 7 Advantages of Arrow Diagrams (cont.) Promotes understanding and agreement among group Strategy Constraints 4 1 2 3 12 5 9 10 6 8 11 Activity 7 13
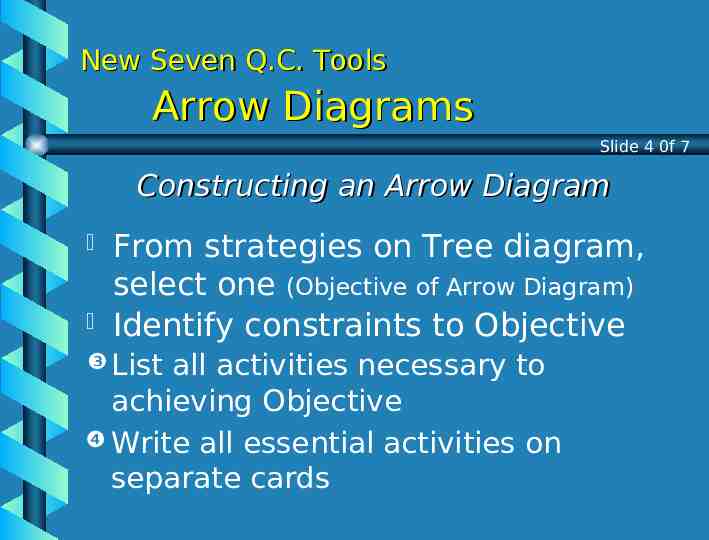
New Seven Q.C. Tools Arrow Diagrams Slide 4 0f 7 Constructing an Arrow Diagram From strategies on Tree diagram, select one (Objective of Arrow Diagram) Identify constraints to Objective List all activities necessary to achieving Objective Write all essential activities on separate cards
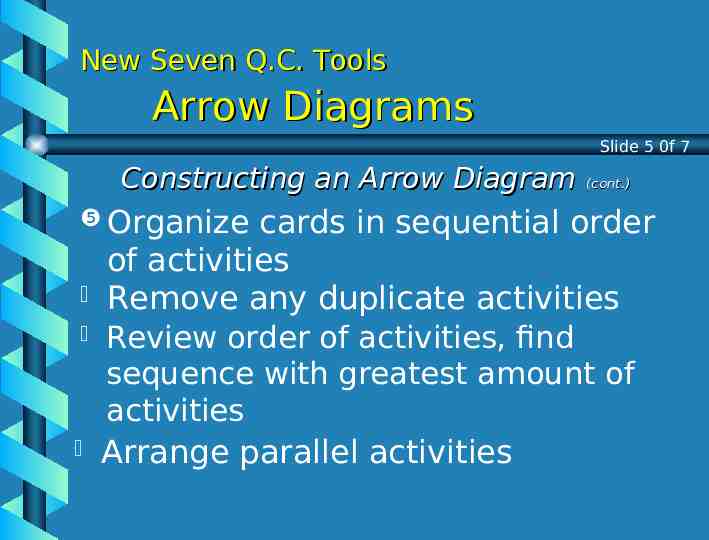
New Seven Q.C. Tools Arrow Diagrams Slide 5 0f 7 Constructing an Arrow Diagram (cont.) Organize cards in sequential order of activities Remove any duplicate activities Review order of activities, find sequence with greatest amount of activities Arrange parallel activities
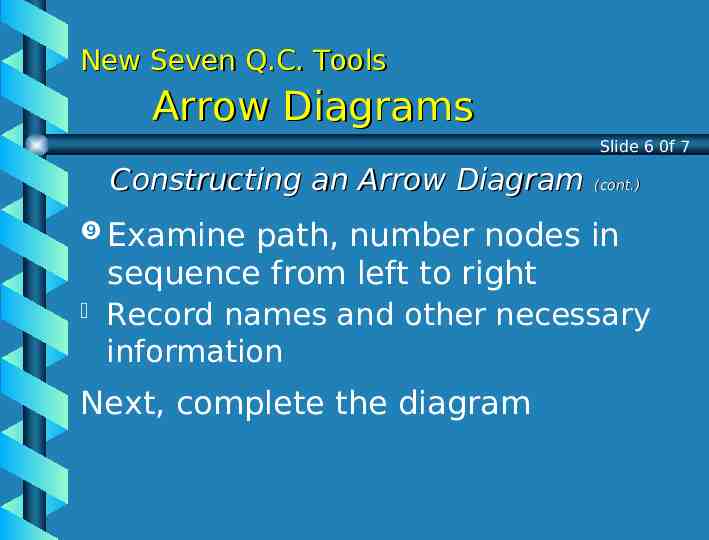
New Seven Q.C. Tools Arrow Diagrams Slide 6 0f 7 Constructing an Arrow Diagram (cont.) Examine path, number nodes in sequence from left to right Record names and other necessary information Next, complete the diagram
New Seven Q.C. Tools Arrow Diagrams Completing an Arrow Diagram Strategy Constraints 4 1 Slide 7 0f 7 2 3 12 5 9 10 6 8 11 Activity 7 Source: Nayatani, Y., The Seven New QC Tools (Tokyo, Japan, 3A Corporation, 1984) 13
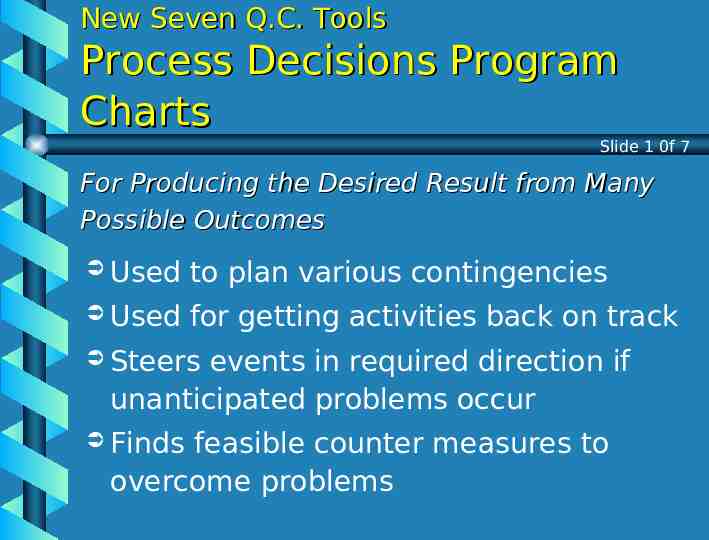
New Seven Q.C. Tools Process Decisions Program Charts Slide 1 0f 7 For Producing the Desired Result from Many Possible Outcomes Used to plan various contingencies Used for getting activities back on track Steers events in required direction if unanticipated problems occur Finds feasible counter measures to overcome problems
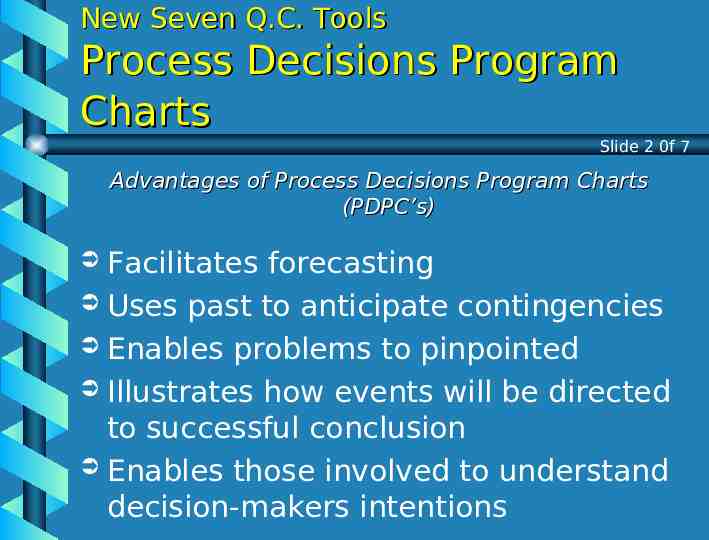
New Seven Q.C. Tools Process Decisions Program Charts Slide 2 0f 7 Advantages of Process Decisions Program Charts (PDPC’s) Facilitates forecasting Uses past to anticipate contingencies Enables problems to pinpointed Illustrates how events will be directed to successful conclusion Enables those involved to understand decision-makers intentions
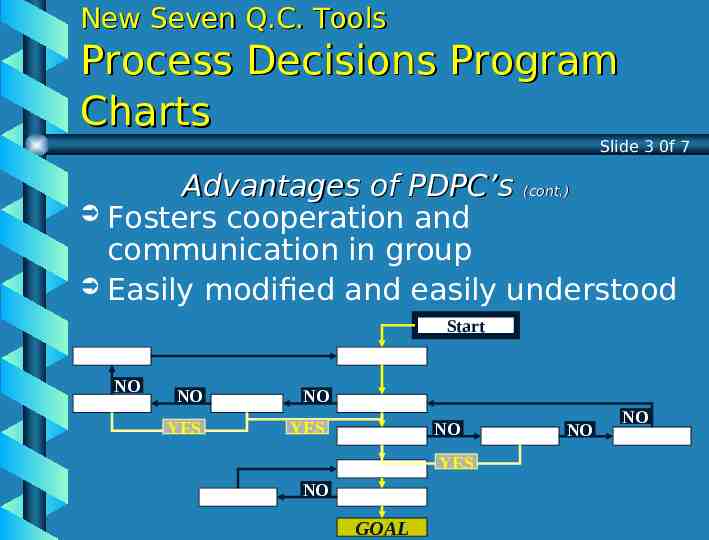
New Seven Q.C. Tools Process Decisions Program Charts Slide 3 0f 7 Advantages of PDPC’s (cont.) Fosters cooperation and communication in group Easily modified and easily understood Start NO NO NO YES YES NO YES NO GOAL NO NO
New Seven Q.C. Tools Process Decisions Program Charts Slide 4 0f 7 Constructing a PDPC Select a highly effective, but difficult strategy from the Tree diagram Decide on a goal Identify existing situation (most desirable outcome) (Starting point) Identify constraints of objective List activities to reach goal and potential problems with each activity
New Seven Q.C. Tools Process Decisions Program Charts Slide 5 0f 7 Constructing an PDPC (cont.) Review list. Add extra activities or problems not thought of previously Prepare contingency plan for each step and review what action is needed if step is not achieved Examine carefully to check for inconsistencies and all important factors are included
New Seven Q.C. Tools Process Decisions Program Charts Slide 6 0f 7 Constructing an PDPC (cont.) Examine to make sure all contingency plans are adequate Next, complete the diagram
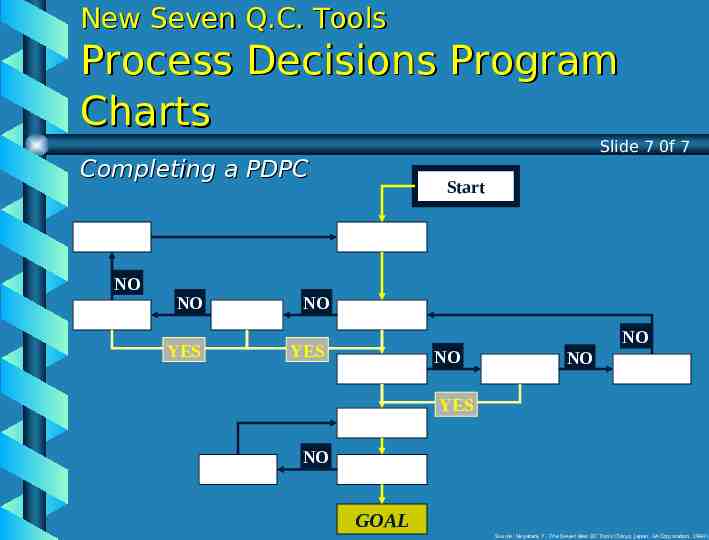
New Seven Q.C. Tools Process Decisions Program Charts Slide 7 0f 7 Completing a PDPC NO NO YES Start NO YES NO NO NO YES NO GOAL Source: Nayatani, Y., The Seven New QC Tools (Tokyo, Japan, 3A Corporation, 1984)
New Seven Q.C. Tools Matrix Data Analysis Slide 1 0f 6 Principal Component Analysis Technique quantifies and arranges data presented in Matrix Based Finds solely on numerical data indicators that differentiate and attempt to clarify large amount of information
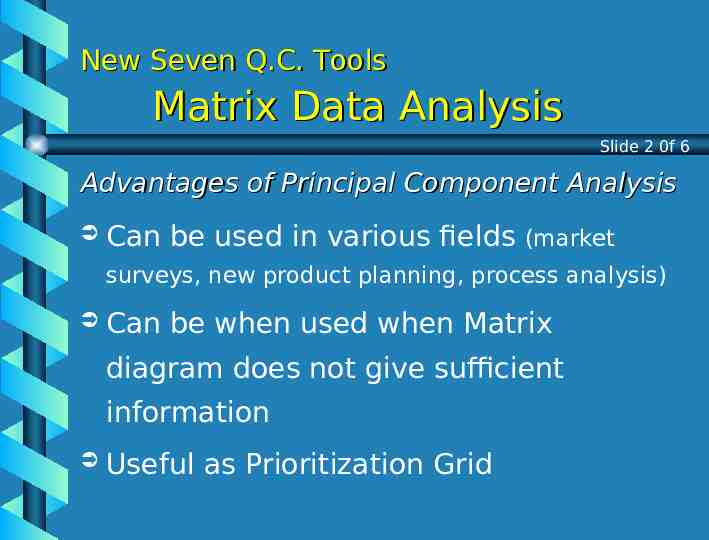
New Seven Q.C. Tools Matrix Data Analysis Slide 2 0f 6 Advantages of Principal Component Analysis Can be used in various fields (market surveys, new product planning, process analysis) Can be when used when Matrix diagram does not give sufficient information Useful as Prioritization Grid
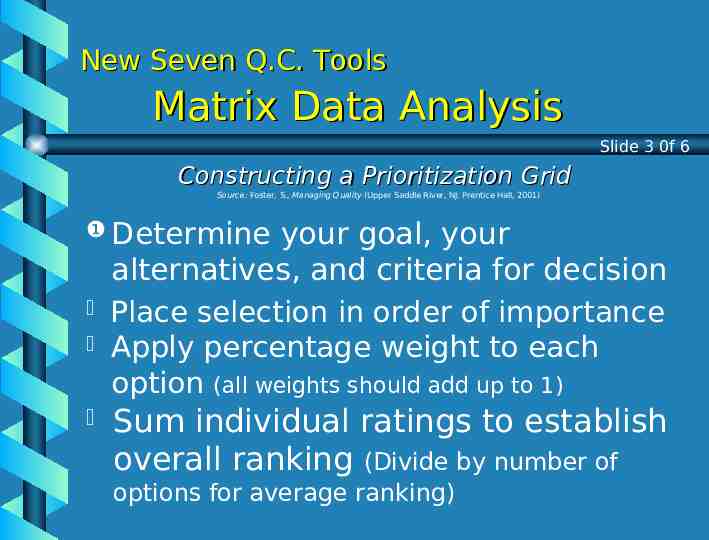
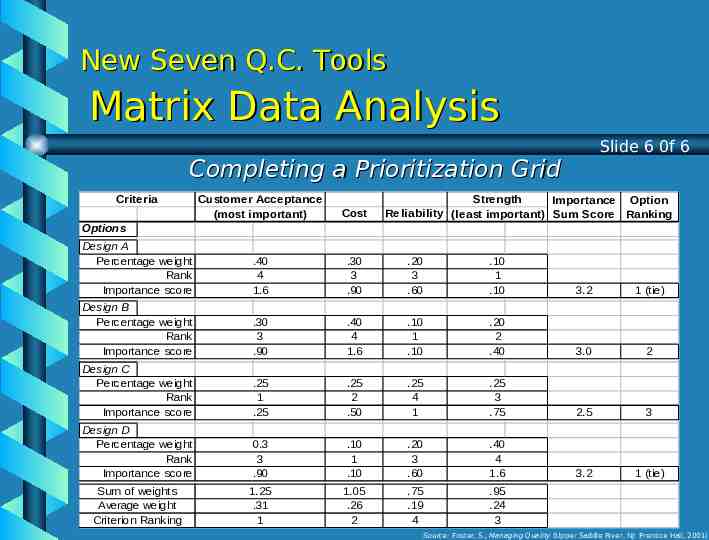
New Seven Q.C. Tools Matrix Data Analysis Slide 3 0f 6 Constructing a Prioritization Grid Source: Foster, S., Managing Quality (Upper Saddle River, NJ: Prentice Hall, 2001) Determine your goal, your alternatives, and criteria for decision Place selection in order of importance Apply percentage weight to each option (all weights should add up to 1) Sum individual ratings to establish overall ranking (Divide by number of options for average ranking)
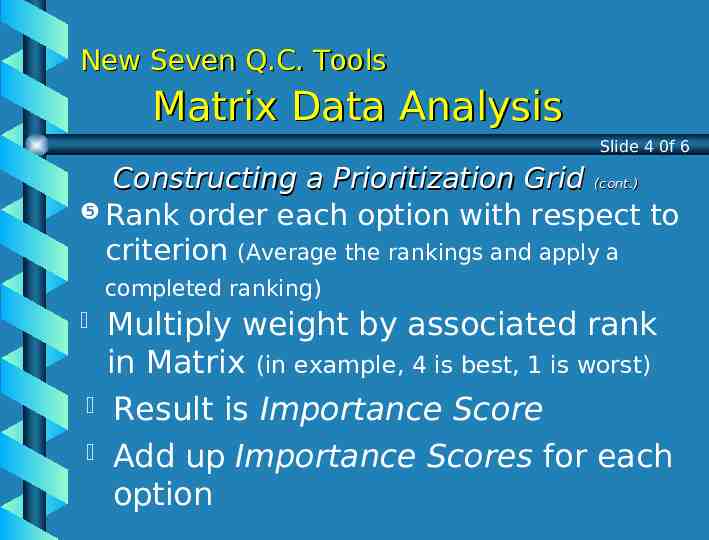
New Seven Q.C. Tools Matrix Data Analysis Slide 4 0f 6 Constructing a Prioritization Grid (cont.) Rank order each option with respect to criterion (Average the rankings and apply a completed ranking) Multiply weight by associated rank in Matrix (in example, 4 is best, 1 is worst) Result is Importance Score Add up Importance Scores for each option
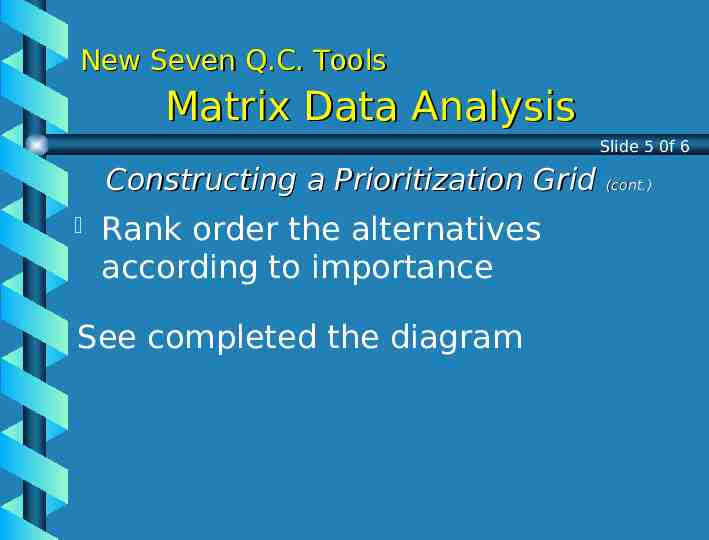
New Seven Q.C. Tools Matrix Data Analysis Slide 5 0f 6 Constructing a Prioritization Grid (cont.) Rank order the alternatives according to importance See completed the diagram
New Seven Q.C. Tools Matrix Data Analysis Slide 6 0f 6 Completing a Prioritization Grid Criteria Customer Acceptance (most important) Strength Importance Option Reliability (least important) Sum Score Ranking Cost Design A Percentage weight Rank Importance score .40 4 1.6 .30 3 .90 .20 3 .60 .10 1 .10 3.2 1 (tie) Design B Percentage weight Rank Importance score .30 3 .90 .40 4 1.6 .10 1 .10 .20 2 .40 3.0 2 Design C Percentage weight Rank Importance score .25 1 .25 .25 2 .50 .25 4 1 .25 3 .75 2.5 3 Design D Percentage weight Rank Importance score 0.3 3 .90 .10 1 .10 .20 3 .60 .40 4 1.6 3.2 1 (tie) Sum of weights Average weight Criterion Ranking 1.25 .31 1 1.05 .26 2 .75 .19 4 .95 .24 3 Options Source: Foster, S., Managing Quality (Upper Saddle River, NJ: Prentice Hall, 2001)
Review New Seven Q.C. Tools Affinity Diagrams Relations Diagrams Tree Diagrams Matrix Diagrams Arrow Diagrams Process Decision Program Charts Matrix Data Analysis
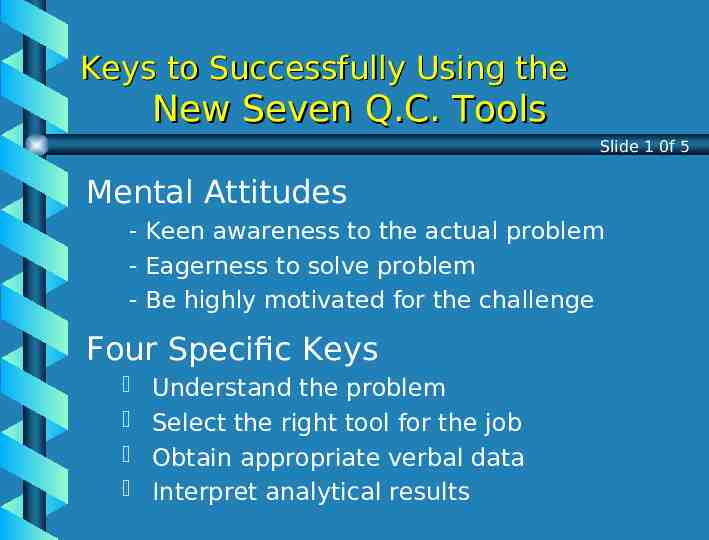
Keys to Successfully Using the New Seven Q.C. Tools Slide 1 0f 5 Mental Attitudes - Keen awareness to the actual problem - Eagerness to solve problem - Be highly motivated for the challenge Four Specific Keys Understand the problem Select the right tool for the job Obtain appropriate verbal data Interpret analytical results
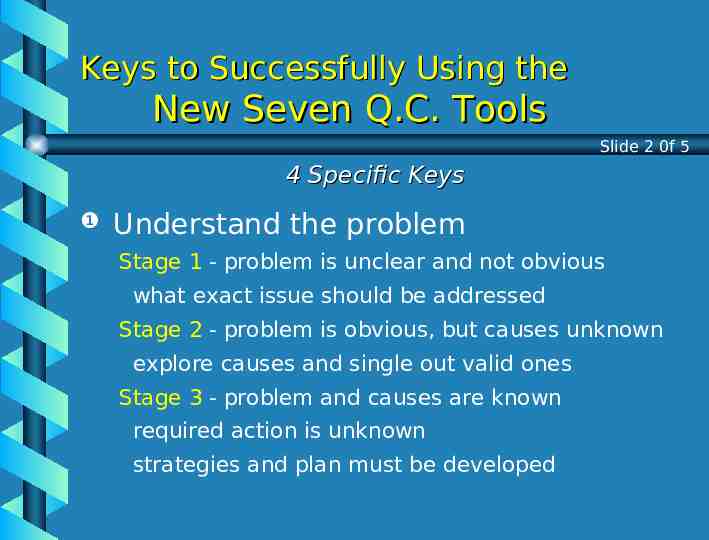
Keys to Successfully Using the New Seven Q.C. Tools Slide 2 0f 5 4 Specific Keys Understand the problem Stage 1 - problem is unclear and not obvious what exact issue should be addressed Stage 2 - problem is obvious, but causes unknown explore causes and single out valid ones Stage 3 - problem and causes are known required action is unknown strategies and plan must be developed
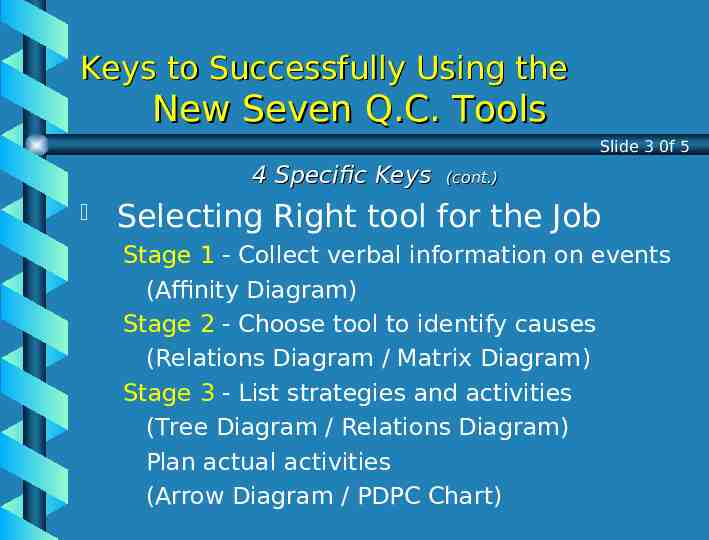
Keys to Successfully Using the New Seven Q.C. Tools Slide 3 0f 5 4 Specific Keys (cont.) Selecting Right tool for the Job Stage 1 - Collect verbal information on events (Affinity Diagram) Stage 2 - Choose tool to identify causes (Relations Diagram / Matrix Diagram) Stage 3 - List strategies and activities (Tree Diagram / Relations Diagram) Plan actual activities (Arrow Diagram / PDPC Chart)
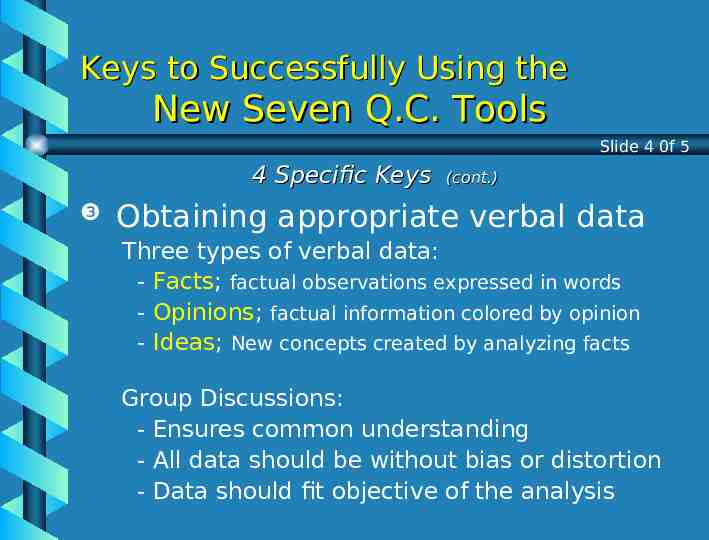
Keys to Successfully Using the New Seven Q.C. Tools Slide 4 0f 5 4 Specific Keys (cont.) Obtaining appropriate verbal data Three types of verbal data: - Facts; factual observations expressed in words - Opinions; factual information colored by opinion - Ideas; New concepts created by analyzing facts .Group Discussions: - Ensures common understanding - All data should be without bias or distortion - Data should fit objective of the analysis
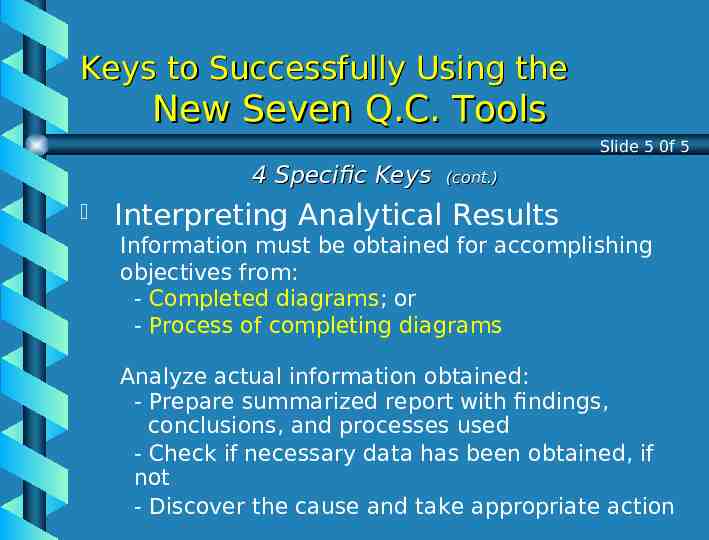
Keys to Successfully Using the New Seven Q.C. Tools Slide 5 0f 5 4 Specific Keys (cont.) Interpreting Analytical Results Information must be obtained for accomplishing objectives from: - Completed diagrams; or - Process of completing diagrams Analyze actual information obtained: - Prepare summarized report with findings, conclusions, and processes used - Check if necessary data has been obtained, if not - Discover the cause and take appropriate action
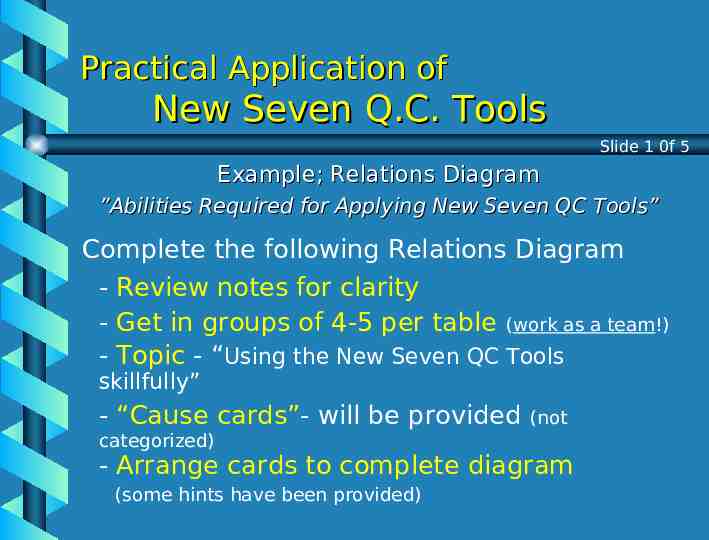
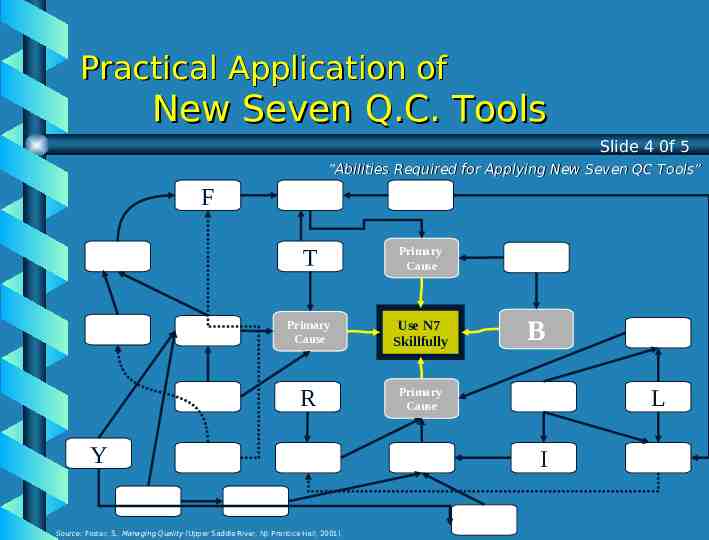
Practical Application of New Seven Q.C. Tools Slide 1 0f 5 Example; Relations Diagram ”Abilities Required for Applying New Seven QC Tools” Complete the following Relations Diagram - Review notes for clarity - Get in groups of 4-5 per table (work as a team!) - Topic - “Using the New Seven QC Tools skillfully” - “Cause cards”- will be provided categorized) (not - Arrange cards to complete diagram (some hints have been provided)
Practical Application of New Seven Q.C. Tools Slide 2 0f 5 ”Abilities Required for Applying New Seven QC Tools” Primary Cause Primary Cause Use N7 Skillfully Primary Cause Source: Foster, S., Managing Quality (Upper Saddle River, NJ: Prentice Hall, 2001) Primary Cause
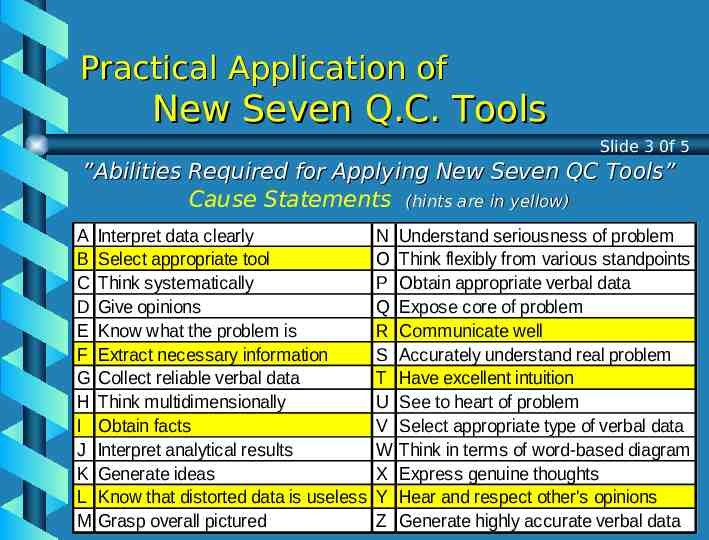
Practical Application of New Seven Q.C. Tools Slide 3 0f 5 ”Abilities Required for Applying New Seven QC Tools” Cause Statements (hints are in yellow) A B C D E F G H I J K L M Interpret data clearly Select appropriate tool Think systematically Give opinions Know what the problem is Extract necessary information Collect reliable verbal data Think multidimensionally Obtain facts Interpret analytical results Generate ideas Know that distorted data is useless Grasp overall pictured N O P Q R S T U V W X Y Z Understand seriousness of problem Think flexibly from various standpoints Obtain appropriate verbal data Expose core of problem Communicate well Accurately understand real problem Have excellent intuition See to heart of problem Select appropriate type of verbal data Think in terms of word-based diagram Express genuine thoughts Hear and respect other's opinions Generate highly accurate verbal data
Practical Application of New Seven Q.C. Tools Slide 4 0f 5 ”Abilities Required for Applying New Seven QC Tools” F T Primary Cause Primary Cause Use N7 Skillfully R Primary Cause Y Source: Foster, S., Managing Quality (Upper Saddle River, NJ: Prentice Hall, 2001) B L I
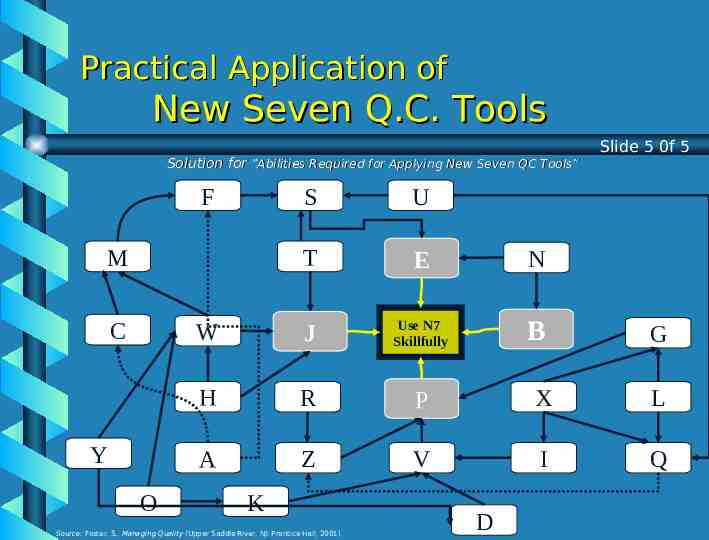
Practical Application of New Seven Q.C. Tools Solution for ”Abilities Required for Applying New Seven QC Tools” F S U T E N W J Use N7 Skillfully B G H R P X L A Z V I Q M C Y O Slide 5 0f 5 K Source: Foster, S., Managing Quality (Upper Saddle River, NJ: Prentice Hall, 2001) D
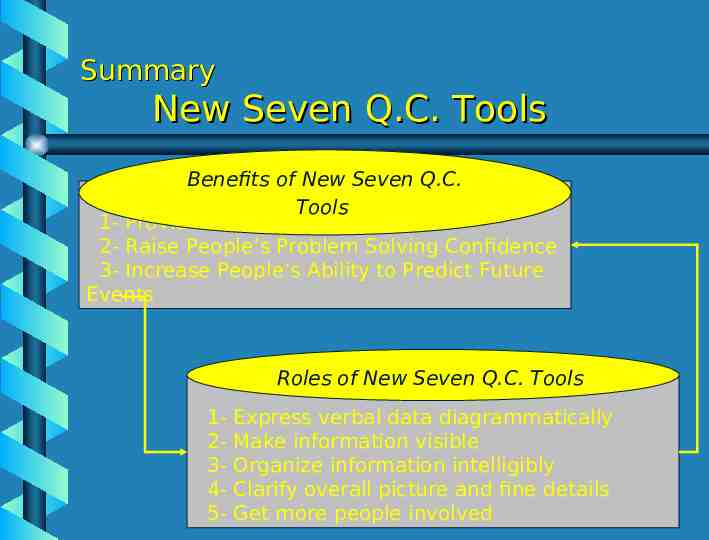
Summary New Seven Q.C. Tools Benefits of New Seven Q.C. Tools 1- Provide Training in Thinking 2- Raise People’s Problem Solving Confidence 3- Increase People’s Ability to Predict Future Events Roles of New Seven Q.C. Tools 12345- Express verbal data diagrammatically Make information visible Organize information intelligibly Clarify overall picture and fine details Get more people involved
Bibliography Foster, Thomas. Managing Quality. An Integrative Approach . Upper Saddle River : Prentice Hall, 2001. Nayatani, Yoshingobu, Eiga, Toru, Futami, Ryoji, Miyagawa, Hiroyuki, and Loftus, John. The Seven New QC Tools: Practical Applications for Managers. Tokyo : 3A Corporation, 1994. “TQM: The 9 TQM Tools.” Internet http://www.iqd.com/pfttools.htm.