Squirrel Tutorial Post – Pre-Process Steps Airbeam correction
24 Slides1.91 MB
Squirrel Tutorial Post – Pre-Process Steps Airbeam correction PToF DVa, DC markers Fragmentation checks Donna Sueper Aerodyne, University of Colorado, Boulder
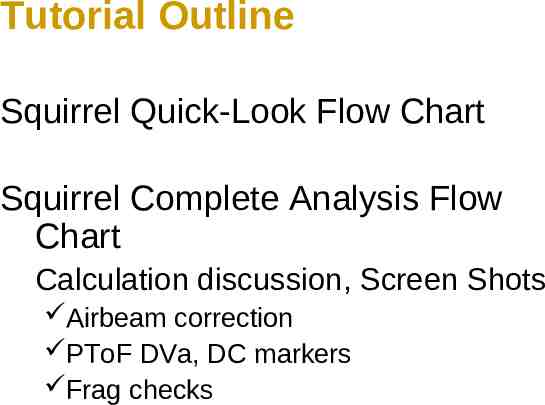
Tutorial Outline Squirrel Quick-Look Flow Chart Squirrel Complete Analysis Flow Chart Calculation discussion, Screen Shots Airbeam correction PToF DVa, DC markers Frag checks
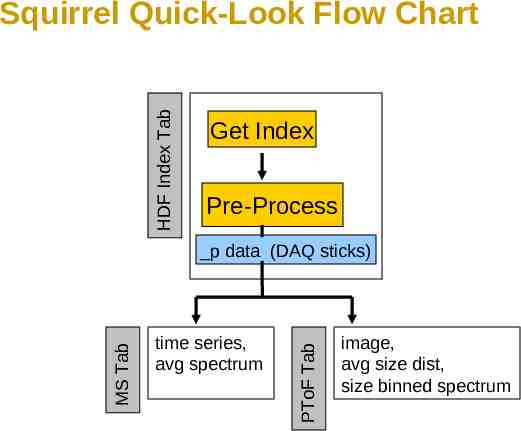
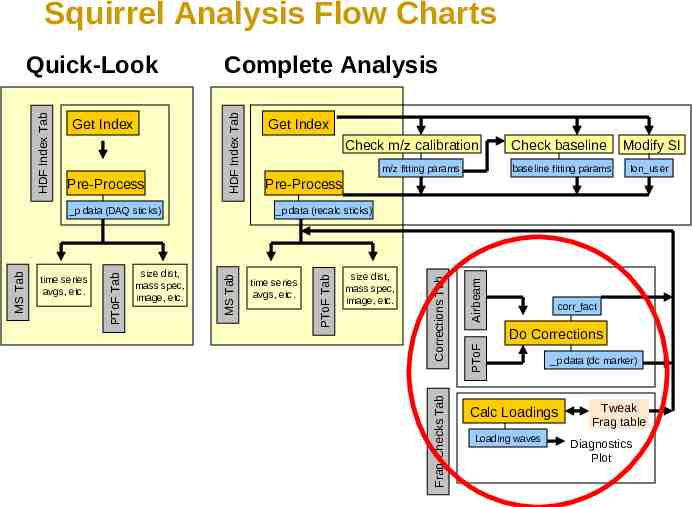
HDF Index Tab Squirrel Quick-Look Flow Chart Get Index Pre-Process time series, avg spectrum PToF Tab MS Tab p data (DAQ sticks) image, avg size dist, size binned spectrum
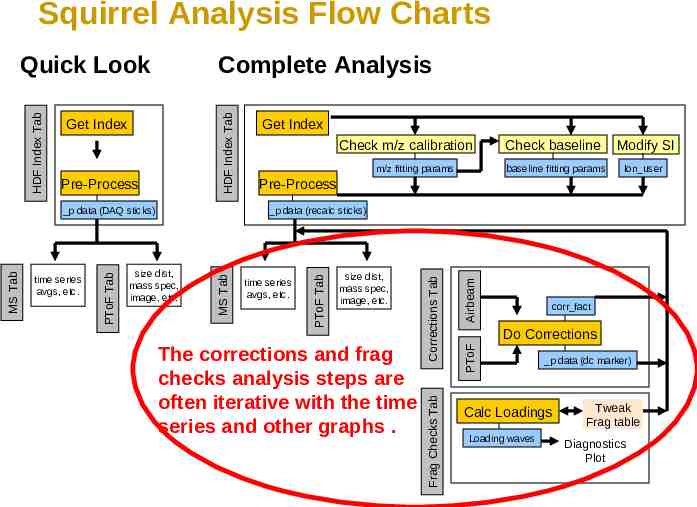
Squirrel Analysis Flow Charts baseline fitting params Modify SI Ion user Pre-Process Airbeam size dist, mass spec, image, etc. corr fact Do Corrections PToF time series avgs, etc. Corrections Tab size dist, mass spec, image, etc. m/z fitting params Check baseline p data (recalc sticks) MS Tab time series avgs, etc. PToF Tab MS Tab p data (DAQ sticks) Check m/z calibration Frag Checks Tab Pre-Process Get Index PToF Tab Get Index Complete Analysis HDF Index Tab HDF Index Tab Quick-Look p data (dc marker) Calc Loadings Loading waves Tweak Frag table Diagnostics Plot
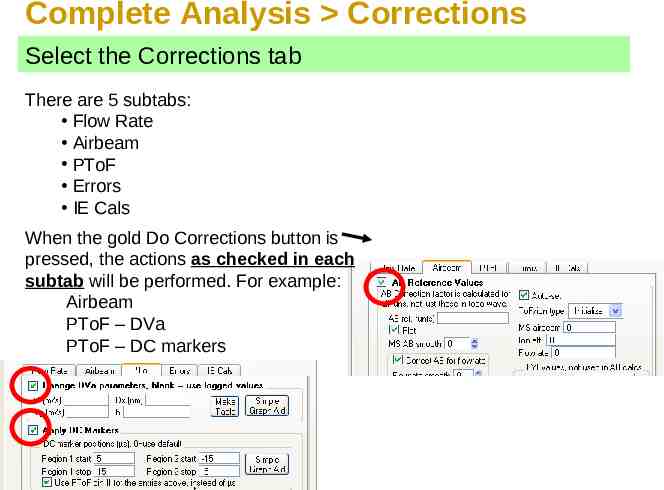
Complete Analysis Corrections Select the Corrections tab There are 5 subtabs: Flow Rate Airbeam PToF Errors IE Cals When the gold Do Corrections button is pressed, the actions as checked in each subtab will be performed. For example: Airbeam PToF – DVa PToF – DC markers
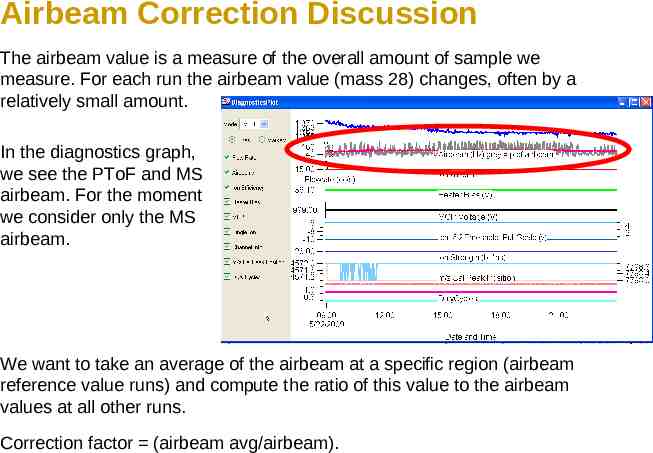
Airbeam Correction Discussion The airbeam value is a measure of the overall amount of sample we measure. For each run the airbeam value (mass 28) changes, often by a relatively small amount. In the diagnostics graph, we see the PToF and MS airbeam. For the moment we consider only the MS airbeam. We want to take an average of the airbeam at a specific region (airbeam reference value runs) and compute the ratio of this value to the airbeam values at all other runs. Correction factor (airbeam avg/airbeam).
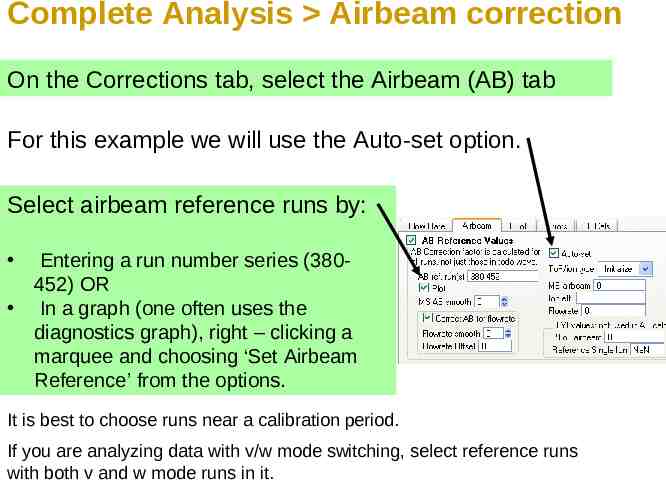
Complete Analysis Airbeam correction On the Corrections tab, select the Airbeam (AB) tab For this example we will use the Auto-set option. Select airbeam reference runs by: Entering a run number series (380452) OR In a graph (one often uses the diagnostics graph), right – clicking a marquee and choosing ‘Set Airbeam Reference’ from the options. It is best to choose runs near a calibration period. If you are analyzing data with v/w mode switching, select reference runs with both v and w mode runs in it.
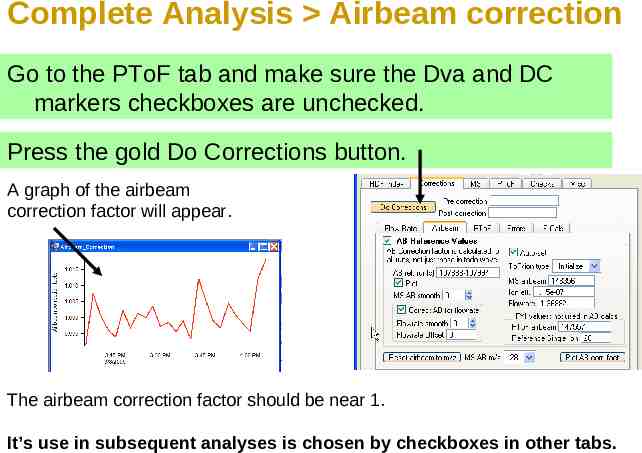
Complete Analysis Airbeam correction Go to the PToF tab and make sure the Dva and DC markers checkboxes are unchecked. Press the gold Do Corrections button. A graph of the airbeam correction factor will appear. The airbeam correction factor should be near 1. It’s use in subsequent analyses is chosen by checkboxes in other tabs.
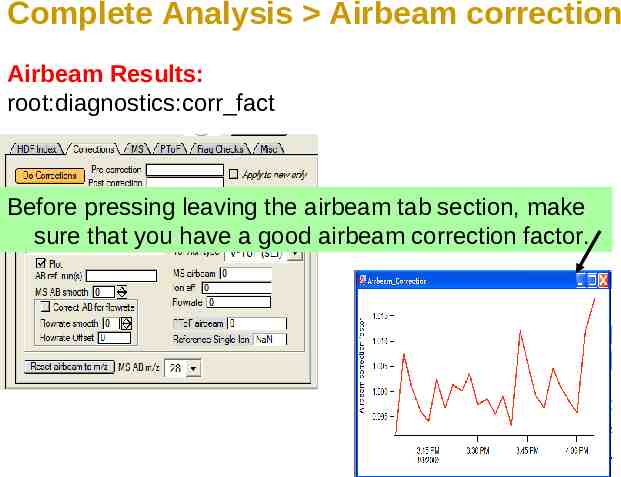
Complete Analysis Airbeam correction Airbeam Results: root:diagnostics:corr fact Before pressing leaving the airbeam tab section, make sure that you have a good airbeam correction factor.
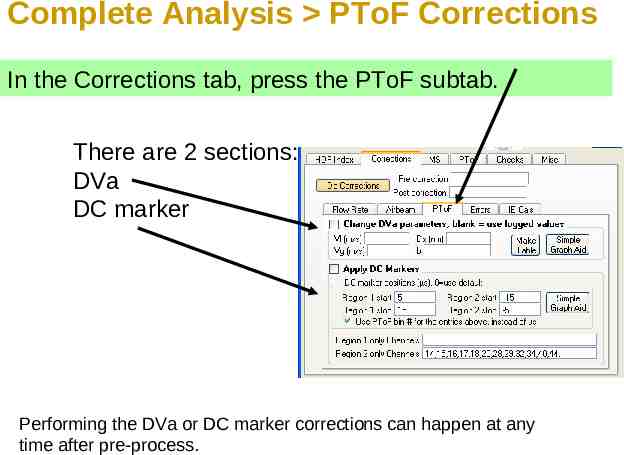
Complete Analysis PToF Corrections In the Corrections tab, press the PToF subtab. There are 2 sections: DVa DC marker Performing the DVa or DC marker corrections can happen at any time after pre-process.
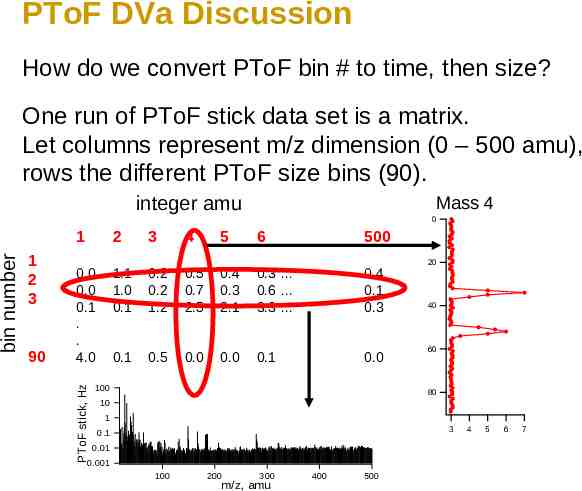
PToF DVa Discussion How do we convert PToF bin # to time, then size? One run of PToF stick data set is a matrix. Let columns represent m/z dimension (0 – 500 amu), rows the different PToF size bins (90). integer amu Mass 4 0 1 2 3 90 2 0.0 0.0 0.1 . . 4.0 PToF stick, Hz bin number 1 3 4 5 6 500 1.1 1.0 0.1 0.2 0.2 1.2 0.5 0.7 2.5 0.4 0.3 2.1 0.3 0.6 3.3 0.4 0.1 0.3 0.1 0.5 0.0 0.0 0.1 0.0 100 20 40 60 80 10 1 3 0.1 0.01 0.001 100 200 300 m/z, amu 400 500 4 5 6 7
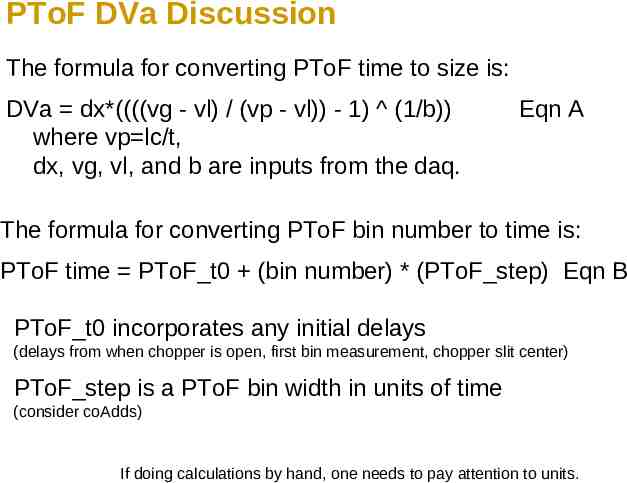
PToF DVa Discussion The formula for converting PToF time to size is: DVa dx*((((vg - vl) / (vp - vl)) - 1) (1/b)) where vp lc/t, dx, vg, vl, and b are inputs from the daq. Eqn A The formula for converting PToF bin number to time is: PToF time PToF t0 (bin number) * (PToF step) Eqn B PToF t0 incorporates any initial delays (delays from when chopper is open, first bin measurement, chopper slit center) PToF step is a PToF bin width in units of time (consider coAdds) If doing calculations by hand, one needs to pay attention to units.
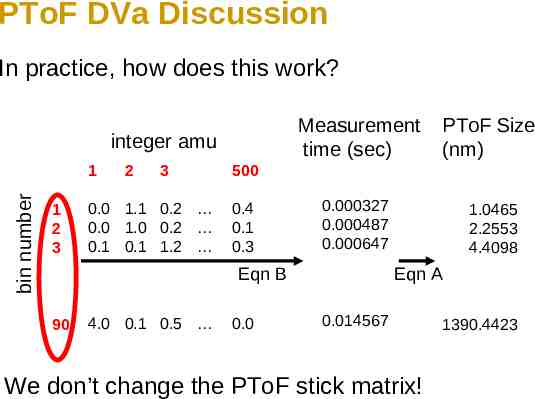
PToF DVa Discussion In practice, how does this work? integer amu bin number 1 1 2 3 2 3 0.0 1.1 0.2 0.0 1.0 0.2 0.1 0.1 1.2 Measurement time (sec) PToF Size (nm) 0.000327 0.000487 0.000647 1.0465 2.2553 4.4098 500 0.4 0.1 0.3 Eqn B 90 4.0 0.1 0.5 0.0 Eqn A 0.014567 We don’t change the PToF stick matrix! 1390.4423
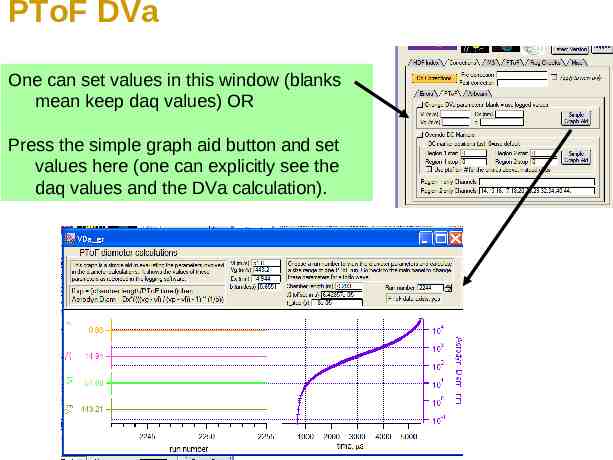
PToF DVa One can set values in this window (blanks mean keep daq values) OR Press the simple graph aid button and set values here (one can explicitly see the daq values and the DVa calculation).
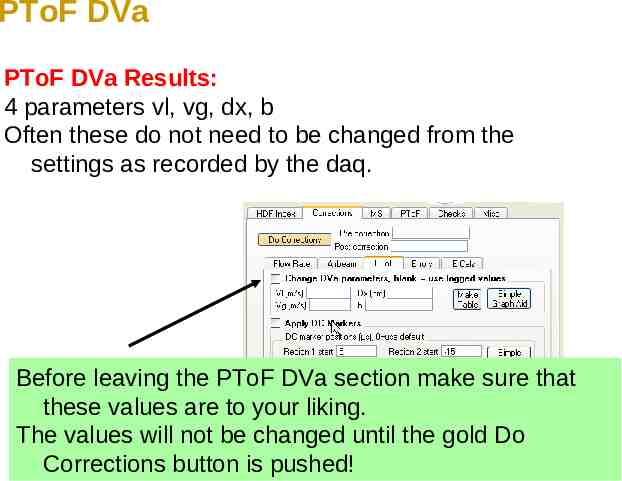
PToF DVa PToF DVa Results: 4 parameters vl, vg, dx, b Often these do not need to be changed from the settings as recorded by the daq. Before leaving the PToF DVa section make sure that these values are to your liking. The values will not be changed until the gold Do Corrections button is pushed!
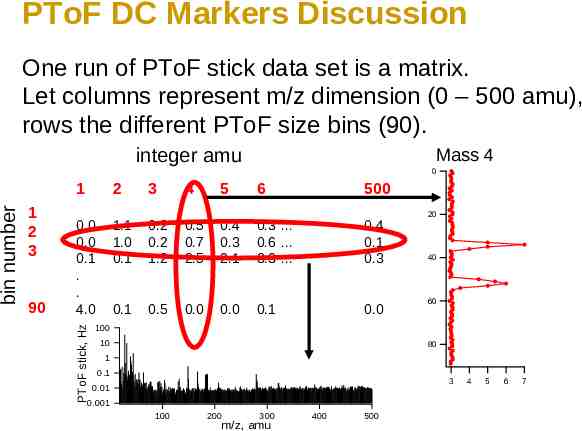
PToF DC Markers Discussion One run of PToF stick data set is a matrix. Let columns represent m/z dimension (0 – 500 amu), rows the different PToF size bins (90). integer amu Mass 4 0 1 2 3 90 2 0.0 0.0 0.1 . . 4.0 PToF stick, Hz bin number 1 3 4 5 6 500 1.1 1.0 0.1 0.2 0.2 1.2 0.5 0.7 2.5 0.4 0.3 2.1 0.3 0.6 3.3 0.4 0.1 0.3 0.1 0.5 0.0 0.0 0.1 0.0 20 40 60 100 10 80 1 0.1 3 0.01 0.001 100 200 300 m/z, amu 400 500 4 5 6 7
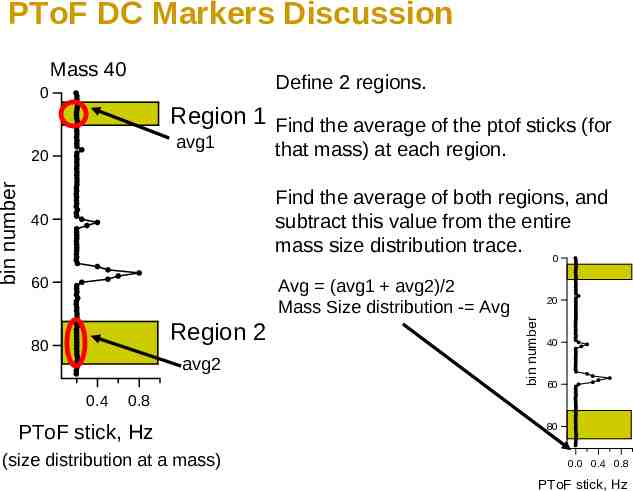
PToF DC Markers Discussion Mass 40 Define 2 regions. 0 Region 1 Find the average of the ptof sticks (for avg1 that mass) at each region. Find the average of both regions, and subtract this value from the entire mass size distribution trace. 0 40 60 Avg (avg1 avg2)/2 Mass Size distribution - Avg Region 2 80 avg2 0.4 20 bin number bin number 20 40 60 0.8 PToF stick, Hz (size distribution at a mass) 80 0.0 0.4 0.8 PToF stick, Hz
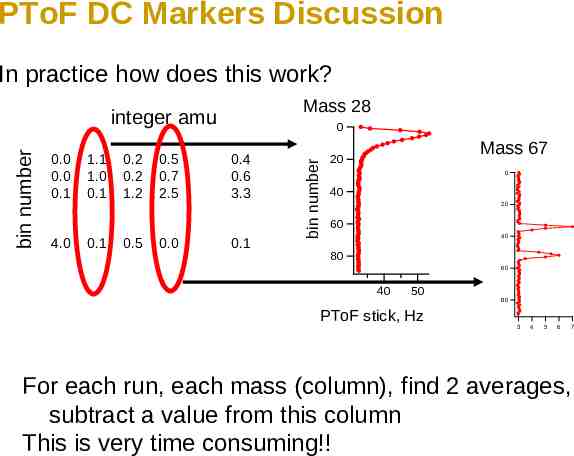
PToF DC Markers Discussion In practice how does this work? Mass 28 0.0 0.0 0.1 4.0 1.1 1.0 0.1 0.1 0.2 0.2 1.2 0.5 0.5 0.7 2.5 0.0 0 0.4 0.6 3.3 0.1 bin number bin number integer amu Mass 67 20 0 40 20 60 40 80 60 40 50 PToF stick, Hz 80 3 4 5 6 7 For each run, each mass (column), find 2 averages, subtract a value from this column This is very time consuming!!
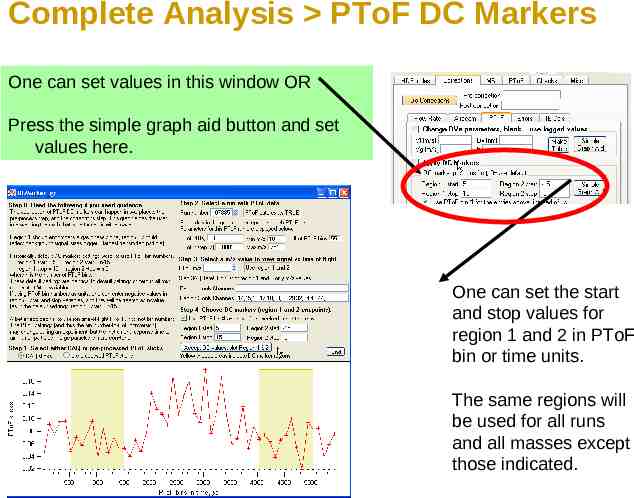
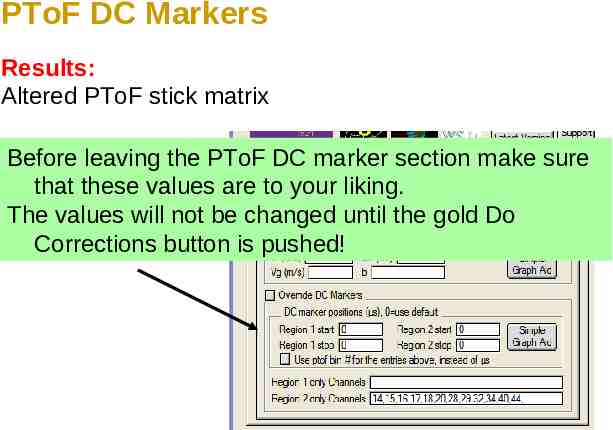
Complete Analysis PToF DC Markers One can set values in this window OR Press the simple graph aid button and set values here. One can set the start and stop values for region 1 and 2 in PToF bin or time units. The same regions will be used for all runs and all masses except those indicated.
PToF DC Markers Results: Altered PToF stick matrix Before leaving the PToF DC marker section make sure that these values are to your liking. The values will not be changed until the gold Do Corrections button is pushed!
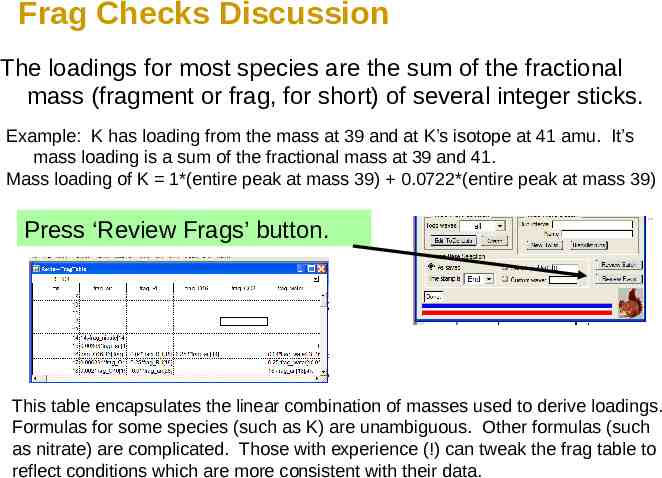
Frag Checks Discussion The loadings for most species are the sum of the fractional mass (fragment or frag, for short) of several integer sticks. Example: K has loading from the mass at 39 and at K’s isotope at 41 amu. It’s mass loading is a sum of the fractional mass at 39 and 41. Mass loading of K 1*(entire peak at mass 39) 0.0722*(entire peak at mass 39) Press ‘Review Frags’ button. This table encapsulates the linear combination of masses used to derive loadings. Formulas for some species (such as K) are unambiguous. Other formulas (such as nitrate) are complicated. Those with experience (!) can tweak the frag table to reflect conditions which are more consistent with their data.
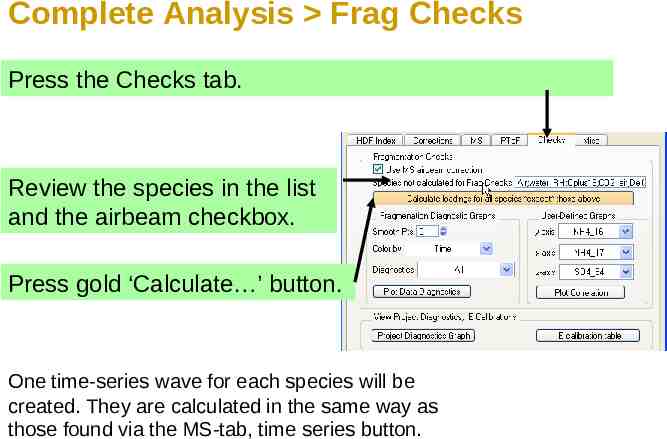
Complete Analysis Frag Checks Press the Checks tab. Review the species in the list and the airbeam checkbox. Press gold ‘Calculate ’ button. One time-series wave for each species will be created. They are calculated in the same way as those found via the MS-tab, time series button.
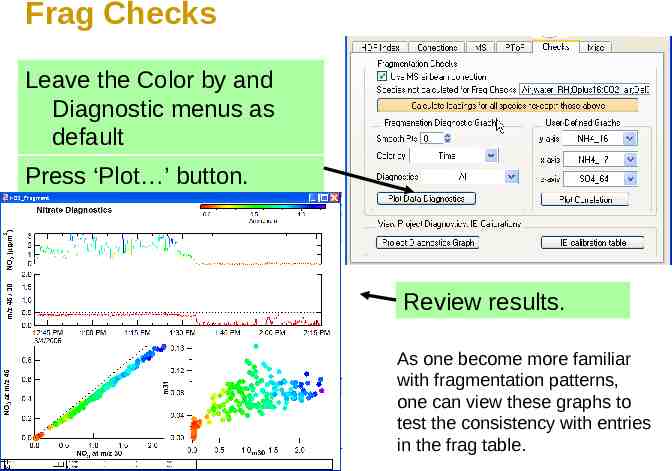
Frag Checks Leave the Color by and Diagnostic menus as default Press ‘Plot ’ button. Review results. As one become more familiar with fragmentation patterns, one can view these graphs to test the consistency with entries in the frag table.
Squirrel Analysis Flow Charts Complete Analysis HDF Index Tab Get Index Pre-Process Check m/z calibration m/z fitting params Check baseline baseline fitting params Modify SI Ion user Pre-Process The corrections and frag checks analysis steps are often iterative with the time series and other graphs . Airbeam size dist, mass spec, image, etc. corr fact Do Corrections PToF time series avgs, etc. Frag Checks Tab size dist, mass spec, image, etc. Corrections Tab p data (recalc sticks) MS Tab time series avgs, etc. PToF Tab MS Tab p data (DAQ sticks) Get Index PToF Tab HDF Index Tab Quick Look p data (dc marker) Calc Loadings Loading waves Tweak Frag table Diagnostics Plot