Six Sigma In Healthcare Panel Workshop For The Quality Colloquium


62 Slides1.60 MB
Six Sigma In Healthcare Panel Workshop For The Quality Colloquium at Harvard University August 26, 2003 Don Walker - McKesson Corporation Narendra Kini – M.D., GE Medical Systems AGI Denise Fiore – Yale-New Haven Hospital Agillist Group Inc Don Redinius – Agillist Group, Inc.
Discussion Topics Introductions and brief overview of Six Sigma Methodology Application of Six Sigma – Clinical setting Application of Six Sigma – Transactional setting Deploying Six Sigma – Lessons learned
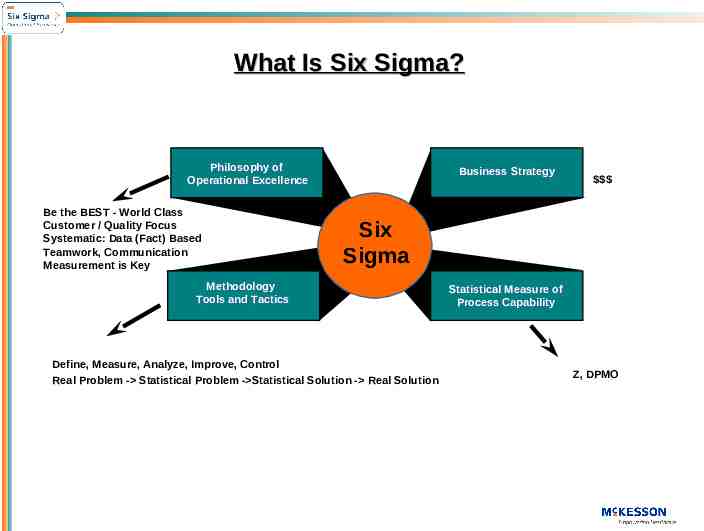
What Is Six Sigma? Philosophy of Operational Excellence Be the BEST - World Class Customer / Quality Focus Systematic: Data (Fact) Based Teamwork, Communication Measurement is Key Business Strategy Six Sigma Methodology Tools and Tactics Define, Measure, Analyze, Improve, Control Real Problem - Statistical Problem - Statistical Solution - Real Solution Statistical Measure of Process Capability Z, DPMO
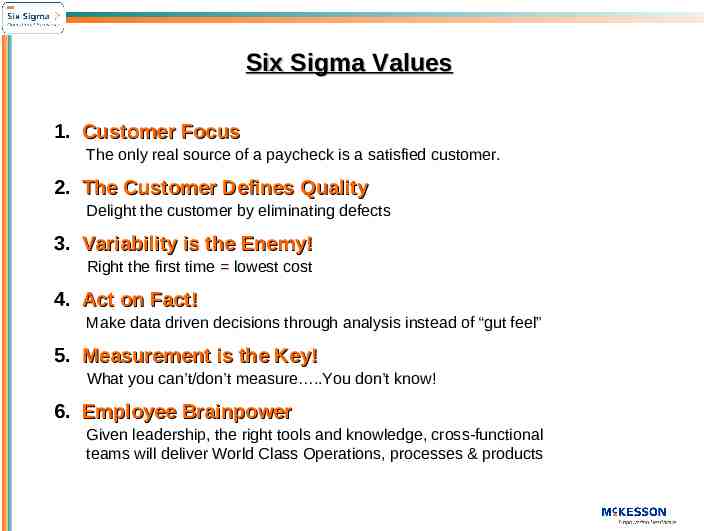
Six Sigma Values 1. Customer Focus The only real source of a paycheck is a satisfied customer. 2. The Customer Defines Quality Delight the customer by eliminating defects 3. Variability is the Enemy! Right the first time lowest cost 4. Act on Fact! Make data driven decisions through analysis instead of “gut feel” 5. Measurement is the Key! What you can’t/don’t measure .You don’t know! 6. Employee Brainpower Given leadership, the right tools and knowledge, cross-functional teams will deliver World Class Operations, processes & products
What It Is Not A cult Flavor of the month program Intended to replace management decision making Overnight fix to process defects Large scale process redesign tool
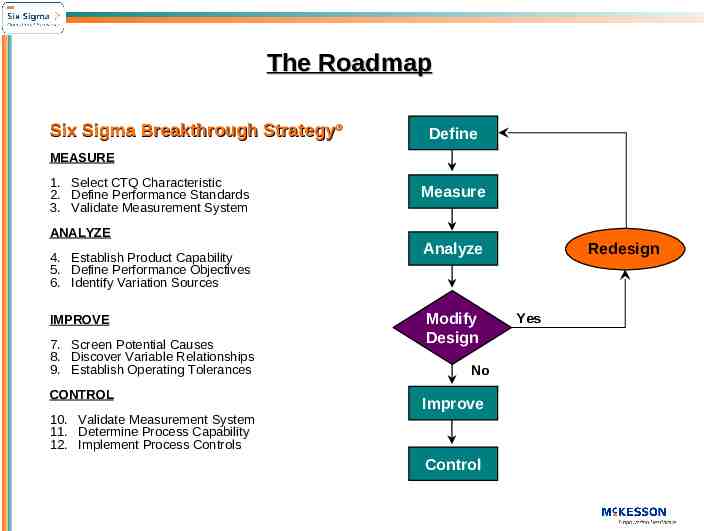
The Roadmap Six Sigma Breakthrough Strategy Define MEASURE 1. Select CTQ Characteristic 2. Define Performance Standards 3. Validate Measurement System Measure ANALYZE 4. Establish Product Capability 5. Define Performance Objectives 6. Identify Variation Sources IMPROVE 7. Screen Potential Causes 8. Discover Variable Relationships 9. Establish Operating Tolerances CONTROL 10. Validate Measurement System 11. Determine Process Capability 12. Implement Process Controls Redesign Analyze Modify Design No Improve Control Yes
Yale-New Haven Hospital Six Sigma Initiative The Quality Colloquium At Harvard University: Six Sigma in Healthcare August 26, 2003 Speaker: Denise J. Fiore
Presentation Outline Yale-New Haven Hospital Six Sigma Initiative Overview Project Case Studies
Six Sigma Initiative Overview
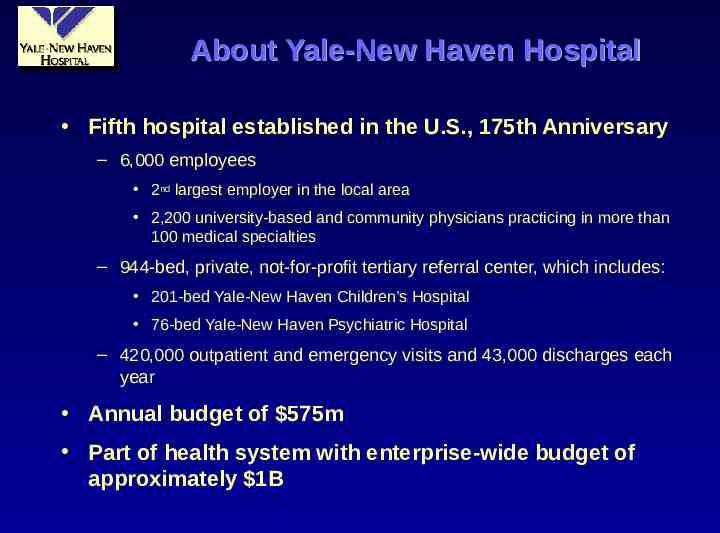
About Yale-New Haven Hospital Fifth hospital established in the U.S., 175th Anniversary – 6,000 employees 2nd largest employer in the local area 2,200 university-based and community physicians practicing in more than 100 medical specialties – 944-bed, private, not-for-profit tertiary referral center, which includes: 201-bed Yale-New Haven Children’s Hospital 76-bed Yale-New Haven Psychiatric Hospital – 420,000 outpatient and emergency visits and 43,000 discharges each year Annual budget of 575m Part of health system with enterprise-wide budget of approximately 1B
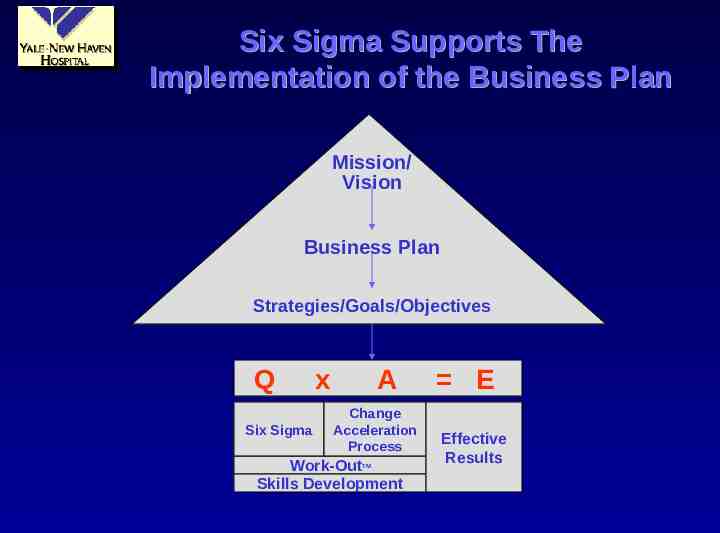
Six Sigma Supports The Implementation of the Business Plan Mission/ Vision Business Plan Strategies/Goals/Objectives Q Six Sigma x A Change Acceleration Process Work-Out Skills Development TM E Effective Results
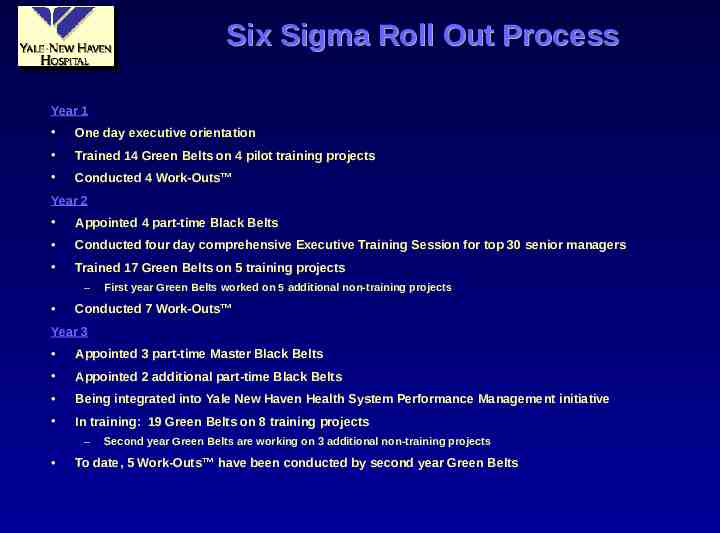
Six Sigma Roll Out Process Year 1 One day executive orientation Trained 14 Green Belts on 4 pilot training projects Conducted 4 Work-Outs Year 2 Appointed 4 part-time Black Belts Conducted four day comprehensive Executive Training Session for top 30 senior managers Trained 17 Green Belts on 5 training projects – First year Green Belts worked on 5 additional non-training projects Conducted 7 Work-Outs Year 3 Appointed 3 part-time Master Black Belts Appointed 2 additional part-time Black Belts Being integrated into Yale New Haven Health System Performance Management initiative In training: 19 Green Belts on 8 training projects – Second year Green Belts are working on 3 additional non-training projects To date, 5 Work-Outs have been conducted by second year Green Belts
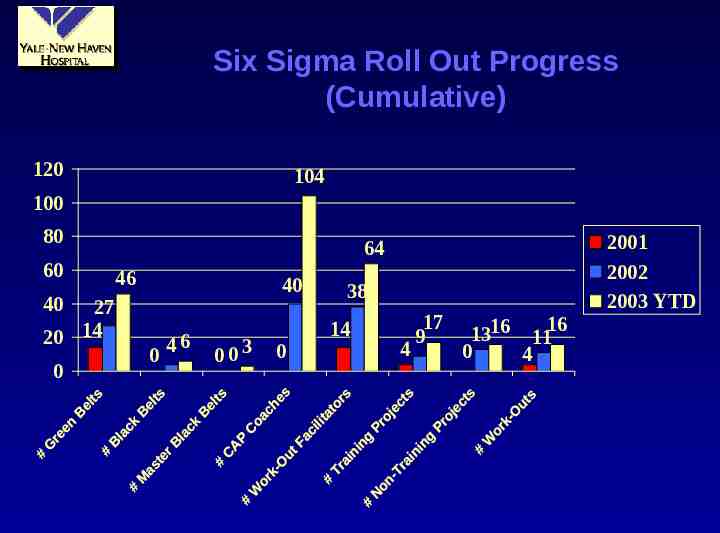
Six Sigma Roll Out Progress (Cumulative) 120 104 100 80 60 64 46 40 40 27 20 14 0 6 4 0 003 0 38 14 4 17 9 1316 1116 0 4 2001 2002 2003 YTD
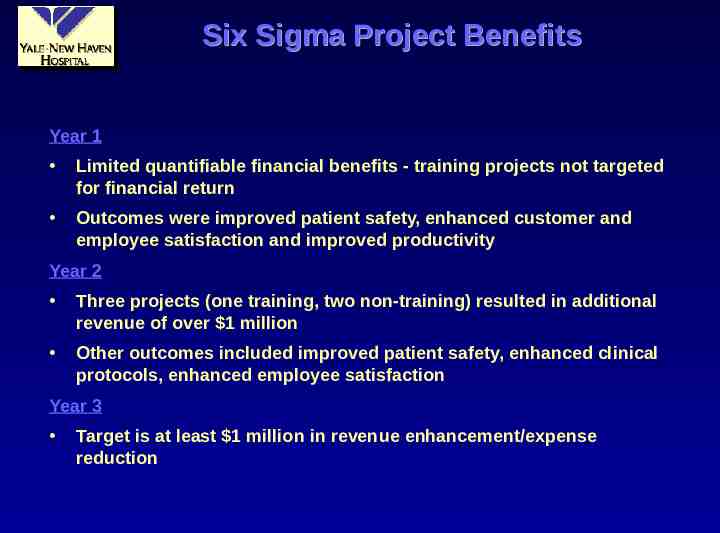
Six Sigma Project Benefits Year 1 Limited quantifiable financial benefits - training projects not targeted for financial return Outcomes were improved patient safety, enhanced customer and employee satisfaction and improved productivity Year 2 Three projects (one training, two non-training) resulted in additional revenue of over 1 million Other outcomes included improved patient safety, enhanced clinical protocols, enhanced employee satisfaction Year 3 Target is at least 1 million in revenue enhancement/expense reduction
Project Case Studies
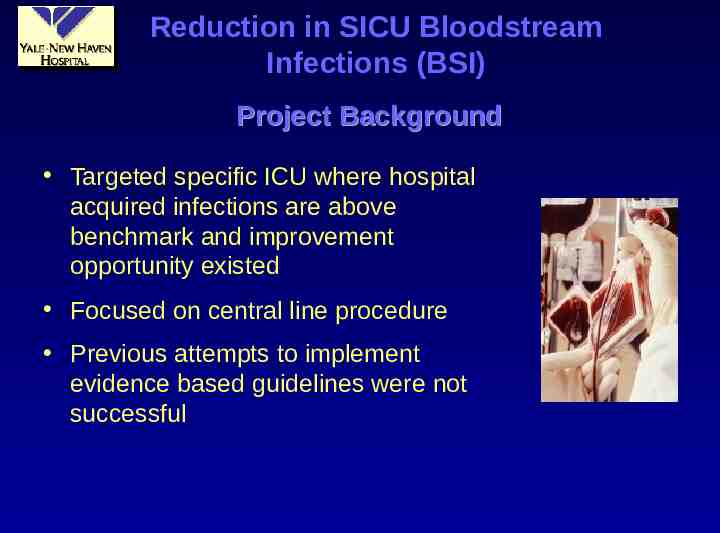
Reduction in SICU Bloodstream Infections (BSI) Project Background Targeted specific ICU where hospital acquired infections are above benchmark and improvement opportunity existed Focused on central line procedure Previous attempts to implement evidence based guidelines were not successful
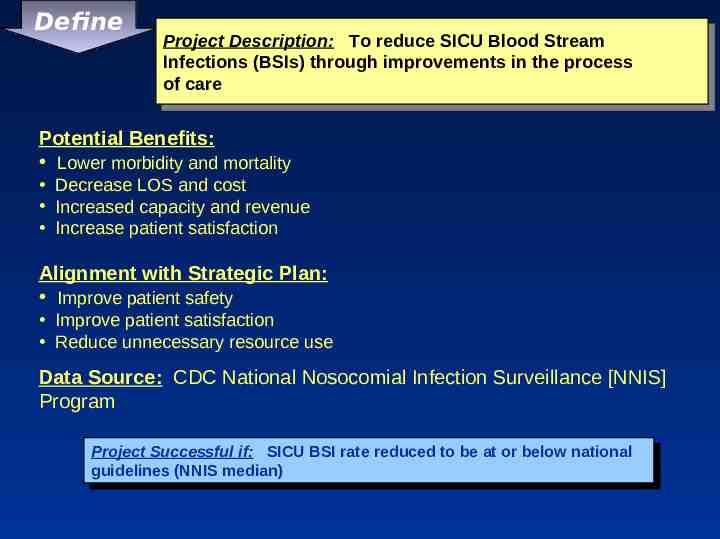
Define Project ProjectDescription: Description: To Toreduce reduceSICU SICUBlood BloodStream Stream Infections Infections(BSIs) (BSIs)through throughimprovements improvementsin inthe theprocess process of ofcare care Potential Benefits: Lower morbidity and mortality Decrease LOS and cost Increased capacity and revenue Increase patient satisfaction Alignment with Strategic Plan: Improve patient safety Improve patient satisfaction Reduce unnecessary resource use Data Source: CDC National Nosocomial Infection Surveillance [NNIS] Program Project ProjectSuccessful Successfulif: if: SICU SICUBSI BSIrate ratereduced reducedto tobe beat ator orbelow belownational national guidelines guidelines(NNIS (NNISmedian) median)
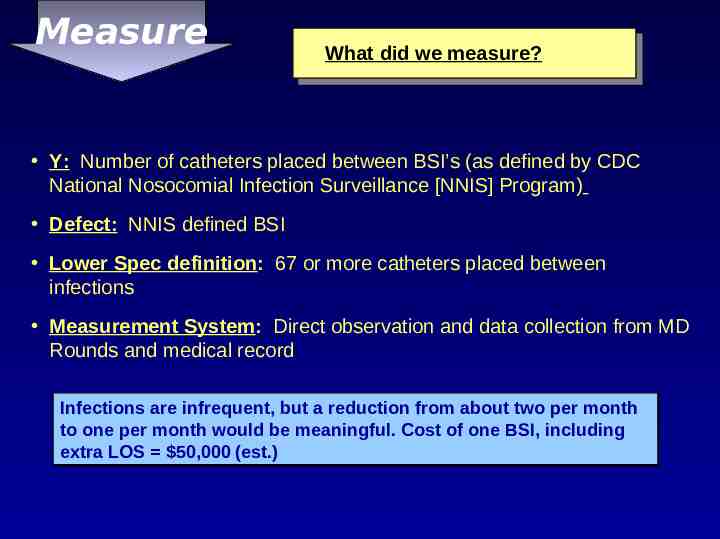
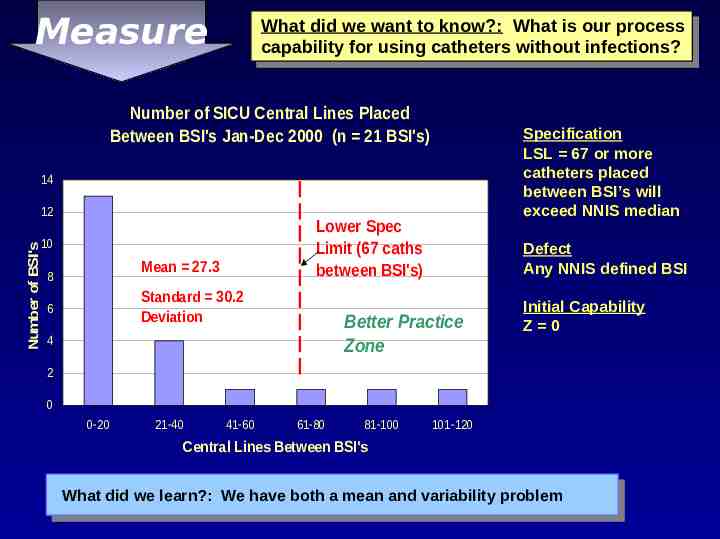
Measure What did we measure? Y: Number of catheters placed between BSI’s (as defined by CDC National Nosocomial Infection Surveillance [NNIS] Program) Defect: NNIS defined BSI Lower Spec definition: 67 or more catheters placed between infections Measurement System: Direct observation and data collection from MD Rounds and medical record Infections are infrequent, but a reduction from about two per month to one per month would be meaningful. Cost of one BSI, including extra LOS 50,000 (est.)
Measure What did we want to know?: What is our process capability for using catheters without infections? Number of SICU Central Lines Placed Between BSI's Jan-Dec 2000 (n 21 BSI's) Specification LSL 67 or more catheters placed between BSI’s will exceed NNIS median 14 Number of BSI's 12 Lower Spec Limit (67 caths between BSI's) 10 Mean 27.3 8 Standard 30.2 Deviation 6 Defect Any NNIS defined BSI Better Practice Zone 4 Initial Capability Z 0 2 0 0-20 21-40 41-60 61-80 81-100 101-120 Central Lines Between BSI's What did we learn?: We have both a mean and variability problem
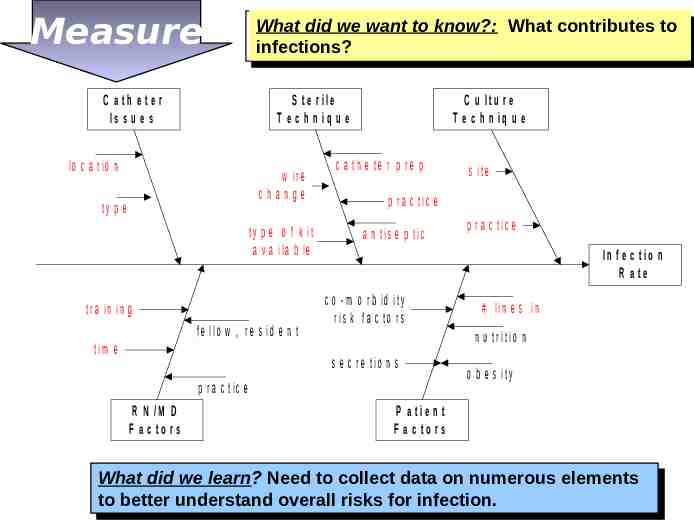
Measure C a th e te r Is s u e s What did we want to know?: What contributes to infections? S te r ile T e c h n iq u e lo c a tio n w ir e change ty p e ty p e o f k it a v a ila b le tr a in in g fe llo w , r e s id e n t tim e C u ltu r e T e c h n iq u e c a th e te r p re p p r a c tic e a n tis e p tic p r a c tic e In f e c t io n R a te c o - m o r b id ity r is k fa c to r s # lin e s in n u tr itio n s e c r e tio n s p r a c tic e R N /M D F a c to rs s ite o b e s ity P a tie n t F a c to rs What Whatdid didwe welearn? learn?Need Needto tocollect collectdata dataon onnumerous numerouselements elements to tobetter betterunderstand understandoverall overallrisks risksfor forinfection. infection.
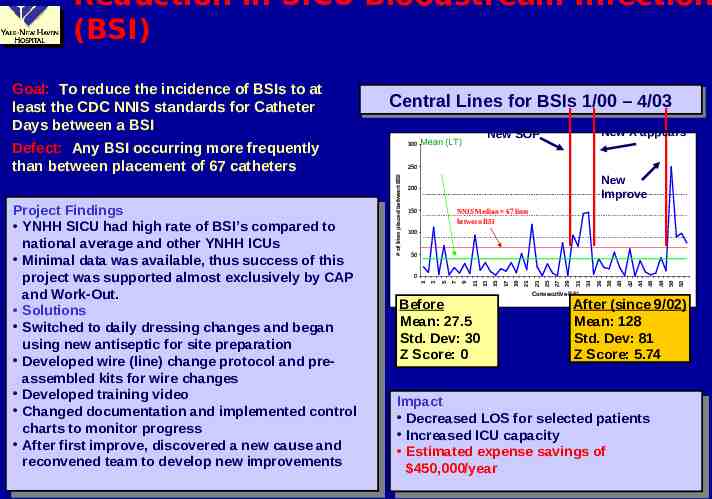
Reduction in SICU Bloodstream Infection (BSI) New X appears New SOP Mean (LT) 250 New Improve 200 NNIS Median 67 lines between BSI 150 100 50 Before Mean: 27.5 Std. Dev: 30 Z Score: 0 Consecutive BSI 52 50 48 46 44 42 40 38 36 34 31 29 27 25 23 21 19 17 15 13 9 11 7 5 0 3 Project ProjectFindings Findings YNHH SICU YNHH SICUhad hadhigh highrate rateof ofBSI’s BSI’scompared comparedto to national average and other YNHH ICUs national average and other YNHH ICUs Minimal Minimaldata datawas wasavailable, available,thus thussuccess successof ofthis this project was supported almost exclusively by CAP project was supported almost exclusively by CAP and andWork-Out. Work-Out. Solutions Solutions Switched Switchedto todaily dailydressing dressingchanges changesand andbegan began using new antiseptic for site preparation using new antiseptic for site preparation Developed Developedwire wire(line) (line)change changeprotocol protocoland andprepreassembled kits for wire changes assembled kits for wire changes Developed Developedtraining trainingvideo video Changed documentation Changed documentationand andimplemented implementedcontrol control charts to monitor progress charts to monitor progress After Afterfirst firstimprove, improve,discovered discoveredaanew newcause causeand and reconvened team to develop new improvements reconvened team to develop new improvements 300 1 Defect: Any BSI occurring more frequently than between placement of 67 catheters Central Central Lines Lines for for BSIs BSIs 1/00 1/00 –– 4/03 4/03 # of lines placed between BSI Goal: To reduce the incidence of BSIs to at least the CDC NNIS standards for Catheter Days between a BSI. After (since 9/02) Mean: 128 Std. Dev: 81 Z Score: 5.74 Impact Impact Decreased DecreasedLOS LOSfor forselected selectedpatients patients Increased ICU capacity Increased ICU capacity Estimated Estimatedexpense expensesavings savingsof of 450,000/year 450,000/year
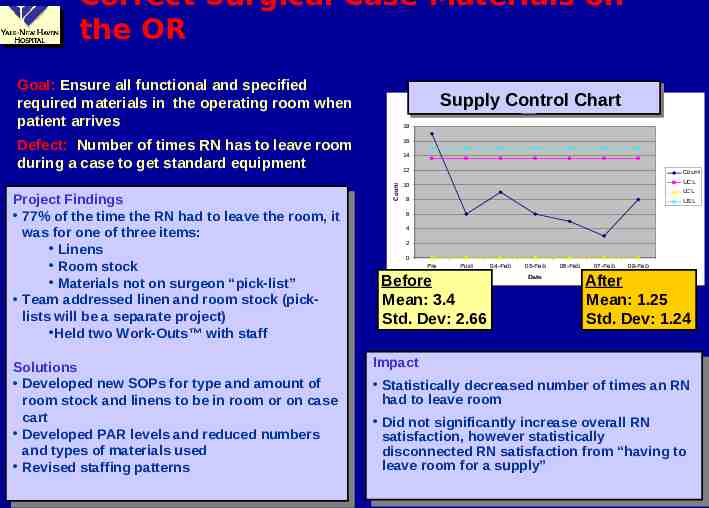
Correct Surgical Case Materials on the OR Goal: Ensure all functional and specified required materials in the operating room when patient arrives Supply Control Chart Supply Control Chart 18 Defect: Number of times RN has to leave room during a case to get standard equipment. Solutions Solutions Developed Developednew newSOPs SOPsfor fortype typeand andamount amountof of room stock and linens to be in room or on case room stock and linens to be in room or on case cart cart Developed DevelopedPAR PARlevels levelsand andreduced reducednumbers numbers and types of materials used and types of materials used Revised Revisedstaffing staffingpatterns patterns 14 Count Project ProjectFindings Findings 77% of 77% ofthe thetime timethe theRN RNhad hadto toleave leavethe theroom, room,itit was wasfor forone oneof ofthree threeitems: items: Linens Linens Room Roomstock stock Materials Materialsnot noton onsurgeon surgeon“pick-list” “pick-list” Team addressed linen and room Team addressed linen and roomstock stock(pick(picklists will be a separate project) lists will be a separate project) Held Heldtwo twoWork-Outs Work-Outs with withstaff staff 16 12 Count 10 UCL LCL 8 USL 6 4 2 0 Pre Post Before Mean: 3.4 Std. Dev: 2.66 04-Feb 05-Feb Date 06-Feb 07-Feb 08-Feb After Mean: 1.25 Std. Dev: 1.24 Impact Impact Statistically Statisticallydecreased decreasednumber numberof oftimes timesan anRN RN had to leave room had to leave room Did Didnot notsignificantly significantlyincrease increaseoverall overallRN RN satisfaction, satisfaction,however howeverstatistically statistically disconnected disconnectedRN RNsatisfaction satisfactionfrom from“having “havingto to leave leaveroom roomfor foraasupply” supply”
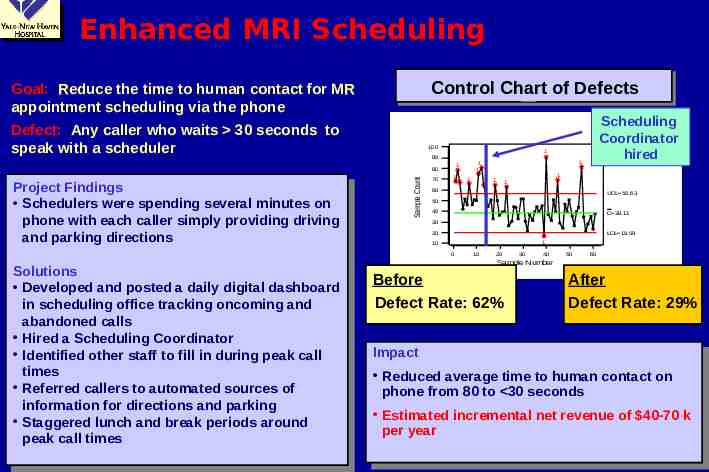
Enhanced MRI Scheduling Control Chart of Defects Goal: Reduce the time to human contact for MR appointment scheduling via the phone Defect:. Any caller who waits 30 seconds to speak with a scheduler 100 1 90 Sample Count 70 11 1 1 1 1 1 60 UCL 56.63 50 40 C 38.11 30 20 LCL 19.59 1 10 0 Solutions Solutions Developed Developedand andposted postedaadaily dailydigital digitaldashboard dashboard ininscheduling office tracking oncoming scheduling office tracking oncomingand and abandoned calls abandoned calls Hired HiredaaScheduling SchedulingCoordinator Coordinator Identified other staff Identified other staffto tofill fillininduring duringpeak peakcall call times times Referred Referredcallers callersto toautomated automatedsources sourcesof of information for directions and parking information for directions and parking Staggered Staggeredlunch lunchand andbreak breakperiods periodsaround around peak call times peak call times 1 1 1 1 80 Project ProjectFindings Findings Schedulers Schedulerswere werespending spendingseveral severalminutes minuteson on phone with each caller simply providing driving phone with each caller simply providing driving and andparking parkingdirections directions Scheduling Coordinator hired 10 20 30 40 50 60 Sample Number Before Defect Rate: 62% After Defect Rate: 29% Impact Impact Reduced Reducedaverage averagetime timeto tohuman humancontact contacton on phone phonefrom from80 80to to 30 30seconds seconds Estimated Estimatedincremental incrementalnet netrevenue revenueof of 40-70 40-70kk per peryear year
Examples of Work-Outs at YNHH Increase influenza and pneumonia vaccination rates for patients over 60 Reduce the amount of time required by managers to utilize the time and attendance system Identify priorities in and develop a defined structure and process for bed management Ensure accurate charge capture for cardiac AICDs Reduce variation in practice in the assessment for and use of “patient sitters” Develop a plan for the Development Office to become a central gifts processor Ensure accurate room stocking in the OR Identify enhancements to performance management process
The Harvard Colloquim Workshop on Six Sigma August 26, 2003 A Clinical Case Study: Improving Implant Rates at an IVF Clinic Narendra Kini MD, MHA GE Health Leadership Institute
The IVF CYCLE IVF In Vitro Fertilization
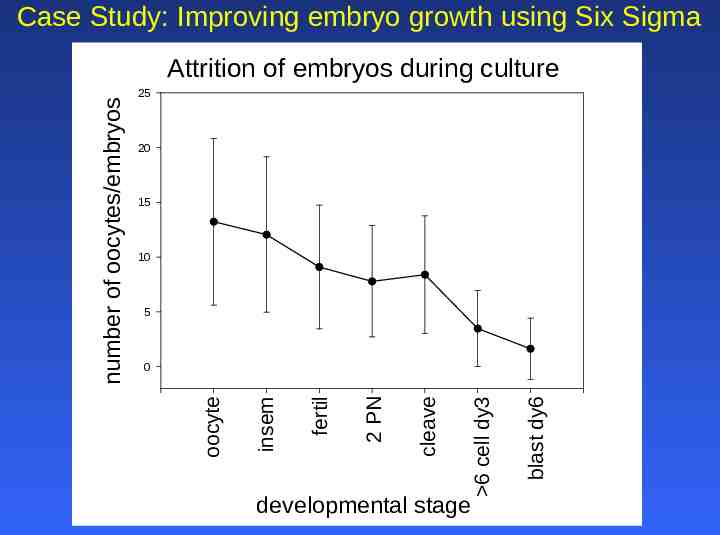
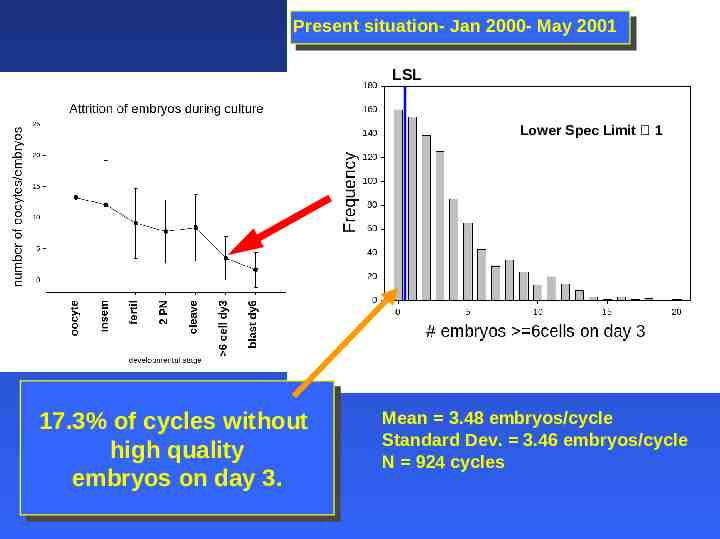
Case Study: Improving embryo growth using Six Sigma 25 20 15 10 5 developmental stage blast dy6 6 cell dy3 cleave 2 PN fertil insem 0 oocyte number of oocytes/embryos Attrition of embryos during culture
Present situation- Jan 2000- May 2001 LSL Lower Spec Limit 1 17.3% 17.3%of of cycles cycleswithout without high highquality quality embryos embryoson onday day3. 3. Mean 3.48 embryos/cycle Standard Dev. 3.46 embryos/cycle N 924 cycles
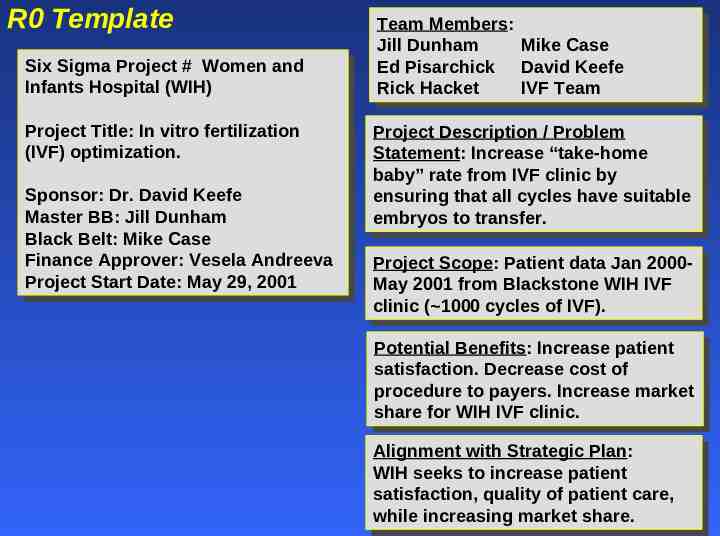
R0 Template Six SixSigma SigmaProject Project## Women Womenand and Infants InfantsHospital Hospital(WIH) (WIH) Project ProjectTitle: Title:In Invitro vitrofertilization fertilization (IVF) (IVF)optimization. optimization. Sponsor: Sponsor:Dr. Dr.David DavidKeefe Keefe Master MasterBB: BB:Jill JillDunham Dunham Black BlackBelt: Belt:Mike MikeCase Case Finance FinanceApprover: Approver:Vesela VeselaAndreeva Andreeva Project Start Date: May 29, 2001 Project Start Date: May 29, 2001 Team TeamMembers: Members: Jill Mike JillDunham Dunham MikeCase Case Ed EdPisarchick Pisarchick David DavidKeefe Keefe Rick IVF RickHacket Hacket IVFTeam Team Project ProjectDescription Description/ /Problem Problem Statement: Statement:Increase Increase“take-home “take-home baby” baby”rate ratefrom fromIVF IVFclinic clinicby by ensuring ensuringthat thatall allcycles cycleshave havesuitable suitable embryos to transfer. embryos to transfer. Project ProjectScope: Scope:Patient Patientdata dataJan Jan20002000May May2001 2001from fromBlackstone BlackstoneWIH WIHIVF IVF clinic clinic( 1000 ( 1000cycles cyclesof ofIVF). IVF). Potential PotentialBenefits: Benefits:Increase Increasepatient patient satisfaction. satisfaction.Decrease Decreasecost costof of procedure procedureto topayers. payers.Increase Increasemarket market share sharefor forWIH WIHIVF IVFclinic. clinic. Alignment Alignmentwith withStrategic StrategicPlan: Plan: WIH WIHseeks seeksto toincrease increasepatient patient satisfaction, satisfaction,quality qualityof ofpatient patientcare, care, while whileincreasing increasingmarket marketshare. share.
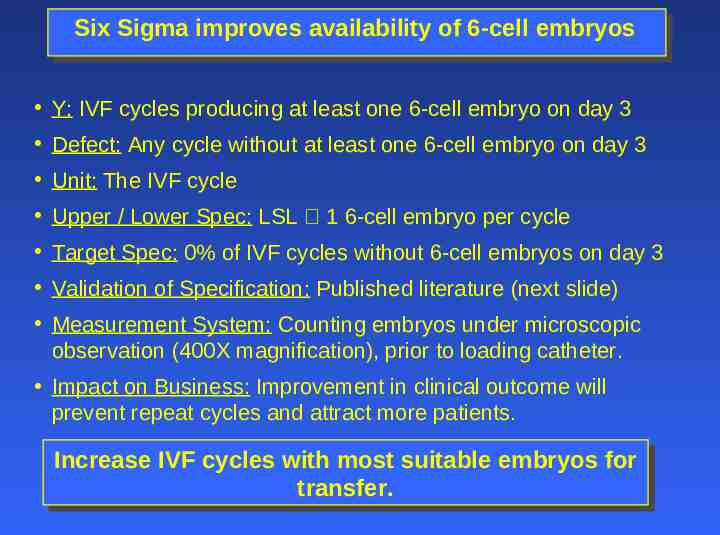
Six Sigma improves availability of 6-cell embryos Y: IVF cycles producing at least one 6-cell embryo on day 3 Defect: Any cycle without at least one 6-cell embryo on day 3 Unit: The IVF cycle Upper / Lower Spec: LSL 1 6-cell embryo per cycle Target Spec: 0% of IVF cycles without 6-cell embryos on day 3 Validation of Specification: Published literature (next slide) Measurement System: Counting embryos under microscopic observation (400X magnification), prior to loading catheter. Impact on Business: Improvement in clinical outcome will prevent repeat cycles and attract more patients. Increase IncreaseIVF IVFcycles cycleswith withmost mostsuitable suitableembryos embryosfor for transfer. transfer.
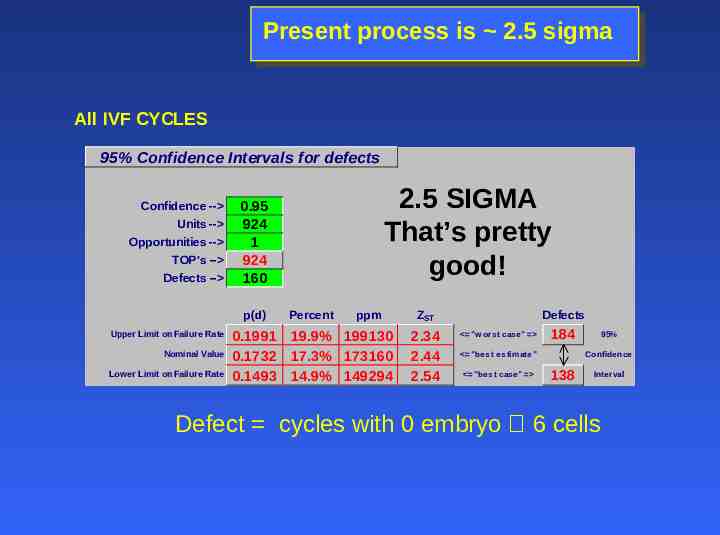
Present process is 2.5 sigma All IVF CYCLES 95% Confidence Intervals for defects Confidence -- Units -- Opportunities -- TOP's -- Defects -- p(d) Upper Limit on Failure Rate Nominal Value Lower Limit on Failure Rate 2.5 SIGMA That’s pretty good! 0.95 924 1 924 160 Percent ppm 0.1991 19.9% 199130 0.1732 17.3% 173160 0.1493 14.9% 149294 ZST 2.34 2.44 2.54 Defects "w orst case" 184 "best estimate" "best case" 95% Confidence 138 Interval Defect cycles with 0 embryo 6 cells
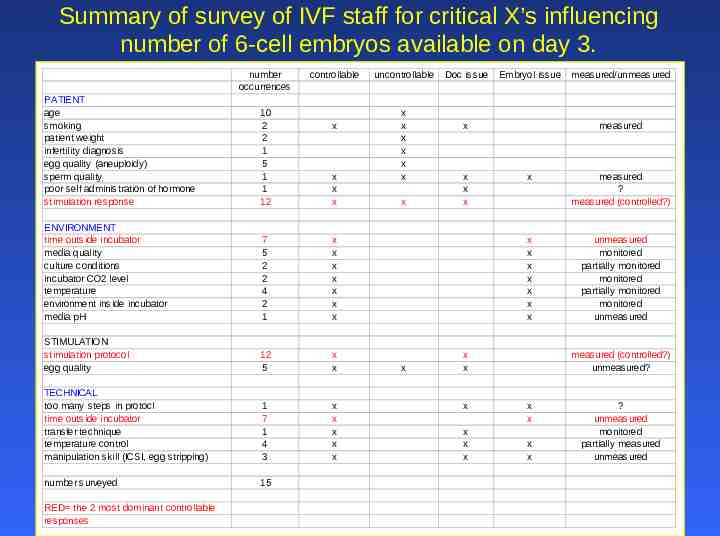
Summary of survey of IVF staff for critical X’s influencing number of 6-cell embryos available on day 3. number occurrences controllable PATIENT age smoking patient weight infertility diagnosis egg quality (aneuploidy) sperm quality poor self administration of hormone stimulation response 10 2 2 1 5 1 1 12 ENVIRONMENT time outside incubator media quality culture conditions incubator CO2 level temperature environment inside incubator media pH 7 5 2 2 4 2 1 x x x x x x x STIMULATION stimulation protocol egg quality 12 5 x x TECHNICAL too many steps in protocl time outside incubator transfer technique temperature control manipulation skill (ICSI, egg stripping) 1 7 1 4 3 x x x x x number surveyed 15 RED the 2 most dominant controllable responses x x x x uncontrollable x x x x x x x x Doc issue Embryol issue x x x x measured x measured ? measured (controlled?) x x x x x x x unmeasured monitored partially monitored monitored partially monitored monitored unmeasured x x x x x x measured/unmeasured measured (controlled?) unmeasured? x x x x ? unmeasured monitored partially measured unmeasured
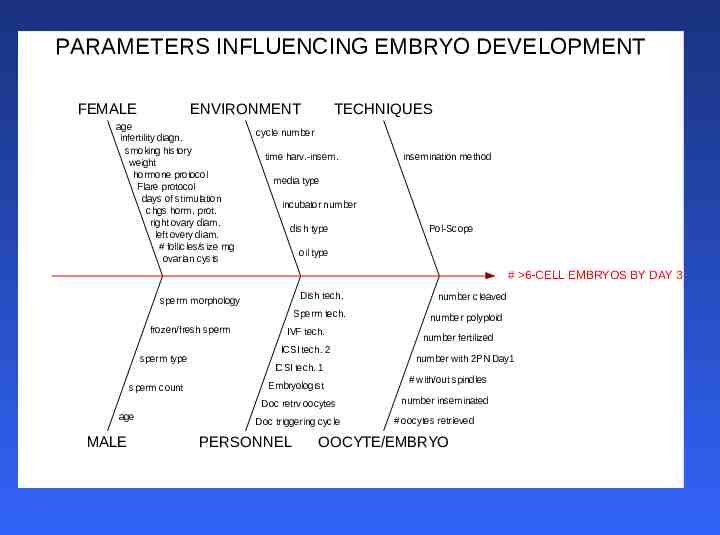
PARAMETERS INFLUENCING EMBRYO DEVELOPMENT FEMALE ENVIRONMENT age infertility diagn. smoking history weight hormone protocol Flare protocol days of stimulation chgs horm. prot. right ovary diam. left overy diam. # follicles/size rng ovarian cysts TECHNIQUES cycle number time harv.-insem. insemination method media type incubator number dish type Pol-Scope oil type # 6-CELL EMBRYOS BY DAY 3 Dish tech. sperm morphology Sperm tech. frozen/fresh sperm sperm type sperm count IVF tech. ICSI tech. 2 ICSI tech. 1 Embryologist Doc retrv oocytes age MALE Doc triggering cycle PERSONNEL number cleaved number polyploid number fertilized number with 2PN Day1 # with/out spindles number inseminated # oocytes retrieved OOCYTE/EMBRYO
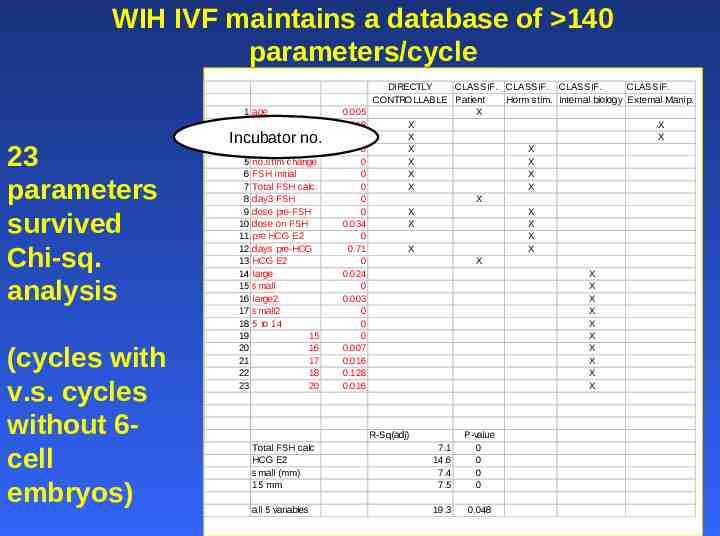
WIH IVF maintains a database of 140 parameters/cycle 23 parameters survived Chi-sq. analysis (cycles with v.s. cycles without 6cell embryos) 1 2 3 4 5 6 7 8 9 10 11 12 13 14 15 16 17 18 19 20 21 22 23 age problems incub no. Flare/antag no.stim change FSH initial Total FSH calc. day3 FSH dose pre-FSH dose on FSH pre HCG E2 days pre-HCG HCG E2 large small large2 small2 5 to 14 15 16 17 18 20 Incubator no. 0.005 0.018 0.022 0 0 0 0 0 0 0.034 0 0.71 0 0.024 0 0.003 0 0 0 0.007 0.016 0.128 0.016 DIRECTLY CLASSIF. CLASSIF. CLASSIF. CLASSIF. CONTROLLABLE Patient Horm stim. Internal biology External Manip. X X X X X X X X X X X X X X X X X X X X X X X X X X X X X X X X Total FSH calc HCG E2 small (mm) 15 mm R-Sq(adj) 7.1 14.6 7.4 7.5 P-value 0 0 0 0 all 5 variables 19.3 0.048
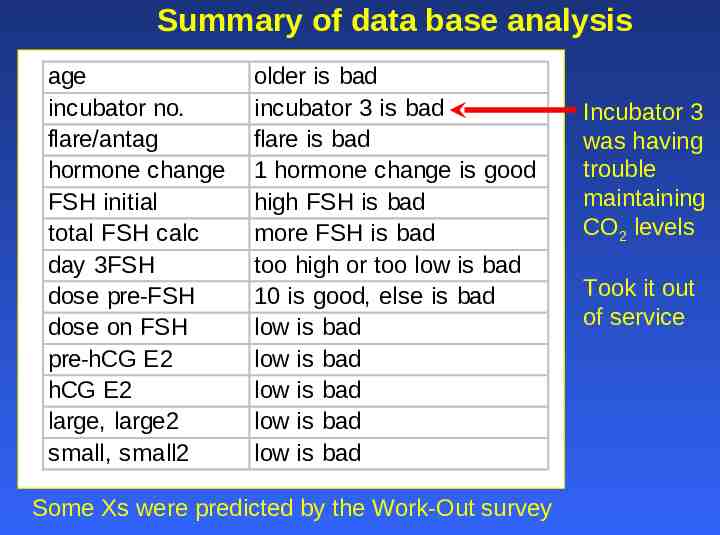
Summary of data base analysis age incubator no. flare/antag hormone change FSH initial total FSH calc day 3FSH dose pre-FSH dose on FSH pre-hCG E2 hCG E2 large, large2 small, small2 older is bad incubator 3 is bad flare is bad 1 hormone change is good high FSH is bad more FSH is bad too high or too low is bad 10 is good, else is bad low is bad low is bad low is bad low is bad low is bad Some Xs were predicted by the Work-Out survey Incubator 3 was having trouble maintaining CO2 levels Took it out of service
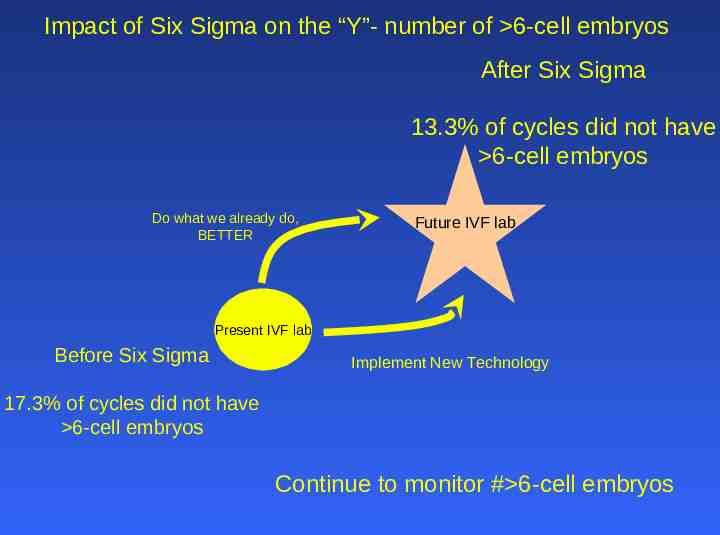
Impact of Six Sigma on the “Y”- number of 6-cell embryos After Six Sigma 13.3% of cycles did not have 6-cell embryos Do what we already do, BETTER Future IVF lab Present IVF lab Before Six Sigma Implement New Technology 17.3% of cycles did not have 6-cell embryos Continue to monitor # 6-cell embryos
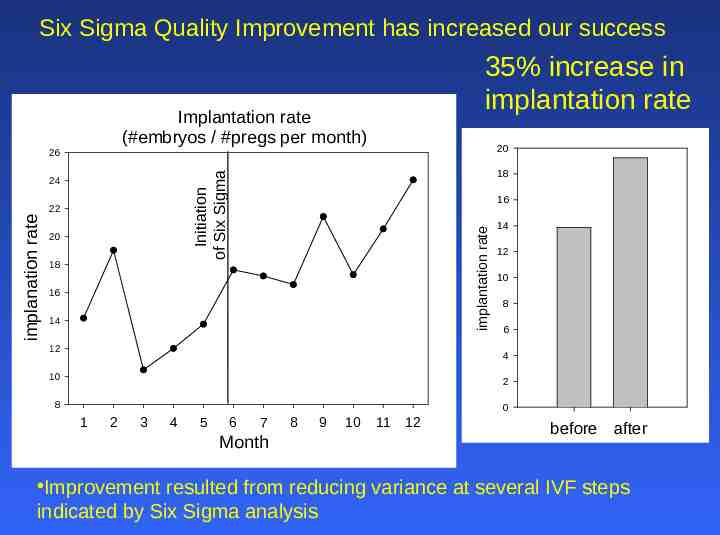
Six Sigma Quality Improvement has increased our success 35% increase in implantation rate Implantation rate (#embryos / #pregs per month) 20 26 20 18 16 implantation rate 22 implanation rate 18 Initiation of Six Sigma 24 16 14 12 14 12 10 8 6 4 10 2 8 0 1 2 3 4 5 6 7 Month 8 9 10 11 12 before after Improvement resulted from reducing variance at several IVF steps indicated by Six Sigma analysis
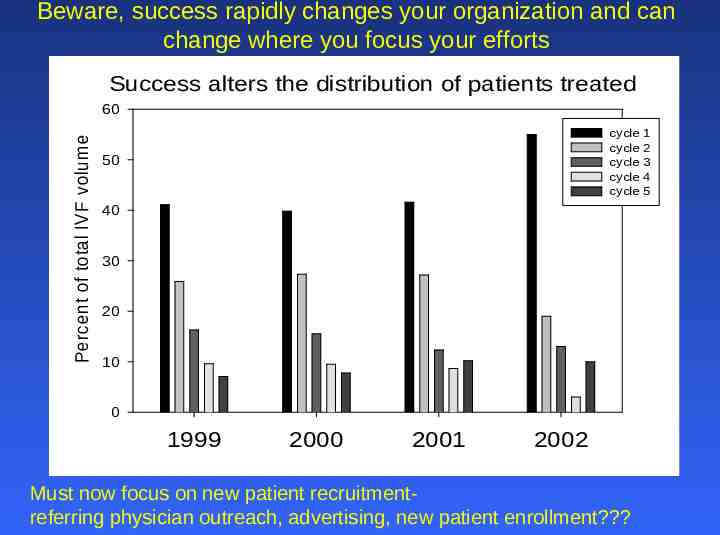
Beware, success rapidly changes your organization and can change where you focus your efforts Success alters the distribution of patients treated Percent of total IVF volume 60 cycle cycle cycle cycle cycle 50 40 30 20 10 0 1999 2000 2001 2002 Must now focus on new patient recruitmentreferring physician outreach, advertising, new patient enrollment? 1 2 3 4 5
Problems with data base analysis Other than the incubator, we simply identified a profile of a difficult patient Can only analyze what has been measured and entered into data base (e.g. embryo morphology data, E2 levels measured throughout stimulation) Now what?
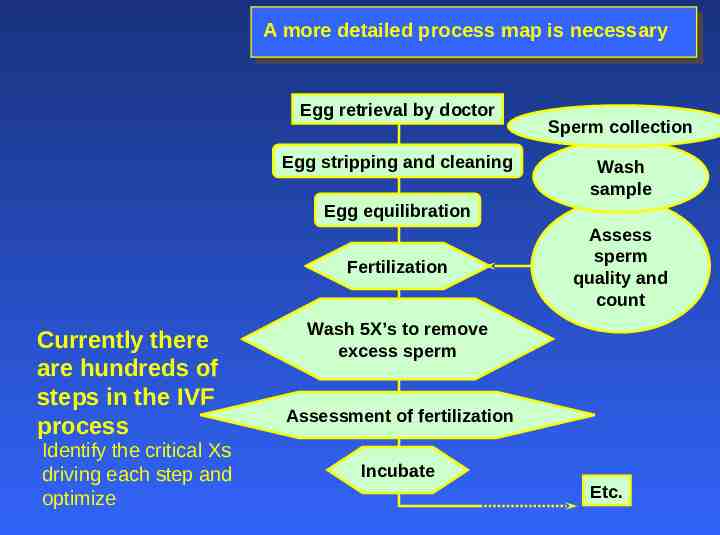
A more detailed process map is necessary Egg retrieval by doctor Egg stripping and cleaning Sperm collection Wash sample Egg equilibration Fertilization Currently there are hundreds of steps in the IVF process Identify the critical Xs driving each step and optimize Assess sperm quality and count Wash 5X’s to remove excess sperm Assessment of fertilization Incubate Etc.
Another example of Six Sigma at work – diffusing a debate Threshold for flagging cases with low fertilization rates Presently if 30% of the eggs of a cycle fertilize, the case is reviewed by physicians for poor fertilization. THE DEBATE Some physicians have argued that 30% fertilization may be too low of a threshold for flagging case review. -set threshold at 2 standard deviations from the mean. Some embryologists have argued that 30% fertilization is at about the proper level for flagging case review. THE SOLUTION Analyze data, determine mean and stdev and set fertilization threshold for flagging case review.
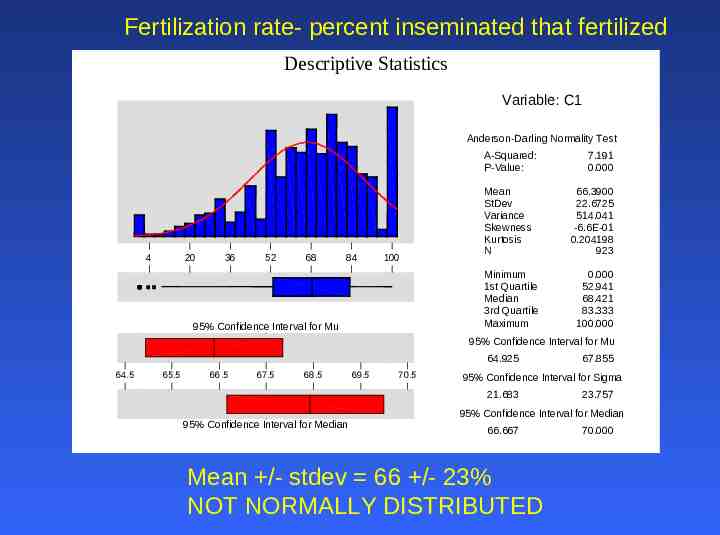
Fertilization rate- percent inseminated that fertilized Descriptive Statistics Variable: C1 Anderson-Darling Normality Test A-Squared: P-Value: 4 20 36 52 68 84 100 Mean StDev Variance Skewness Kurtosis N Minimum 1st Quartile Median 3rd Quartile Maximum 95% Confidence Interval for Mu 7.191 0.000 66.3900 22.6725 514.041 -6.6E-01 0.204198 923 0.000 52.941 68.421 83.333 100.000 95% Confidence Interval for Mu 64.925 64.5 65.5 66.5 67.5 68.5 69.5 70.5 95% Confidence Interval for Sigma 21.683 95% Confidence Interval for Median 67.855 23.757 95% Confidence Interval for Median 66.667 Mean /- stdev 66 /- 23% NOT NORMALLY DISTRIBUTED 70.000
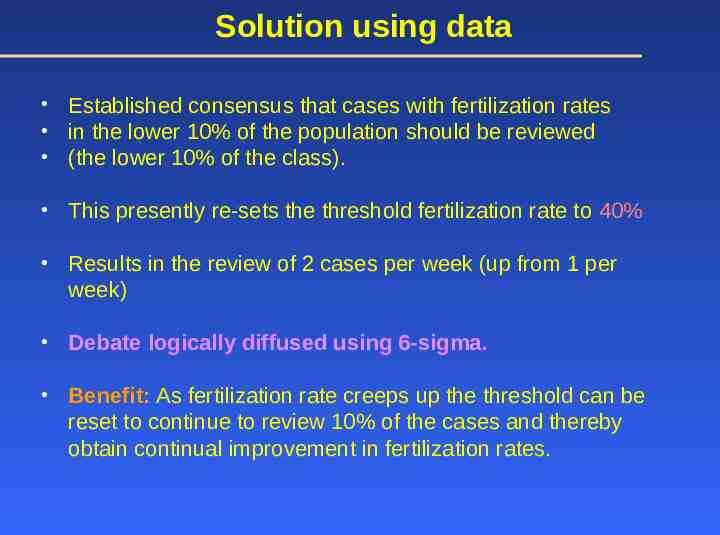
Solution using data Established consensus that cases with fertilization rates in the lower 10% of the population should be reviewed (the lower 10% of the class). This presently re-sets the threshold fertilization rate to 40% Results in the review of 2 cases per week (up from 1 per week) Debate logically diffused using 6-sigma. Benefit: As fertilization rate creeps up the threshold can be reset to continue to review 10% of the cases and thereby obtain continual improvement in fertilization rates.
Summary of fertilization threshold -Reset threshold for flagging cases for review to 40% fertilization -Use individual and moving range control charts to; * monitor progress * guard against slipping fertilization rates * indicate when fertilization is exceptionally good (identify positive situations)
Agillist Group Inc Improving Healthcare Results Six Sigma Healthcare Projects It is a pivotal moment in the history of medicine—one offering great promise through rapidly advancing physical and intellectual technology and tremendous pressure to deliver better care to more people for less cost. Don L Redinius - Agillist Group Inc – 602-617-7337 Agillist Group Inc. All Rights Reserves 9475 E Sands Dr, Scottsdale, AZ 85255 602-617-7337
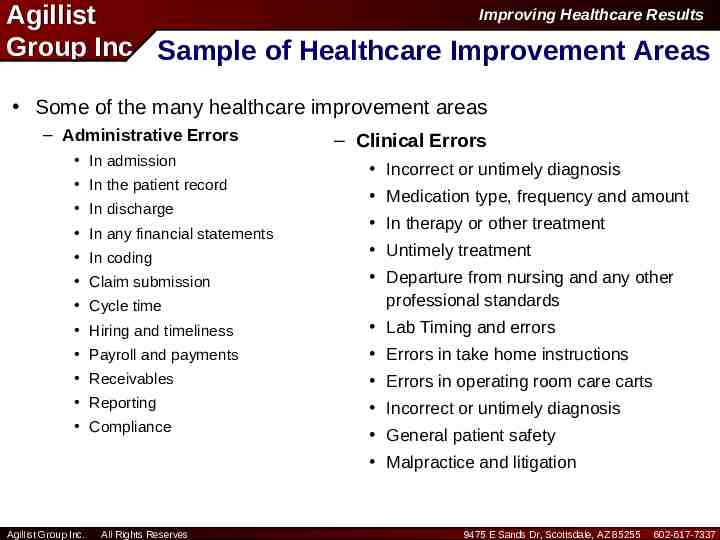
Improving Healthcare Results Agillist Group Inc Sample of Healthcare Improvement Areas Some of the many healthcare improvement areas – Administrative Errors In admission In the patient record In discharge In any financial statements – Clinical Errors Incorrect or untimely diagnosis Medication type, frequency and amount In therapy or other treatment In coding Untimely treatment Claim submission Cycle time Departure from nursing and any other professional standards Hiring and timeliness Lab Timing and errors Payroll and payments Errors in take home instructions Receivables Errors in operating room care carts Reporting Incorrect or untimely diagnosis Compliance General patient safety Malpractice and litigation Agillist Group Inc. All Rights Reserves 9475 E Sands Dr, Scottsdale, AZ 85255 602-617-7337
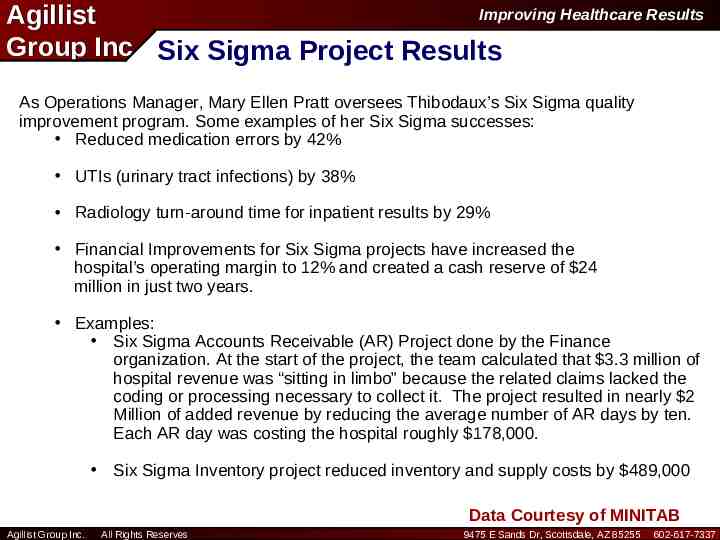
Improving Healthcare Results Agillist Group Inc Six Sigma Project Results As Operations Manager, Mary Ellen Pratt oversees Thibodaux’s Six Sigma quality improvement program. Some examples of her Six Sigma successes: Reduced medication errors by 42% UTIs (urinary tract infections) by 38% Radiology turn-around time for inpatient results by 29% Financial Improvements for Six Sigma projects have increased the hospital’s operating margin to 12% and created a cash reserve of 24 million in just two years. Examples: Six Sigma Accounts Receivable (AR) Project done by the Finance organization. At the start of the project, the team calculated that 3.3 million of hospital revenue was “sitting in limbo” because the related claims lacked the coding or processing necessary to collect it. The project resulted in nearly 2 Million of added revenue by reducing the average number of AR days by ten. Each AR day was costing the hospital roughly 178,000. Six Sigma Inventory project reduced inventory and supply costs by 489,000 Data Courtesy of MINITAB Agillist Group Inc. All Rights Reserves 9475 E Sands Dr, Scottsdale, AZ 85255 602-617-7337
Improving Healthcare Results Agillist Group Inc Project: Insurance Claim Cycle Time Business Problem Statement The Hospital was experiencing excessive cycle times for processing insurance claims. 79% were exceeding the target of 10 days and 48% were exceeding the upper limit of 15 days to mail the claim to the insurance company. This created an undesirable outlay of cash estimated at 5 million. Goals and Objectives The project had a target to reduce the average claim cycle time (Y) from 16 days to 9 days. The quantity of claims submitted over 15 days will be reduced to less than 10%. The project will complete within 3 months. The expected annualized benefit will be a reduction receivables over 4 million and hard savings from the reduced cost of working capital of 210,000 in support the hospitals objective to improve asset utilization Agillist Group Inc. All Rights Reserves 9475 E Sands Dr, Scottsdale, AZ 85255 602-617-7337
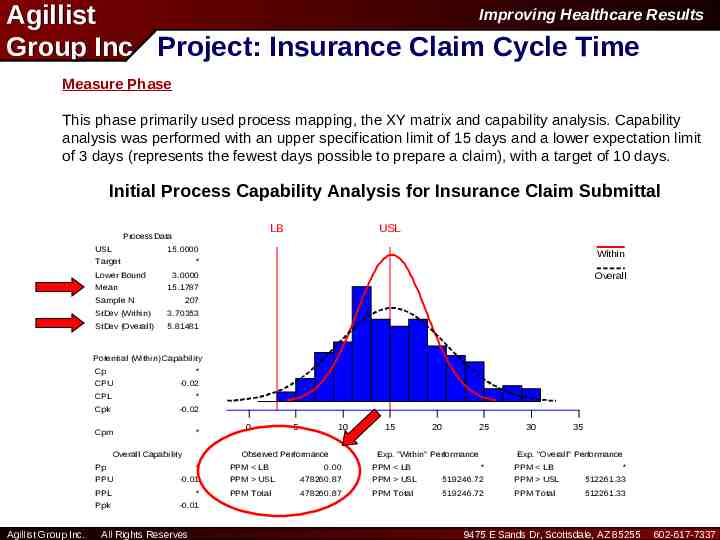
Improving Healthcare Results Agillist Group Inc Project: Insurance Claim Cycle Time Measure Phase This phase primarily used process mapping, the XY matrix and capability analysis. Capability analysis was performed with an upper specification limit of 15 days and a lower expectation limit of 3 days (represents the fewest days possible to prepare a claim), with a target of 10 days. Process Capability Analysis for C1 Claim Submittal Initial Process Capability Analysis for Insurance LB Process Data USL USL 15.0000 Target Lower Bound Mean Within * Overall 3.0000 15.1787 Sample N 207 StDev (Within) 3.70353 StDev (Overall) 5.81481 Potential (Within) Capability Cp * CPU -0.02 CPL * Cpk -0.02 Cpm * Overall Capability Pp Agillist Group Inc. 5 10 Observed Performance * PPU -0.01 PPL * Ppk -0.01 All Rights Reserves 0 PPM LB 0.00 15 20 25 Exp. "Within" Performance PPM LB 30 35 Exp. "Overall" Performance * PPM LB * PPM USL 478260.87 PPM USL 519246.72 PPM USL 512261.33 PPM Total 478260.87 PPM Total 519246.72 PPM Total 512261.33 9475 E Sands Dr, Scottsdale, AZ 85255 602-617-7337
Improving Healthcare Results Agillist Group Inc Project: Insurance Claim Cycle Time Analyze Phase In this phase five overall process areas were confirmed as major contributing process steps (X’s) using graphical analysis and hypothesis tests, these were: 1. Claim Reconciliation (Slow) 2. Services Recording (17 % had Incorrect/Missing Information) 3. Manager Review (Failure to Review) 4. Internal Mail Routing (Inconsistent Delivery Location and Time) 5. Queue Method (First in first out). For example a claim could sit in Accounts Receivables between 1 and 12 days before being worked on. Of the 36 activities identified in the process map, 21 were designated as non-value added. The non-value added steps alone accounted for approximately 7 days of the current cycle time. Agillist Group Inc. All Rights Reserves 9475 E Sands Dr, Scottsdale, AZ 85255 602-617-7337
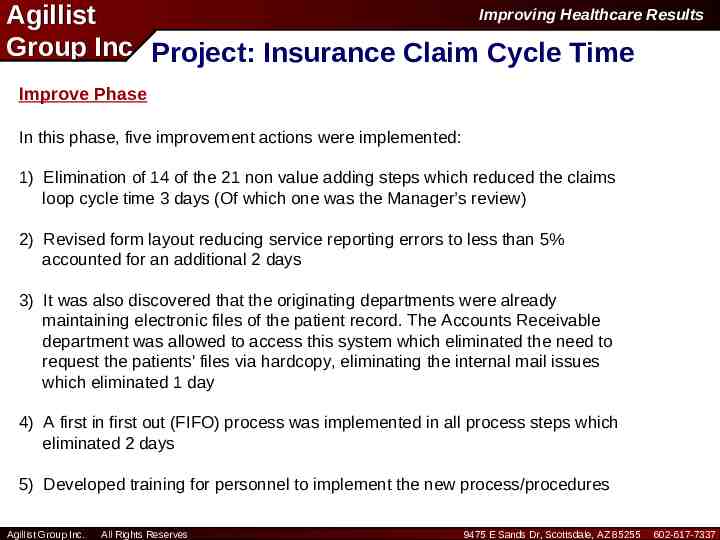
Improving Healthcare Results Agillist Group Inc Project: Insurance Claim Cycle Time Improve Phase In this phase, five improvement actions were implemented: 1) Elimination of 14 of the 21 non value adding steps which reduced the claims loop cycle time 3 days (Of which one was the Manager’s review) 2) Revised form layout reducing service reporting errors to less than 5% accounted for an additional 2 days 3) It was also discovered that the originating departments were already maintaining electronic files of the patient record. The Accounts Receivable department was allowed to access this system which eliminated the need to request the patients' files via hardcopy, eliminating the internal mail issues which eliminated 1 day 4) A first in first out (FIFO) process was implemented in all process steps which eliminated 2 days 5) Developed training for personnel to implement the new process/procedures Agillist Group Inc. All Rights Reserves 9475 E Sands Dr, Scottsdale, AZ 85255 602-617-7337
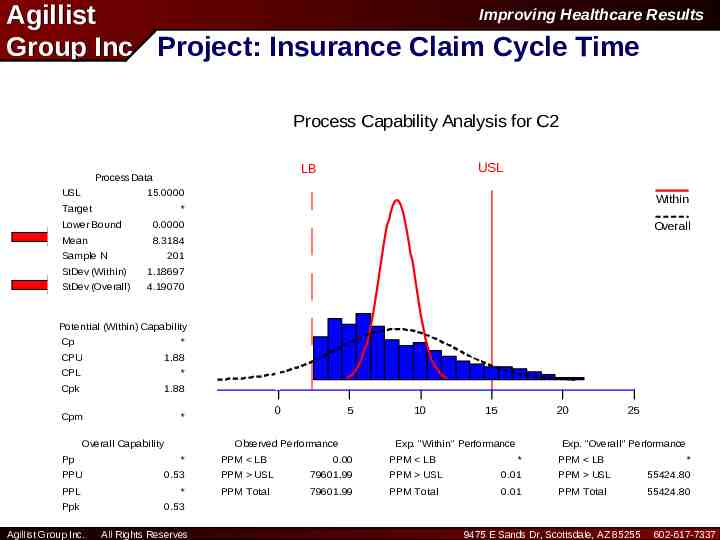
Improving Healthcare Results Agillist Group Inc Project: Insurance Claim Cycle Time Process Capability Analysis for C2 Submittal Final Process Capability Analysis for Insurance Claim LB Process Data USL USL LB 15.0000 Target Within * Lower Bound 0.0000 Mean 8.3184 Sample N Overall 201 StDev (Within) 1.18697 StDev (Overall) 4.19070 Potential (Within) Capability Cp * CPU 1.88 CPL * Cpk 1.88 Cpm Overall Capability Pp 5 Observed Performance * PPU 0.53 PPL * Ppk 0.53 Agillist Group Inc. 0 * All Rights Reserves PPM LB 0.00 10 15 20 Exp. "Within" Performance PPM LB 25 Exp. "Overall" Performance * PPM LB * PPM USL 79601.99 PPM USL 0.01 PPM USL 55424.80 PPM Total 79601.99 PPM Total 0.01 PPM Total 55424.80 9475 E Sands Dr, Scottsdale, AZ 85255 602-617-7337
Improving Healthcare Results Agillist Group Inc Project: Insurance Claim Cycle Time Control Phase In the control phase four control mechanisms were adopted. 1) An upper limit of one day was placed on the claim reconciliation process as an “early warning system” for the process 2) Services recording error rates were monitored with an SPC chart. 3) The total claim submittal times were monitored with an SPC chart via a daily sample 4) Quarterly audit of the process to assure conformance and consistency Agillist Group Inc. All Rights Reserves 9475 E Sands Dr, Scottsdale, AZ 85255 602-617-7337
Improving Healthcare Results Agillist Group Inc Project: Insurance Claim Cycle Time Results and Benefits Obtained A total of 7 days of average cycle time was removed from the insurance claim submission process, this reduced the average cycle time from 15.2 days to 8.3 days. Service recording errors were reduced from 17% to less than 5% This has improved revenue collection from an average of 16.1 million per month to 20.3 million. The annualized net reduction of 4.2 million of operating cash valued at a 5.4% weighted annual cost of capital has resulted in a net annual savings of 226,800. Less than 8% vs. the original of 48% of all claim submittals are expected to exceed the upper limit of 15 Days. Agillist Group Inc. All Rights Reserves 9475 E Sands Dr, Scottsdale, AZ 85255 602-617-7337
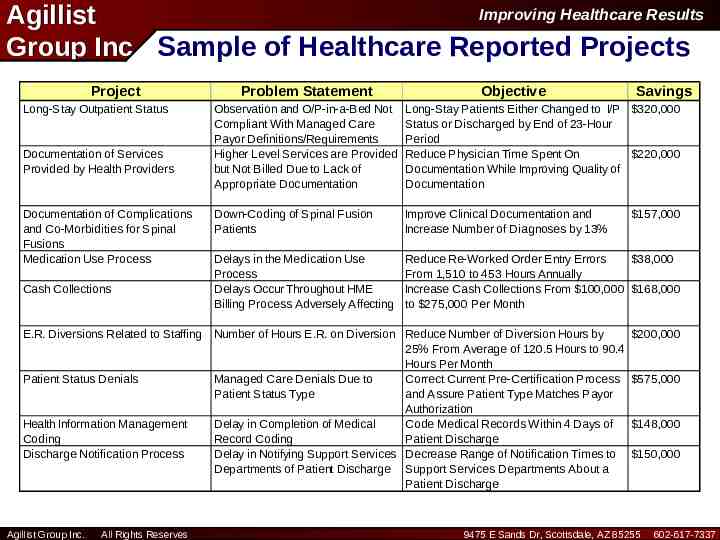
Improving Healthcare Results Agillist Group Inc Sample of Healthcare Reported Projects Project Long-Stay Outpatient Status Documentation of Services Provided by Health Providers Documentation of Complications and Co-Morbidities for Spinal Fusions Medication Use Process Cash Collections Problem Statement Objective Observation and O/P-in-a-Bed Not Compliant With Managed Care Payor Definitions/Requirements Higher Level Services are Provided but Not Billed Due to Lack of Appropriate Documentation Long-Stay Patients Either Changed to I/P 320,000 Status or Discharged by End of 23-Hour Period Reduce Physician Time Spent On 220,000 Documentation While Improving Quality of Documentation Down-Coding of Spinal Fusion Patients Improve Clinical Documentation and Increase Number of Diagnoses by 13% Delays in the Medication Use Process Delays Occur Throughout HME Billing Process Adversely Affecting Reduce Re-Worked Order Entry Errors 38,000 From 1,510 to 453 Hours Annually Increase Cash Collections From 100,000 168,000 to 275,000 Per Month E.R. Diversions Related to Staffing Number of Hours E.R. on Diversion Reduce Number of Diversion Hours by 25% From Average of 120.5 Hours to 90.4 Hours Per Month Patient Status Denials Managed Care Denials Due to Correct Current Pre-Certification Process Patient Status Type and Assure Patient Type Matches Payor Authorization Health Information Management Delay in Completion of Medical Code Medical Records Within 4 Days of Coding Record Coding Patient Discharge Discharge Notification Process Delay in Notifying Support Services Decrease Range of Notification Times to Departments of Patient Discharge Support Services Departments About a Patient Discharge Agillist Group Inc. All Rights Reserves Savings 157,000 200,000 575,000 148,000 150,000 9475 E Sands Dr, Scottsdale, AZ 85255 602-617-7337
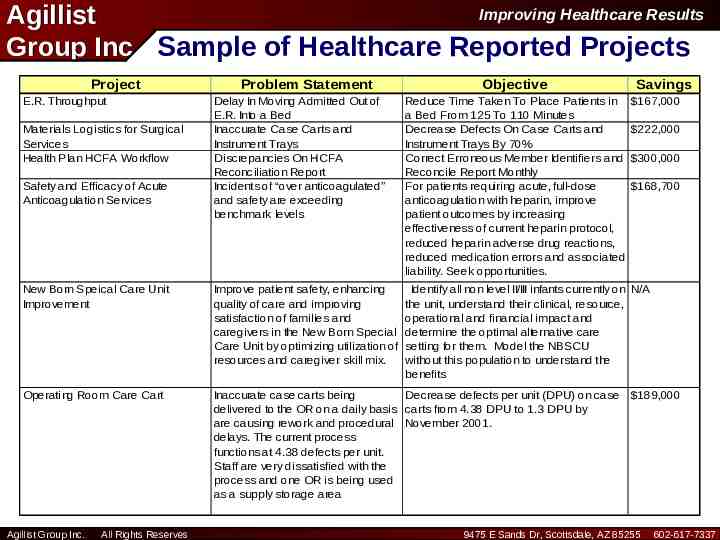
Improving Healthcare Results Agillist Group Inc Sample of Healthcare Reported Projects Project E.R. Throughput Problem Statement Objective Savings Delay In Moving Admitted Out of E.R. Into a Bed Inaccurate Case Carts and Instrument Trays Discrepancies On HCFA Reconciliation Report Incidents of “over anticoagulated” and safety are exceeding benchmark levels Reduce Time Taken To Place Patients in a Bed From 125 To 110 Minutes Decrease Defects On Case Carts and Instrument Trays By 70% Correct Erroneous Member Identifiers and Reconcile Report Monthly For patients requiring acute, full-dose anticoagulation with heparin, improve patient outcomes by increasing effectiveness of current heparin protocol, reduced heparin adverse drug reactions, reduced medication errors and associated liability. Seek opportunities. New Born Speical Care Unit Improvement Improve patient safety, enhancing quality of care and improving satisfaction of families and caregivers in the New Born Special Care Unit by optimizing utilization of resources and caregiver skill mix. Identify all non level II/III infants currently on N/A the unit, understand their clinical, resource, operational and financial impact and determine the optimal alternative care setting for them. Model the NBSCU without this population to understand the benefits Operating Room Care Cart Inaccurate case carts being Decrease defects per unit (DPU) on case delivered to the OR on a daily basis carts from 4.38 DPU to 1.3 DPU by are causing rework and procedural November 2001. delays. The current process functions at 4.38 defects per unit. Staff are very dissatisfied with the process and one OR is being used as a supply storage area Materials Logistics for Surgical Services Health Plan HCFA Workflow Safety and Efficacy of Acute Anticoagulation Services Agillist Group Inc. All Rights Reserves 167,000 222,000 300,000 168,700 189,000 9475 E Sands Dr, Scottsdale, AZ 85255 602-617-7337
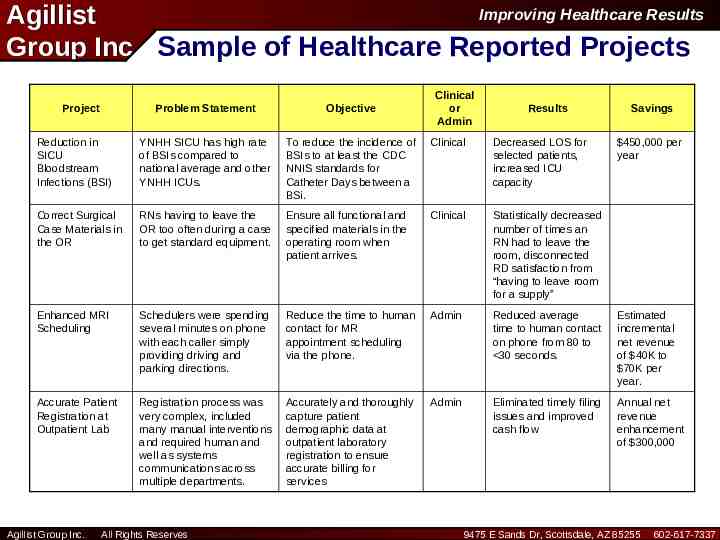
Improving Healthcare Results Agillist Group Inc Sample of Healthcare Reported Projects Project Clinical or Admin Problem Statement Objective Reduction in SICU Bloodstream Infections (BSI) YNHH SICU has high rate of BSIs compared to national average and other YNHH ICUs. To reduce the incidence of BSIs to at least the CDC NNIS standards for Catheter Days between a BSi. Clinical Decreased LOS for selected patients, increased ICU capacity Correct Surgical Case Materials in the OR RNs having to leave the OR too often during a case to get standard equipment. Ensure all functional and specified materials in the operating room when patient arrives. Clinical Statistically decreased number of times an RN had to leave the room, disconnected RD satisfaction from “having to leave room for a supply” Enhanced MRI Scheduling Schedulers were spending several minutes on phone with each caller simply providing driving and parking directions. Reduce the time to human contact for MR appointment scheduling via the phone. Admin Reduced average time to human contact on phone from 80 to 30 seconds. Estimated incremental net revenue of 40K to 70K per year. Accurate Patient Registration at Outpatient Lab Registration process was very complex, included many manual interventions and required human and well as systems communications across multiple departments. Accurately and thoroughly capture patient demographic data at outpatient laboratory registration to ensure accurate billing for services Admin Eliminated timely filing issues and improved cash flow Annual net revenue enhancement of 300,000 Agillist Group Inc. All Rights Reserves Results Savings 450,000 per year 9475 E Sands Dr, Scottsdale, AZ 85255 602-617-7337
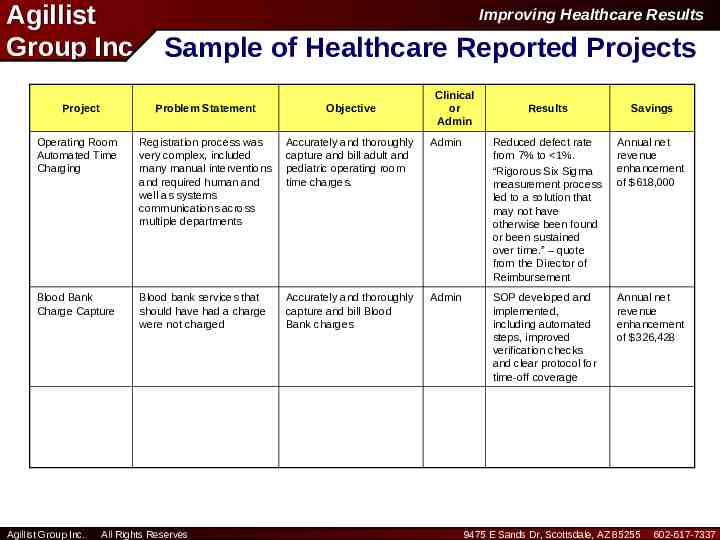
Agillist Group Inc Project Improving Healthcare Results Sample of Healthcare Reported Projects Problem Statement Objective Operating Room Automated Time Charging Registration process was very complex, included many manual interventions and required human and well as systems communications across multiple departments Accurately and thoroughly capture and bill adult and pediatric operating room time charges. Blood Bank Charge Capture Blood bank services that should have had a charge were not charged Accurately and thoroughly capture and bill Blood Bank charges Agillist Group Inc. All Rights Reserves Clinical or Admin Results Savings Admin Reduced defect rate from 7% to 1%. “Rigorous Six Sigma measurement process led to a solution that may not have otherwise been found or been sustained over time.” – quote from the Director of Reimbursement Annual net revenue enhancement of 618,000 Admin SOP developed and implemented, including automated steps, improved verification checks and clear protocol for time-off coverage Annual net revenue enhancement of 326,428 9475 E Sands Dr, Scottsdale, AZ 85255 602-617-7337
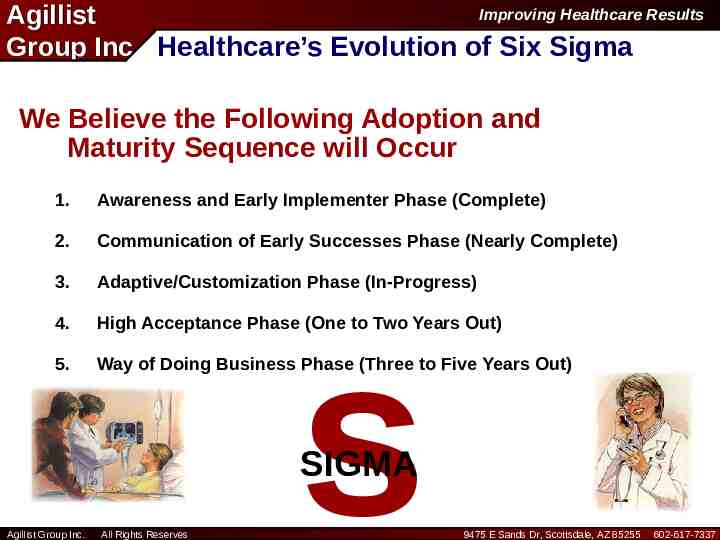
Improving Healthcare Results Agillist Group Inc Healthcare’s Evolution of Six Sigma We Believe the Following Adoption and Maturity Sequence will Occur 1. Awareness and Early Implementer Phase (Complete) 2. Communication of Early Successes Phase (Nearly Complete) 3. Adaptive/Customization Phase (In-Progress) 4. High Acceptance Phase (One to Two Years Out) 5. Way of Doing Business Phase (Three to Five Years Out) s SIGMA Agillist Group Inc. All Rights Reserves 9475 E Sands Dr, Scottsdale, AZ 85255 602-617-7337
Six Sigma at YNHH Supporting Factors Initiative driven by CEO & Senior Management – Senior Executives trained as sponsors Rolled out as “toolset to support Business Plan implementation” Three year skills transfer partnership with GEMS Pre-existing culture of performance excellence Data driven emphasis, key especially for physicians Successfully achieved significant financial benefits from projects by Year Two Project decisions made based on business criteria, not just quality criteria Offers real management development, variety of skills – Career development steps for Green & Black Belts Offers consistent problem solving technique and language Pays attention to change management
Six Sigma at YNHH Hindering Factors No full time resources yet Difficult to free up staff time required for training and project work Requires culture change - slow process Results take time - “patience required” Sponsors need ongoing support and guidance Discipline required in Control Phase
Lessons Learned Must be driven by Senior Management – Executive Training required up front Project Selection is key – Focus on high priority projects with tangible benefits – Focus within each project - don’t solve world hunger People selection is key – Choose high potential staff from multiple disciplines, including physicians – Ensure mix of quantitative versus qualitative skills in trainees Resource commitment required up front for effective roll-out – Infrastructure – Black Belts/Master Black Belts Work-OutTM/CAP tools beneficial and can be applied to non-Six Sigma projects