Sampling for an Effectiveness Study OR “How to reject your most hated


52 Slides1.25 MB
Sampling for an Effectiveness Study OR “How to reject your most hated hypothesis” Mead Over and Sergio Bautista MC Evaluation Workshop and Operations Meeting January 18-23, 2010 Johannesburg, South Africa
Hypothesis to reject Circumcision has no impact Circumcision has too little impact Intensive Circumcision Program has no more impact than Routine Circumcision Program Circumcision has no benefit for women
Hypothesis to reject Circumcision has no impact Circumcision has too little impact Intensive Circumcision Program has no more impact than Routine Circumcision Program Circumcision has no benefit for women
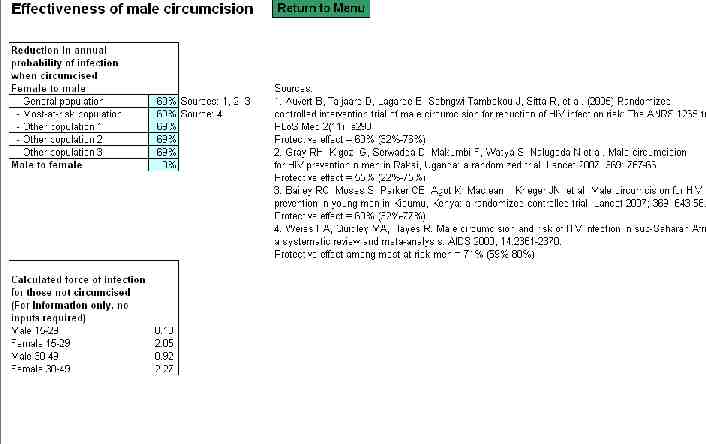
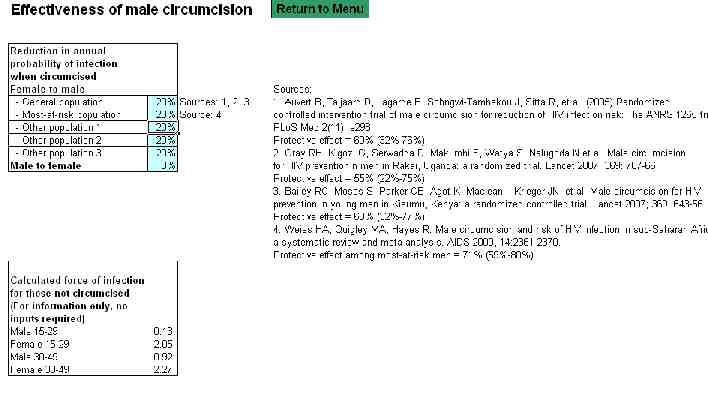
Efficacy
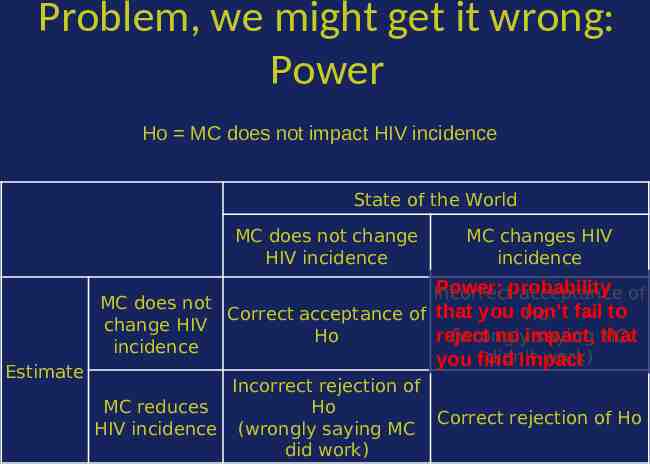
Problem, we might get it wrong: Power Ho MC does not impact HIV incidence State of the World MC does not change HIV incidence Estimate MC changes HIV incidence Power: probability Incorrect acceptance of MC does not Correct acceptance of that you don’t Ho fail to change HIV reject no impact, that Ho (wrongly saying MC incidence didn't work) you find impact Incorrect rejection of MC reduces Ho Correct rejection of Ho HIV incidence (wrongly saying MC did work)
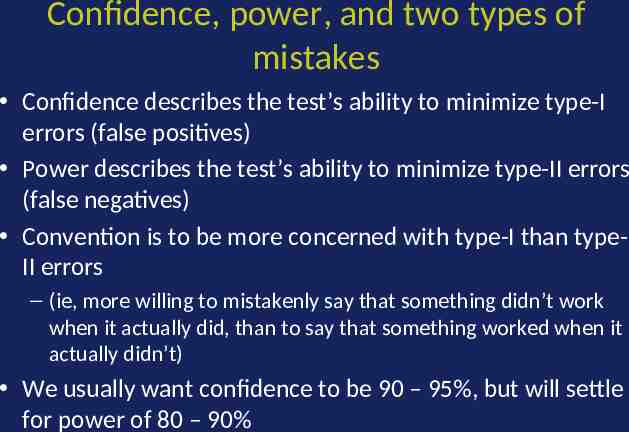
Confidence, power, and two types of mistakes Confidence describes the test’s ability to minimize type-I errors (false positives) Power describes the test’s ability to minimize type-II errors (false negatives) Convention is to be more concerned with type-I than typeII errors – (ie, more willing to mistakenly say that something didn’t work when it actually did, than to say that something worked when it actually didn’t) We usually want confidence to be 90 – 95%, but will settle for power of 80 – 90%
Power As power increases, the chances to say “no impact” when in reality there is positive impact, declines Power analysis can be used to calculate the minimum sample size required to accept the outcome of a statistical test with a particular level of confidence
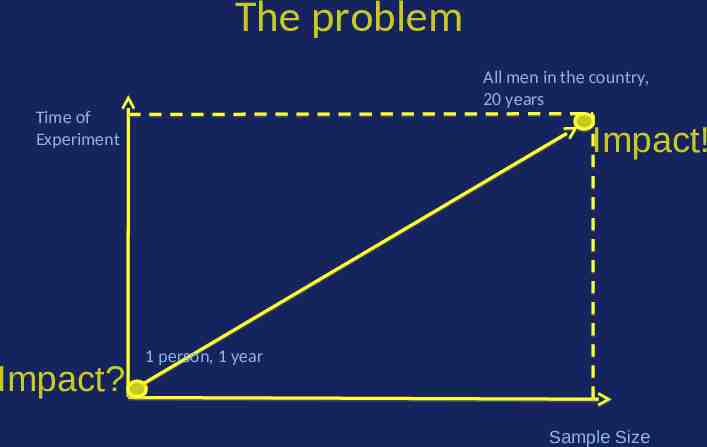
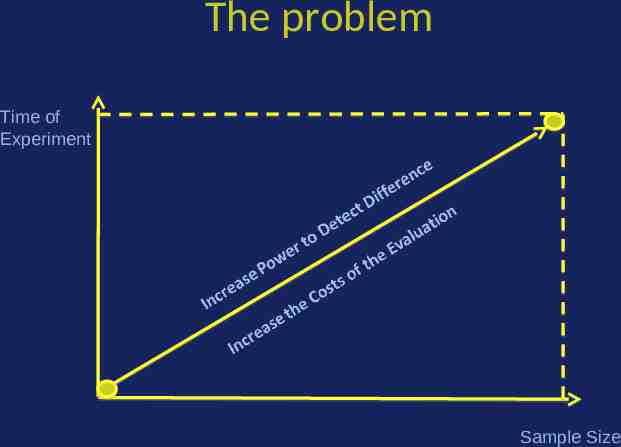
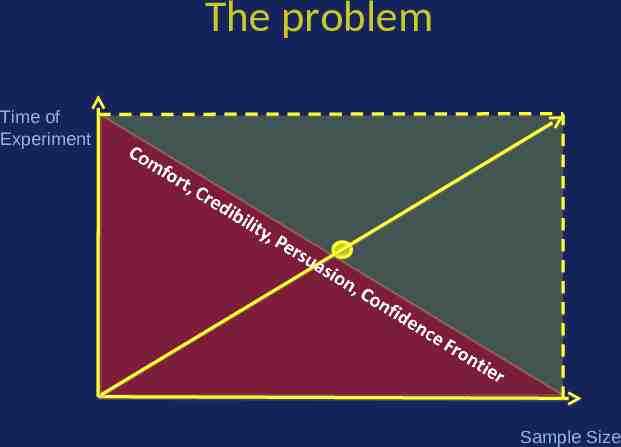
The problem All men in the country, 20 years Time of Experiment Impact? Impact! 1 person, 1 year Sample Size
The problem Time of Experiment Sample Size
The problem In principle: – The minimum sample size – The minimum observational time – The maximum power So we are confident enough about the difference we find, at minimum cost
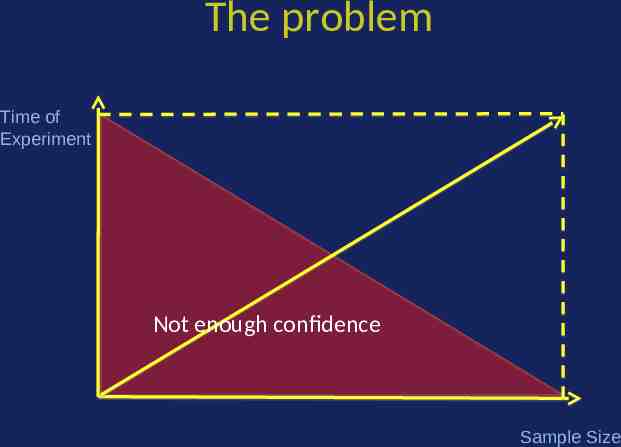
The problem Time of Experiment Not enough confidence Sample Size
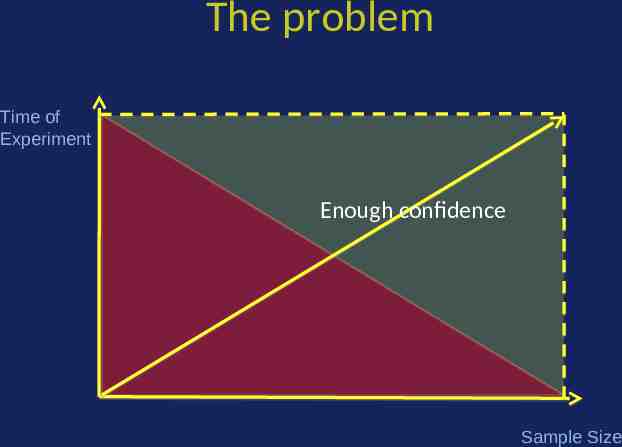
The problem Time of Experiment Enough confidence Sample Size
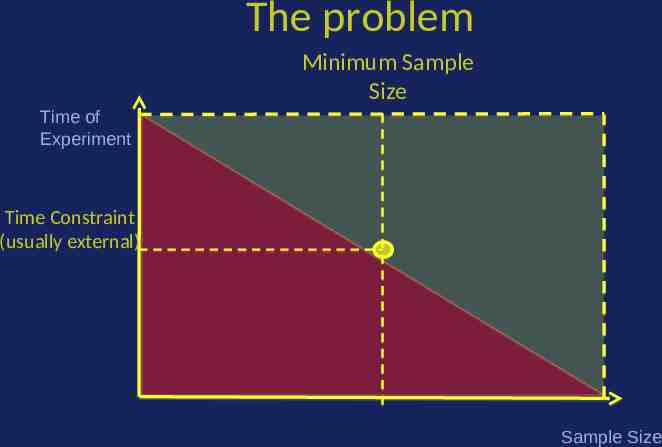
The problem Time of Experiment Sample Size
The problem Minimum Sample Size Time of Experiment Time Constraint (usually external) Sample Size
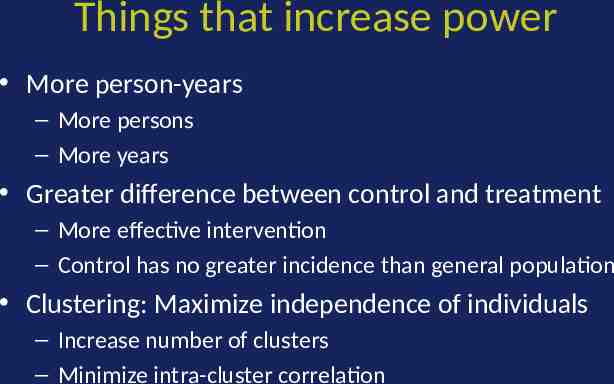
Things that increase power More person-years – More persons – More years Greater difference between control and treatment – More effective intervention – Control has no greater incidence than general population Clustering: Maximize independence of individuals – Increase number of clusters – Minimize intra-cluster correlation
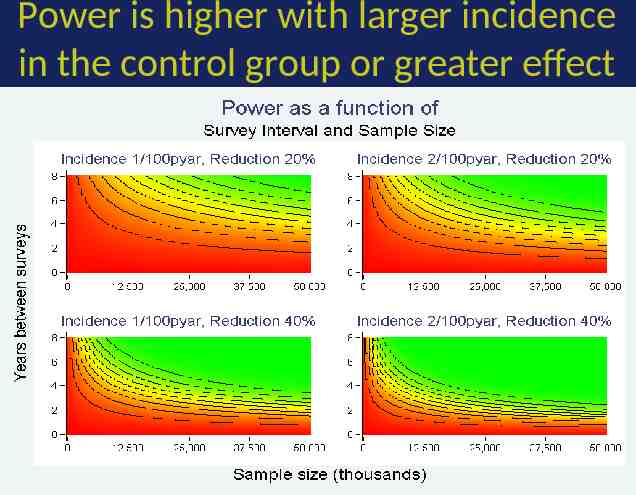
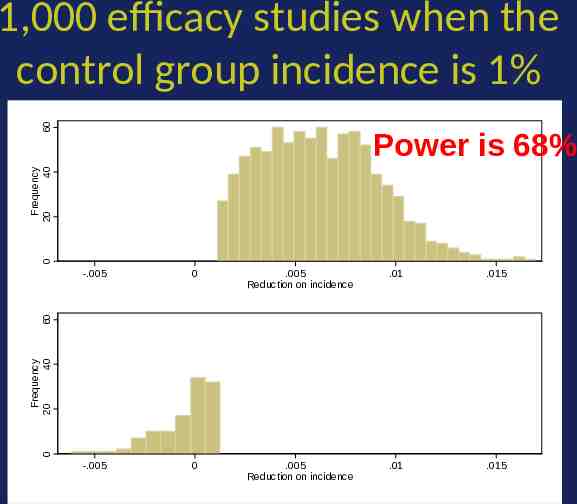
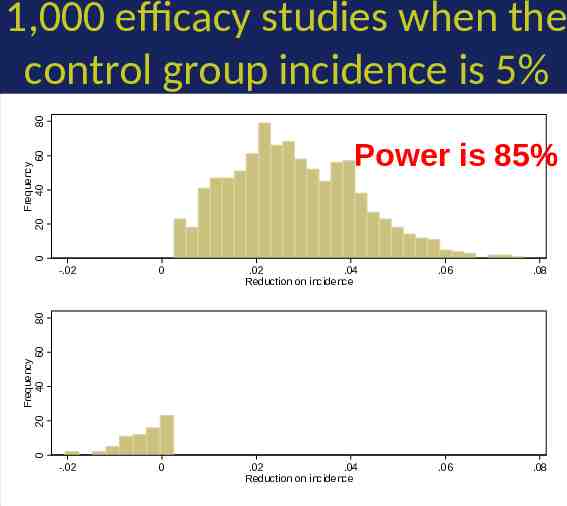
Power is higher with larger incidence in the control group or greater effect
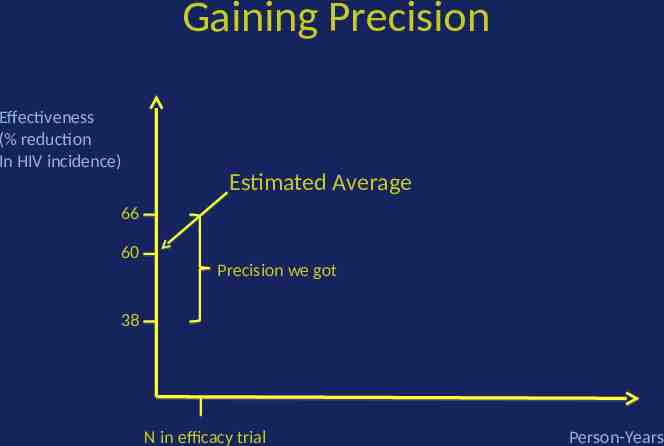
Gaining Precision Effectiveness (% reduction In HIV incidence) Estimated Average 66 60 Precision we got 38 N in efficacy trial Person-Years
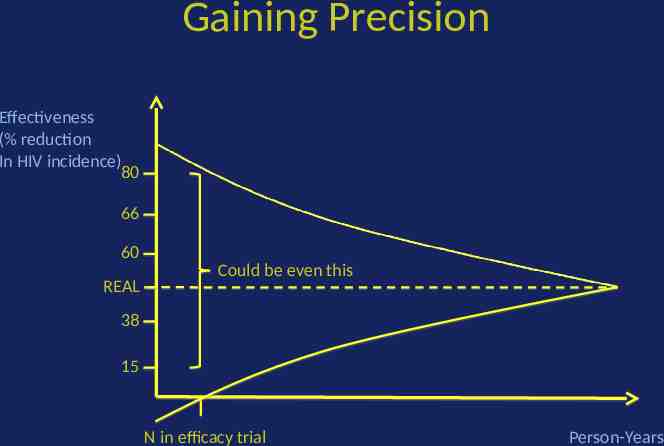
Gaining Precision Effectiveness (% reduction In HIV incidence) 80 66 60 REAL Could be even this 38 15 N in efficacy trial Person-Years
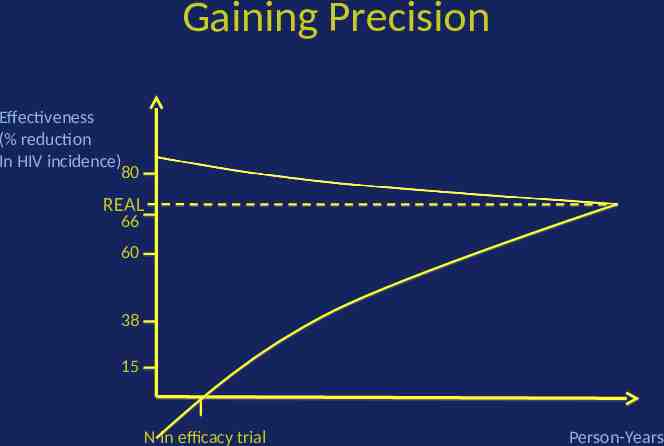
Gaining Precision Effectiveness (% reduction In HIV incidence) 80 REAL 66 60 38 15 N in efficacy trial Person-Years
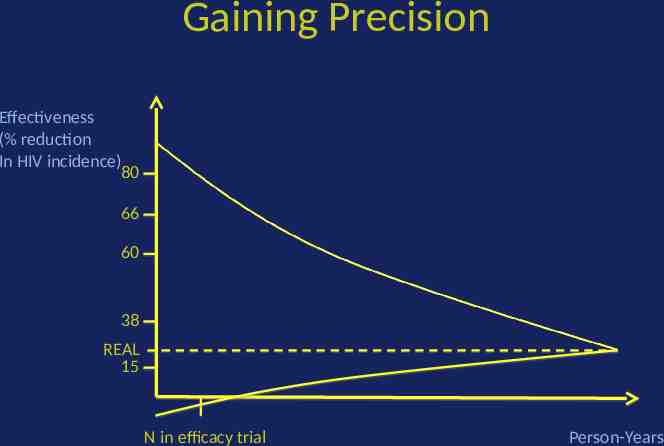
Gaining Precision Effectiveness (% reduction In HIV incidence) 80 66 60 38 REAL 15 N in efficacy trial Person-Years
60 1,000 efficacy studies when the control group incidence is 1% 0 Frequency 20 40 Power is 68% 0 .005 Reduction on incidence .01 .015 -.005 0 .005 Reduction on incidence .01 .015 0 Frequency 20 40 60 -.005
80 1,000 efficacy studies when the control group incidence is 5% 0 20 Frequency 40 60 Power is 85% 0 .02 .04 Reduction on incidence .06 .08 -.02 0 .02 .04 Reduction on incidence .06 .08 0 20 Frequency 40 60 80 -.02
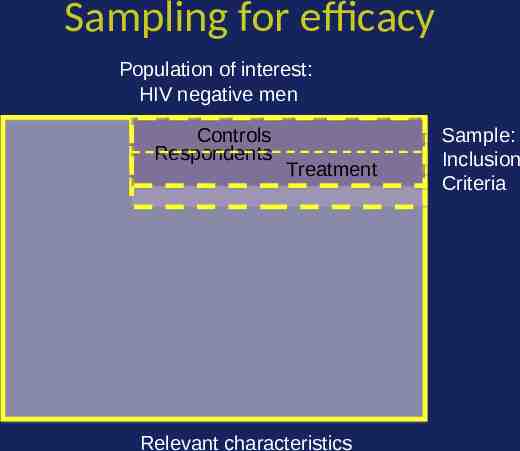
Sampling for efficacy Population of interest: HIV negative men Controls Respondents Treatment Relevant characteristics Sample: Inclusion Criteria
Effectiveness
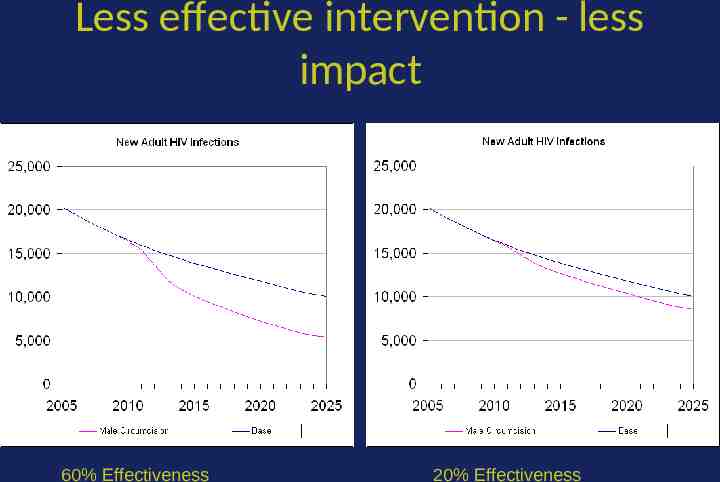
Less effective intervention - less impact 60% Effectiveness 20% Effectiveness
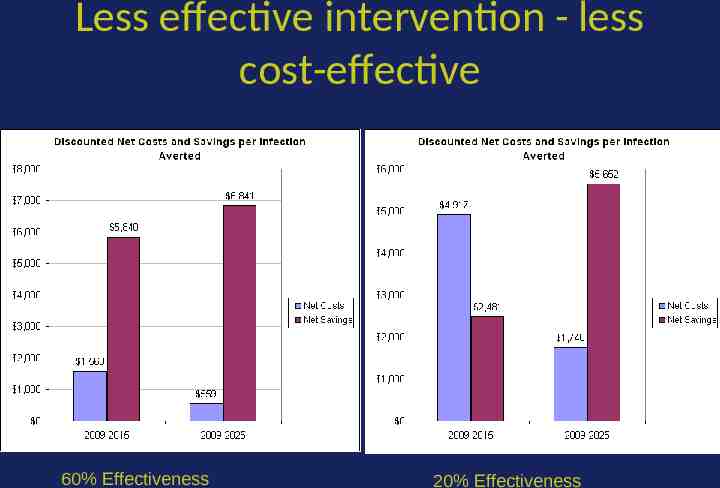
Less effective intervention - less cost-effective 60% Effectiveness 20% Effectiveness
Hypothesis to reject Circumcision has no impact Circumcision has too little impact Intensive Circumcision Program has no more impact than Routine Circumcision Program Circumcision has no benefit for women
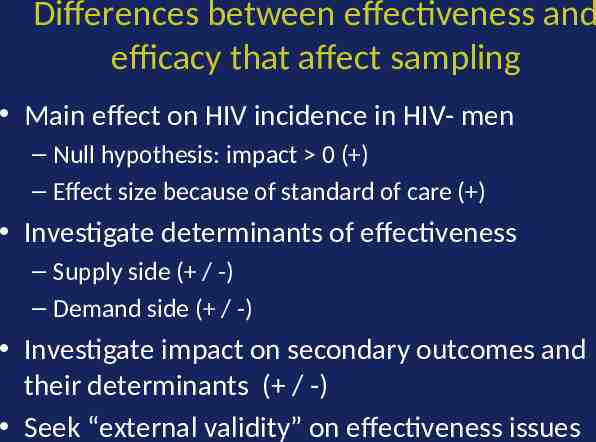
Differences between effectiveness and efficacy that affect sampling Main effect on HIV incidence in HIV- men – Null hypothesis: impact 0 ( ) – Effect size because of standard of care ( ) Investigate determinants of effectiveness – Supply side ( / -) – Demand side ( / -) Investigate impact on secondary outcomes and their determinants ( / -) Seek “external validity” on effectiveness issues
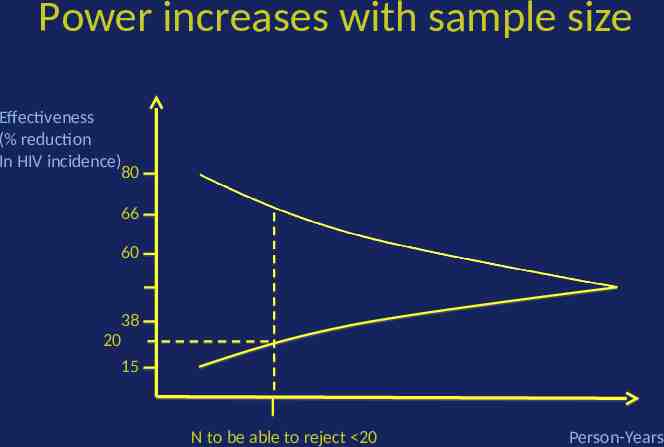
Power increases with sample size Effectiveness (% reduction In HIV incidence) 80 66 60 38 20 15 N to be able to reject 20 Person-Years
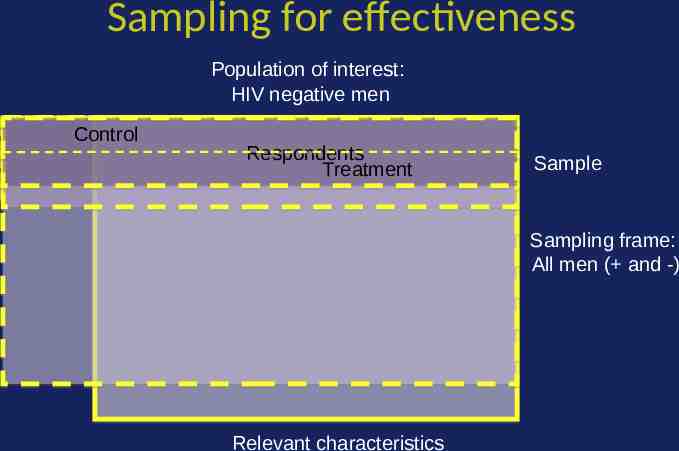
Sampling for effectiveness Population of interest: HIV negative men Control Respondents Treatment Sample Sampling frame: All men ( and -) Relevant characteristics
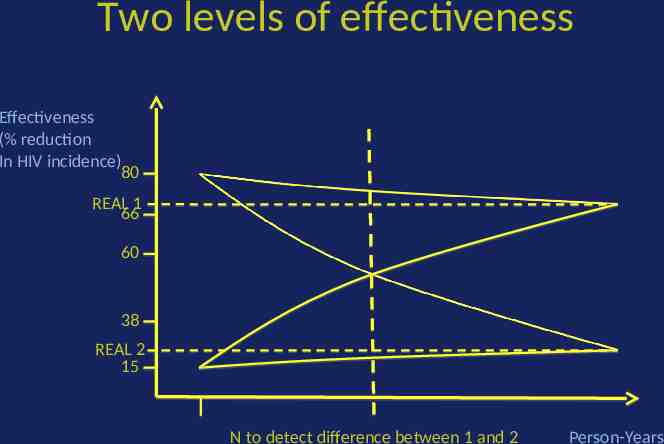
Two levels of effectiveness Effectiveness (% reduction In HIV incidence) 80 REAL 1 66 60 38 REAL 2 15 N to detect difference between 1 and 2 Person-Years
Sampling for effectiveness Population of interest: HIV negative men Control Intensity 1 Respondents Intensity 2 Sample Sampling frame: All men ( and -) Relevant characteristics
Sampling methods for effectiveness Probability sampling – Simple random: each unit in the sampling frame has the same probability of being selected into the sample – Stratified: first divide the sampling frame into strata (groups, blocks), then do a simple random sample within each strata – Clustered: sample clusters of units. Eg. villages with all the persons that live there One stage: Random sample of villages, then survey all men in selected villages Two stage: Random sample of villages, then random sample of men in selected villages
Cluster Sampling Design
Cluster Sampling In some situations, individual random samples are not feasible – When interventions are delivered at the facility/community level – When constructing a frame of the observation units may be difficult, expensive, or even impossible Customers of a store Birds in a region – When is of interest to identify community level impact – When budget constraints don’t allow it M.K. Campbell et al. Computers in Biology and Medicine 34 (2004) 113 – 125
Clustering and sample size Clustering reduces efficiency of the design – Standard sample size calculation for individualbased studies only accommodate for variation between individuals – In cluster studies, there are two components of variation Variation among individuals within clusters Variation in outcome between clusters
Clustering and sample size Individual-based studies assume independence of outcomes among individuals In cluster randomization: – Individuals within a cluster are more likely to be similar Measure of this intracluster dependence among individuals is ICC – Based in within-cluster variance High when individuals in cluster are more “similar” Not taking ICC into account may lead to underpowered study (too small sample)
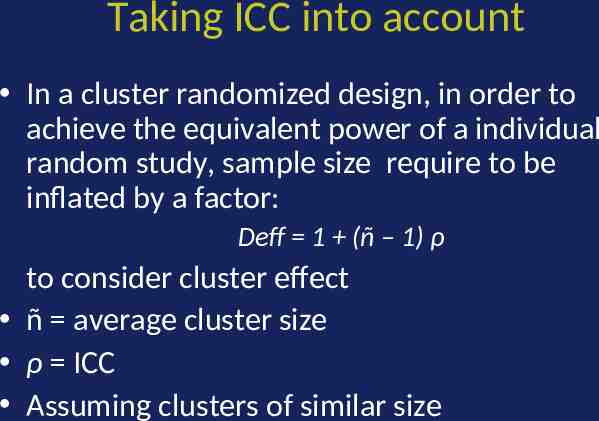
Taking ICC into account In a cluster randomized design, in order to achieve the equivalent power of a individual random study, sample size require to be inflated by a factor: Deff 1 (ñ – 1) ρ to consider cluster effect ñ average cluster size ρ ICC Assuming clusters of similar size
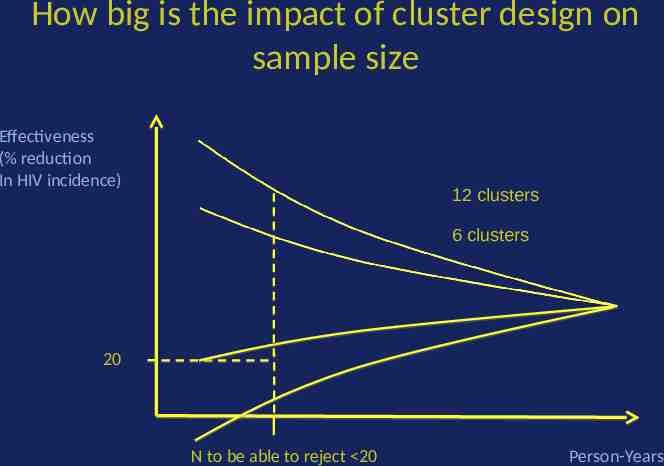
How big is the impact of cluster design on sample size Effectiveness (% reduction In HIV incidence) 12 clusters 6 clusters 20 N to be able to reject 20 Person-Years
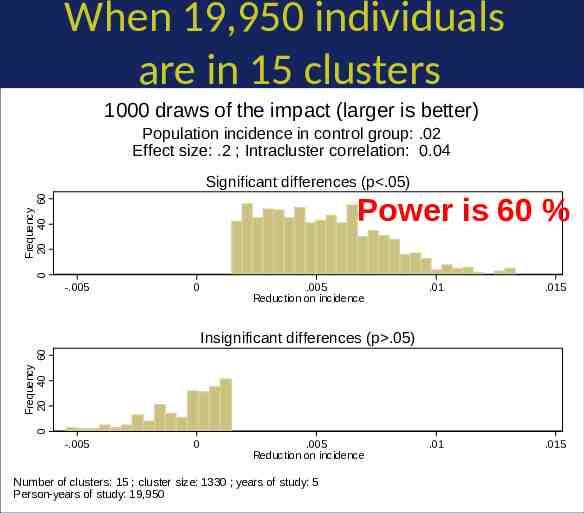
When 19,950 individuals are in 15 clusters 1000 draws of the impact (larger is better) Population incidence in control group: .02 Effect size: .2 ; Intracluster correlation: 0.04 Significant differences (p .05) 0 Frequency 20 40 60 Power is 60 % -.005 0 .005 Reduction on incidence .01 .015 .01 .015 0 Frequency 20 40 60 Insignificant differences (p .05) -.005 0 .005 Reduction on incidence Number of clusters: 15 ; cluster size: 1330 ; years of study: 5 Person-years of study: 19,950
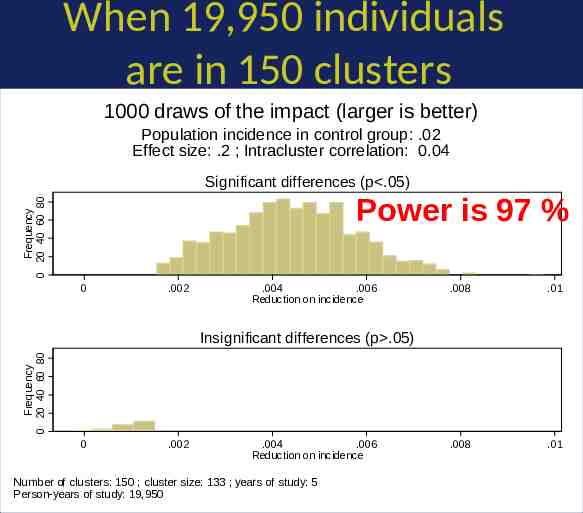
When 19,950 individuals are in 150 clusters 1000 draws of the impact (larger is better) Population incidence in control group: .02 Effect size: .2 ; Intracluster correlation: 0.04 Significant differences (p .05) Frequency 0 20 40 60 80 Power is 97 % 0 .002 .004 .006 Reduction on incidence .008 .01 .008 .01 Frequency 0 20 40 60 80 Insignificant differences (p .05) 0 .002 .004 .006 Reduction on incidence Number of clusters: 150 ; cluster size: 133 ; years of study: 5 Person-years of study: 19,950
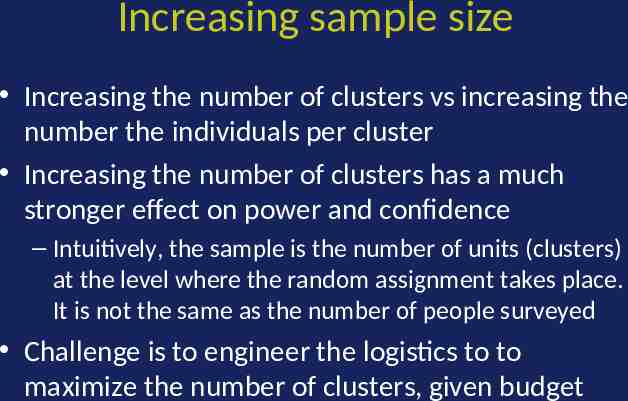
Increasing sample size Increasing the number of clusters vs increasing the number the individuals per cluster Increasing the number of clusters has a much stronger effect on power and confidence – Intuitively, the sample is the number of units (clusters) at the level where the random assignment takes place. It is not the same as the number of people surveyed Challenge is to engineer the logistics to to maximize the number of clusters, given budget
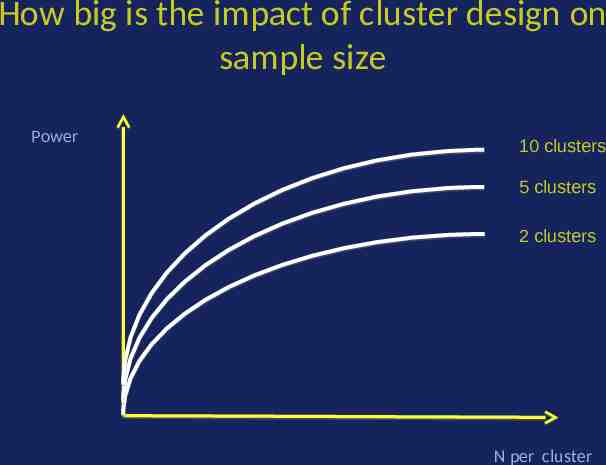
How big is the impact of cluster design on sample size Power 10 clusters 5 clusters 2 clusters N per cluster
Impact on costs?
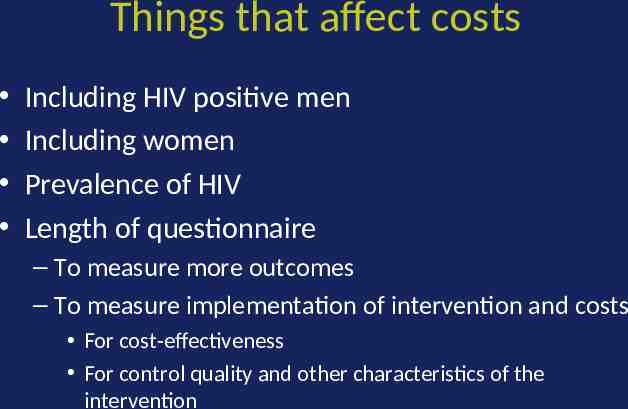
Things that affect costs Including HIV positive men Including women Prevalence of HIV Length of questionnaire – To measure more outcomes – To measure implementation of intervention and costs For cost-effectiveness For control quality and other characteristics of the intervention
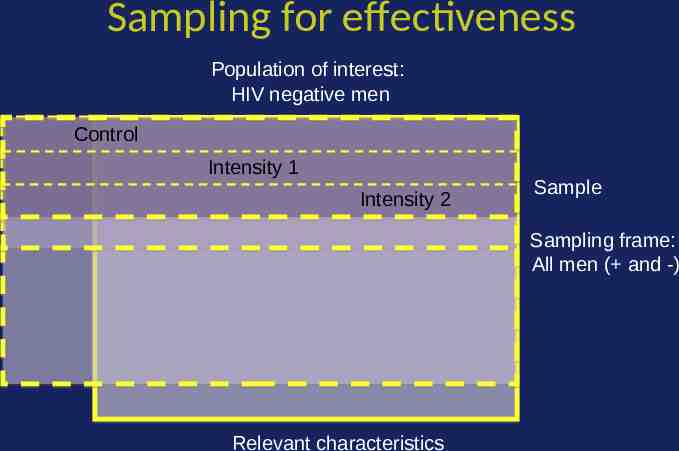
Sampling for effectiveness Population of interest: HIV negative men Control Intensity 1 Intensity 2 Sample Sampling frame: All men ( and -) Relevant characteristics
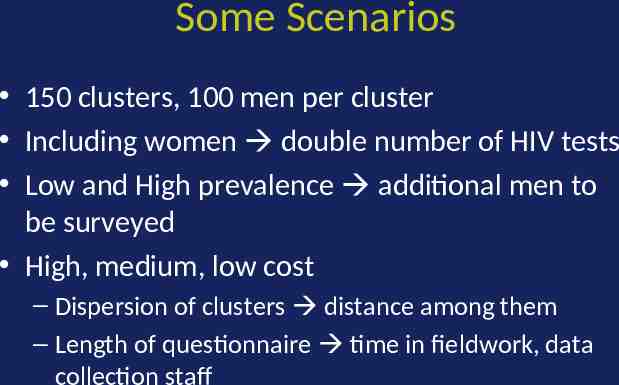
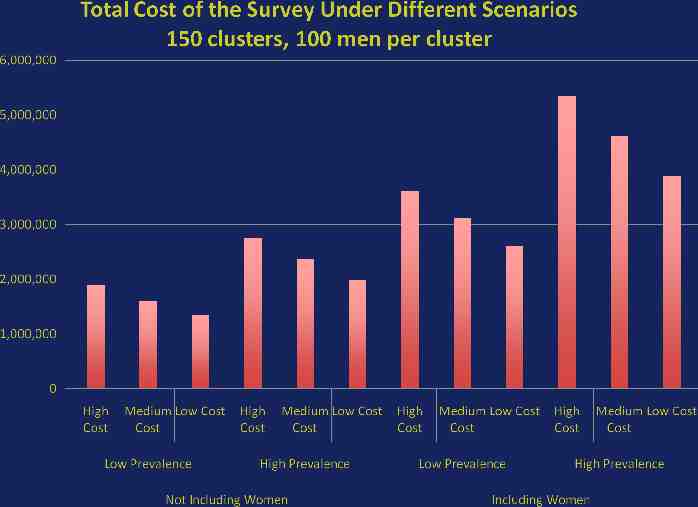
Some Scenarios 150 clusters, 100 men per cluster Including women double number of HIV tests Low and High prevalence additional men to be surveyed High, medium, low cost – Dispersion of clusters distance among them – Length of questionnaire time in fieldwork, data collection staff
Conclusions Philosophy of sample design is different for efficacy and effectiveness studies – Efficacy: narrow & deep – Effectiveness: broad & shallow Many of the special requirements of effectiveness sampling will increase sample size Clustering reduces data collection costs but at a sacrifice of power Survey costs also affected – Number of indicators collected – Number of non-index cases interviewed Most cost-effective way to reject your “hated hypothesis” is through randomized, efficeintly powered, sampling