IMPACT OF OLYMPIC GAMES ON THE HOST CITY’S GROUP MARKET HOTEL
12 Slides1.15 MB
IMPACT OF OLYMPIC GAMES ON THE HOST CITY’S GROUP MARKET HOTEL DEMAND: THE CASE OF VANCOUVER CANADA (Winter 2010) Brian Miller, EdD Yingshun Li, MS
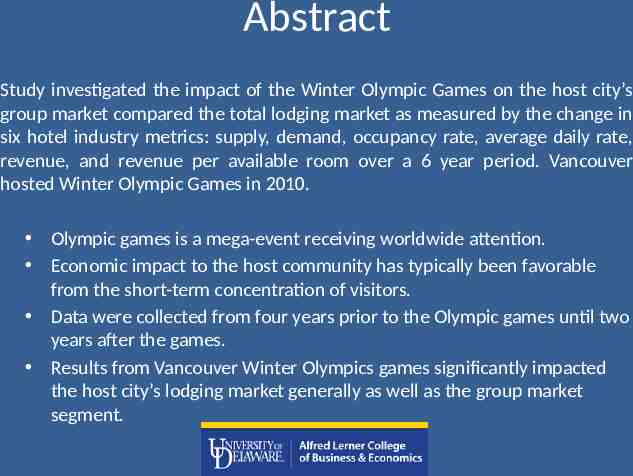
Abstract Study investigated the impact of the Winter Olympic Games on the host city’s group market compared the total lodging market as measured by the change in six hotel industry metrics: supply, demand, occupancy rate, average daily rate, revenue, and revenue per available room over a 6 year period. Vancouver hosted Winter Olympic Games in 2010. Olympic games is a mega-event receiving worldwide attention. Economic impact to the host community has typically been favorable from the short-term concentration of visitors. Data were collected from four years prior to the Olympic games until two years after the games. Results from Vancouver Winter Olympics games significantly impacted the host city’s lodging market generally as well as the group market segment.
Introduction The Olympic games represent a global icon of competitive sports. Thousands of the best athletes in the world, millions of sports fans and tourists, and over a billion of television viewers pay attention to the Olympic games every 2 years. Approximately 4.7 billion people watched the Beijing 2008 Summer Olympic games (“Beijing TV coverage,” 2008). China spent 40 billion dollars preparing and hosting the Beijing 2008 Summer Olympic games (Rosenblum, 2009). Hosting the Olympic games is an extremely complicated project in which the host country must invest a significant amount of resources to their community’s infrastructure in order to create a successful Olympic experience.
Purpose The purpose of this study was to understand how hosting the Olympic Games affected the host city’s lodging market generally and specifically group market segments using the following lodging industry metrics: Occupancy Average Daily Rate Revenue per Available Room (RevPar) Demand Supply Revenue
Methods This study seeks to describe the host city’s lodging market’s reaction to the Olympic games. Industry metrics were used to observe the impact of the Olympic games. Data sets of the host city lodging market were obtained from Smith Travel Global Research. Data sets included the markets’ hotel performances for a total of eight years. The objective of the current study was to determine how the six metrics of the host city’s lodging market responded to the Olympic games and its effect on group business demand and revenue. Data were analyzed for 8 years 6 years prior to and 2 years post Olympics
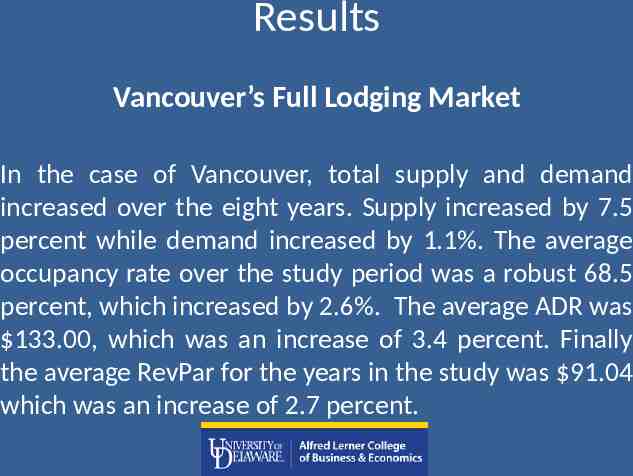
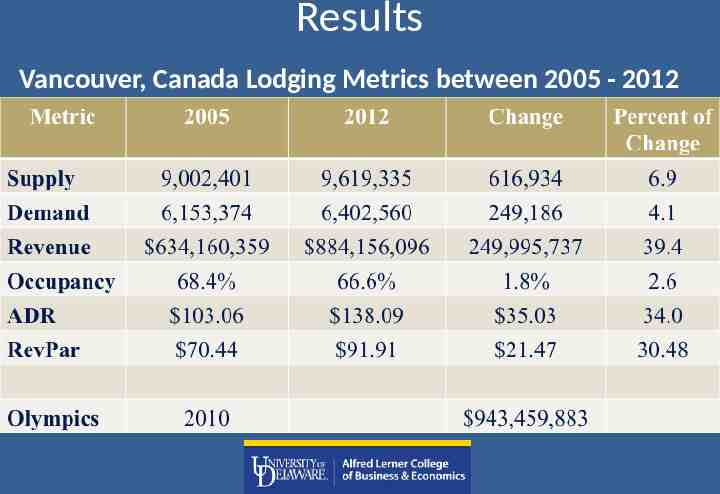
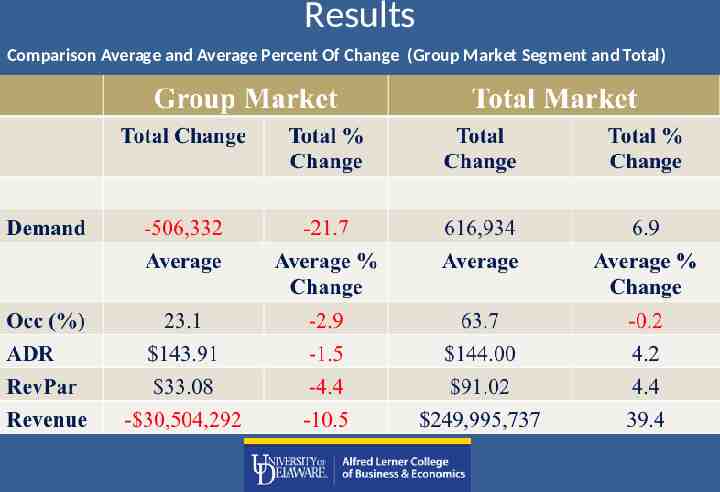
Results Vancouver’s Full Lodging Market In the case of Vancouver, total supply and demand increased over the eight years. Supply increased by 7.5 percent while demand increased by 1.1%. The average occupancy rate over the study period was a robust 68.5 percent, which increased by 2.6%. The average ADR was 133.00, which was an increase of 3.4 percent. Finally the average RevPar for the years in the study was 91.04 which was an increase of 2.7 percent.
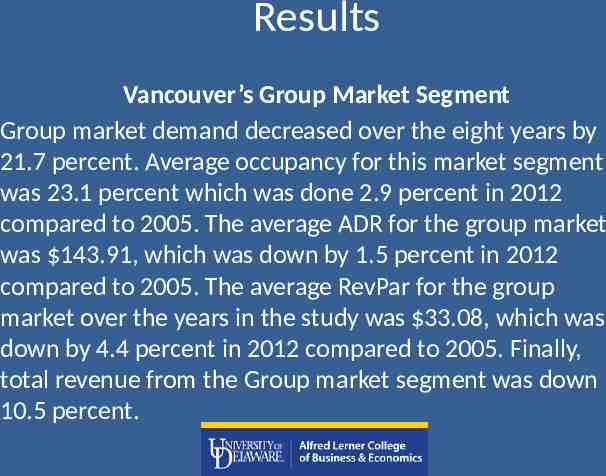
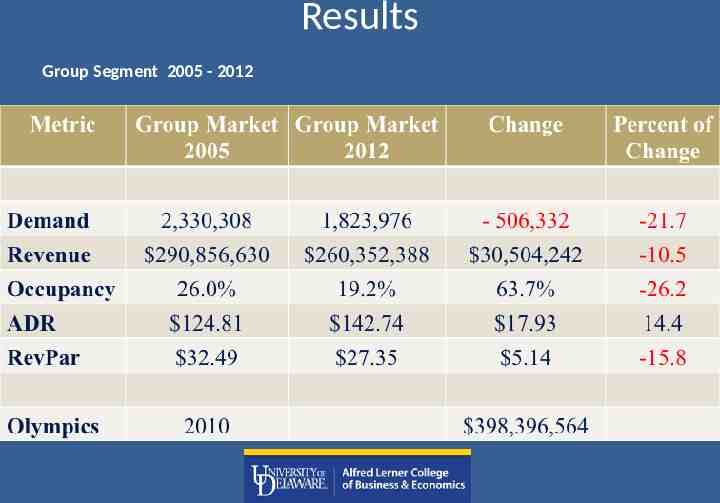
Results Vancouver’s Group Market Segment Group market demand decreased over the eight years by 21.7 percent. Average occupancy for this market segment was 23.1 percent which was done 2.9 percent in 2012 compared to 2005. The average ADR for the group market was 143.91, which was down by 1.5 percent in 2012 compared to 2005. The average RevPar for the group market over the years in the study was 33.08, which was down by 4.4 percent in 2012 compared to 2005. Finally, total revenue from the Group market segment was down 10.5 percent.
Results Vancouver, Canada Lodging Metrics between 2005 - 2012
Results Group Segment 2005 - 2012
Results Comparison Average and Average Percent Of Change (Group Market Segment and Total)
Conclusion The findings of this research provide a mixed story. Vancouver had a modest increase in supply of hotel room nights leading up to hosting the Olympic Games The Olympics caused a significant spike in the ADR and RevPAR, initiated by the increased. However, Demand and Average Group Rates have declined over the 2 years after the Olympics. Since the Group Rates are historically higher than Transient Rates, the lost of Group Market segment business equates to a loss of about one percent of rooms revenue per year since the city hosted the Olympic Games in 2010.
References Aitken, C. E., & Ritchie, J. (1985). Olympulse II: Evolving resident attitudes toward the 1988 olympic winter games. Journal of Travel Research, 23(3), 28. Blake, A., & Li, S. (2009). Estimating Olympic-related investment and expenditure. International Journal of Tourism Research, 11(4), 337-356. Fletcher, D., & Porter, P. K. (2008). The economic impact of the Olympic Games: Ex ante predictions and ex post reality. Journal of Sport Management, 22(4), 470-486. Hu, C., & Singh, N. (2008). Understanding strategic alignment for destination marketing and the 2004 Athens Olympic Games: Implications from extracted tacit knowledge. Tourism Management, 29(5), 929-939. Kasimati, E. (2003). Economic aspects and the Summer Olympics: A review of related research. International Journal of Tourism Research, 5(6), 433-444. Morse, J. (2001). The Sydney 2000 Olympic Games: How the Australian tourist commission leveraged the games for tourism. Journal of Vacation Marketing, 7(2), 101. Rosenblum, S. (2009). The impact of the Summer Olympics on its host city: the costs outweigh the tangible benefits. Retrieved from http://digitalcommons.bryant.edu. Wells, K. (2013). Sydney Olympic Games, 2000. Retrieved from http://australia.gov.au/aboutaustralia/australian-story.