Relationships Between Coach Support and Teacher Instructional


23 Slides6.69 MB
Relationships Between Coach Support and Teacher Instructional Practices Preliminary Findings from the Nigeria Reading and Access Research Activity (RARA) Karon Harden [email protected] RTI International is a registered trademark and a trade name of Research Triangle Institute. www.rti.org
Introduction, Background, and Research Questions
Introduction The importance of this research Big investment in coaching to support teacher change. How well does it work? How can we improve it? This presentation will share findings from a small project in Nigeria on the relationships between changes in reading teachers’ instructional practices and the degree and nature of support they received from their pedagogical coaches. Objective: To add to the body of knowledge about effective and efficient ways to use and improve pedagogical coaching to influence teacher instructional practices in similar low-resource contexts.
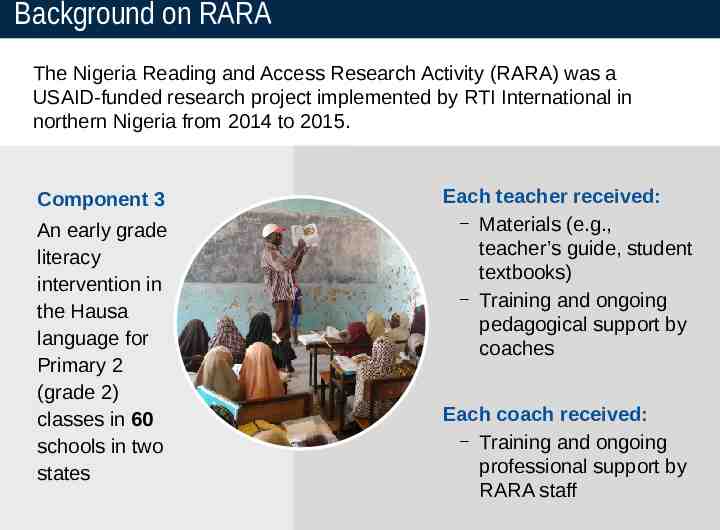
Background on RARA The Nigeria Reading and Access Research Activity (RARA) was a USAID-funded research project implemented by RTI International in northern Nigeria from 2014 to 2015. Component 3 An early grade literacy intervention in the Hausa language for Primary 2 (grade 2) classes in 60 schools in two states Each teacher received: – Materials (e.g., teacher’s guide, student textbooks) – Training and ongoing pedagogical support by coaches Each coach received: – Training and ongoing professional support by RARA staff
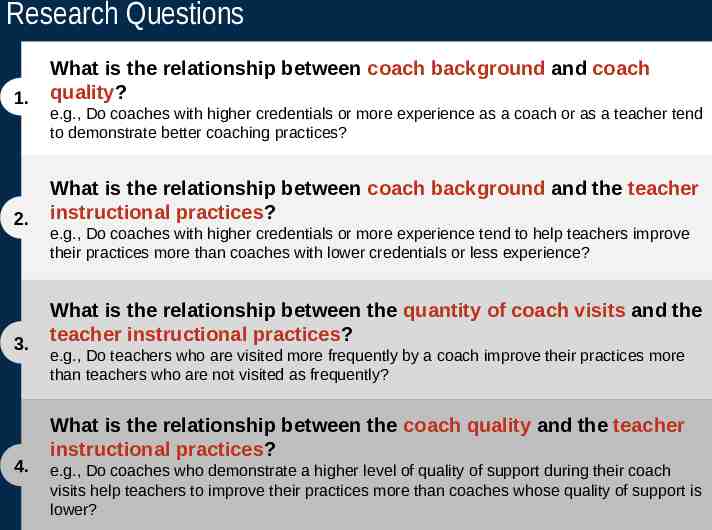
Research Questions 1. What is the relationship between coach background and coach quality? 2. What is the relationship between coach background and the teacher instructional practices? 3. What is the relationship between the quantity of coach visits and the teacher instructional practices? 4. e.g., Do coaches with higher credentials or more experience as a coach or as a teacher tend to demonstrate better coaching practices? e.g., Do coaches with higher credentials or more experience tend to help teachers improve their practices more than coaches with lower credentials or less experience? e.g., Do teachers who are visited more frequently by a coach improve their practices more than teachers who are not visited as frequently? What is the relationship between the coach quality and the teacher instructional practices? e.g., Do coaches who demonstrate a higher level of quality of support during their coach visits help teachers to improve their practices more than coaches whose quality of support is lower?
Data
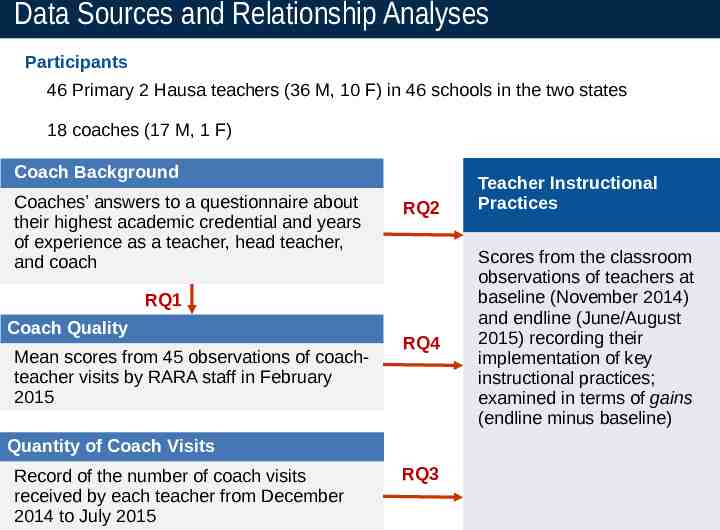
Data Sources and Relationship Analyses Participants 46 Primary 2 Hausa teachers (36 M, 10 F) in 46 schools in the two states 18 coaches (17 M, 1 F) Coach Background Coaches’ answers to a questionnaire about their highest academic credential and years of experience as a teacher, head teacher, and coach RQ2 RQ1 Coach Quality Mean scores from 45 observations of coachteacher visits by RARA staff in February 2015 RQ4 Quantity of Coach Visits Record of the number of coach visits received by each teacher from December 2014 to July 2015 RQ3 Teacher Instructional Practices Scores from the classroom observations of teachers at baseline (November 2014) and endline (June/August 2015) recording their implementation of key instructional practices; examined in terms of gains (endline minus baseline)
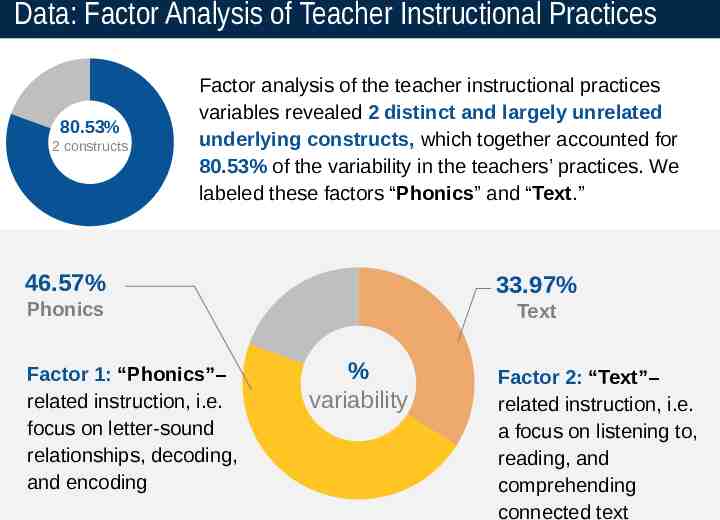
Data: Factor Analysis of Teacher Instructional Practices 80.53% 2 constructs Factor analysis of the teacher instructional practices variables revealed 2 distinct and largely unrelated underlying constructs, which together accounted for 80.53% of the variability in the teachers’ practices. We labeled these factors “Phonics” and “Text.” 46.57% 33.97% Phonics Factor 1: “Phonics”– related instruction, i.e. focus on letter-sound relationships, decoding, and encoding Text % variability Factor 2: “Text”– related instruction, i.e. a focus on listening to, reading, and comprehending connected text
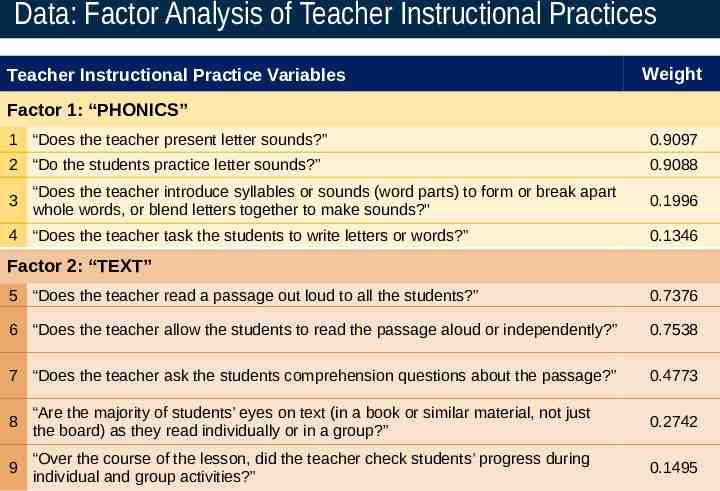
Data: Factor Analysis of Teacher Instructional Practices Teacher Instructional Practice Variables Weight Factor 1: “PHONICS” 1 “Does the teacher present letter sounds?” 0.9097 2 “Do the students practice letter sounds?” 0.9088 3 “Does the teacher introduce syllables or sounds (word parts) to form or break apart whole words, or blend letters together to make sounds?" 4 “Does the teacher task the students to write letters or words?” 0.1996 0.1346 Factor 2: “TEXT” 5 “Does the teacher read a passage out loud to all the students?” 0.7376 6 “Does the teacher allow the students to read the passage aloud or independently?” 0.7538 7 “Does the teacher ask the students comprehension questions about the passage?” 0.4773 8 “Are the majority of students’ eyes on text (in a book or similar material, not just the board) as they read individually or in a group?” 0.2742 9 “Over the course of the lesson, did the teacher check students’ progress during individual and group activities?” 0.1495
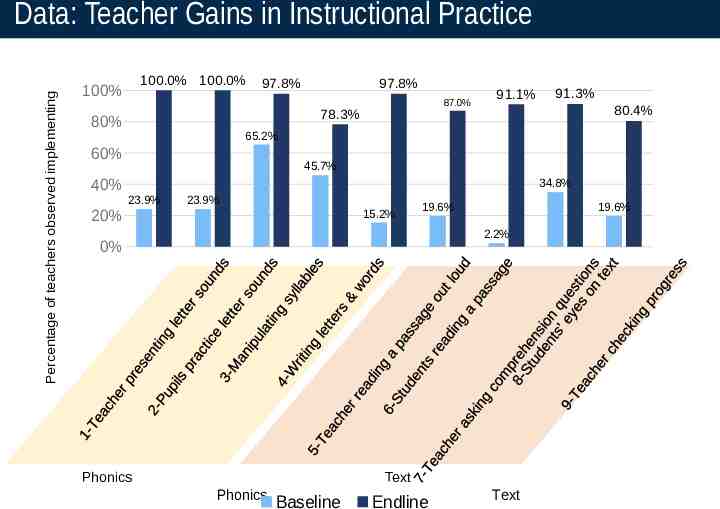
Percentage of teachers observed implementing Data: Teacher Gains in Instructional Practice 100.0% 100.0% 100% 97.8% 97.8% 87.0% 78.3% 80% 91.1% 80.4% 65.2% 60% 45.7% 40% 20% 91.3% 34.8% 23.9% 23.9% 15.2% 19.6% 19.6% 2.2% 0% Phonics Text Phonics Baseline Endline Text
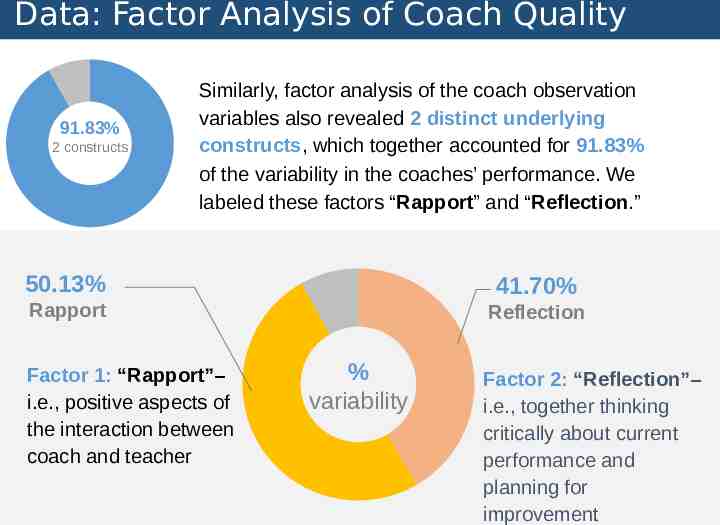
Data: Factor Analysis of Coach Quality 91.83% 2 constructs Similarly, factor analysis of the coach observation variables also revealed 2 distinct underlying constructs, which together accounted for 91.83% of the variability in the coaches’ performance. We labeled these factors “Rapport” and “Reflection.” 50.13% 41.70% Rapport Factor 1: “Rapport”– i.e., positive aspects of the interaction between coach and teacher Reflection % variability Factor 2: “Reflection”– i.e., together thinking critically about current performance and planning for improvement
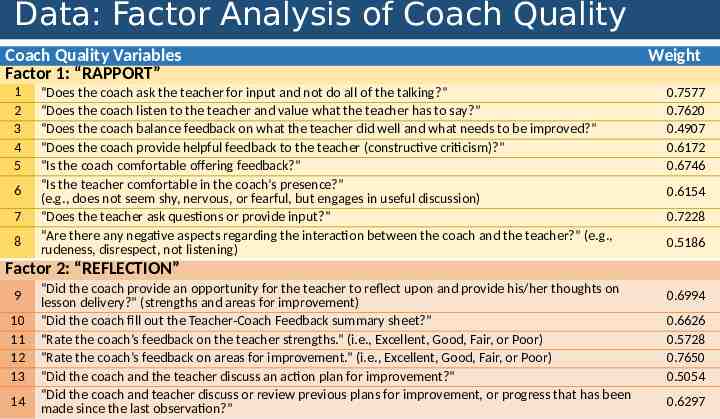
Data: Factor Analysis of Coach Quality Coach Quality Variables Factor 1: “RAPPORT” 1 2 3 4 5 6 7 8 “Does the coach ask the teacher for input and not do all of the talking?” “Does the coach listen to the teacher and value what the teacher has to say?” “Does the coach balance feedback on what the teacher did well and what needs to be improved?” “Does the coach provide helpful feedback to the teacher (constructive criticism)?” “Is the coach comfortable offering feedback?” “Is the teacher comfortable in the coach’s presence?” (e.g., does not seem shy, nervous, or fearful, but engages in useful discussion) “Does the teacher ask questions or provide input?” “Are there any negative aspects regarding the interaction between the coach and the teacher?” (e.g., rudeness, disrespect, not listening) Weight 0.7577 0.7620 0.4907 0.6172 0.6746 0.6154 0.7228 0.5186 Factor 2: “REFLECTION” 9 10 11 12 13 14 “Did the coach provide an opportunity for the teacher to reflect upon and provide his/her thoughts on lesson delivery?” (strengths and areas for improvement) “Did the coach fill out the Teacher-Coach Feedback summary sheet?” “Rate the coach’s feedback on the teacher strengths.” (i.e., Excellent, Good, Fair, or Poor) “Rate the coach’s feedback on areas for improvement.” (i.e., Excellent, Good, Fair, or Poor) “Did the coach and the teacher discuss an action plan for improvement?” “Did the coach and teacher discuss or review previous plans for improvement, or progress that has been made since the last observation?” 0.6994 0.6626 0.5728 0.7650 0.5054 0.6297
Results and Discussion
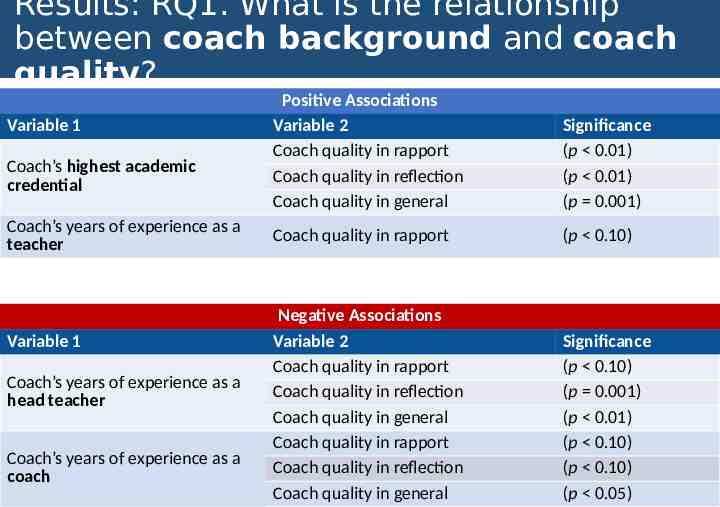
Results: RQ1. What is the relationship between coach background and coach quality? Variable 1 Coach’s highest academic credential Coach’s years of experience as a teacher Variable 1 Coach’s years of experience as a head teacher Coach’s years of experience as a coach Positive Associations Variable 2 Coach quality in rapport Coach quality in reflection Coach quality in general Significance (p 0.01) (p 0.01) (p 0.001) Coach quality in rapport (p 0.10) Negative Associations Variable 2 Coach quality in rapport Coach quality in reflection Coach quality in general Coach quality in rapport Coach quality in reflection Coach quality in general Significance (p 0.10) (p 0.001) (p 0.01) (p 0.10) (p 0.10) (p 0.05)
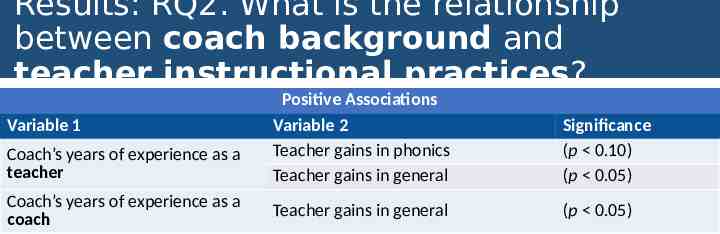
Results: RQ2. What is the relationship between coach background and teacher instructional practices? Variable 1 Coach’s years of experience as a teacher Coach’s years of experience as a coach Positive Associations Variable 2 Teacher gains in phonics Teacher gains in general Significance (p 0.10) (p 0.05) Teacher gains in general (p 0.05)
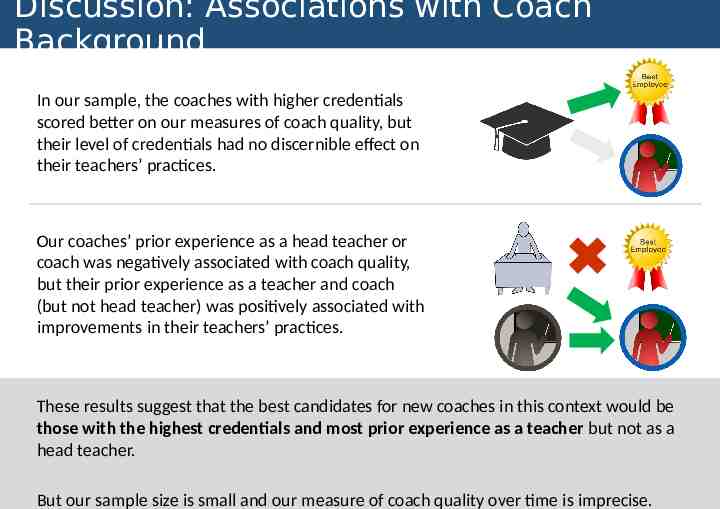
Discussion: Associations with Coach Background In our sample, the coaches with higher credentials scored better on our measures of coach quality, but their level of credentials had no discernible effect on their teachers’ practices. Our coaches’ prior experience as a head teacher or coach was negatively associated with coach quality, but their prior experience as a teacher and coach (but not head teacher) was positively associated with improvements in their teachers’ practices. These results suggest that the best candidates for new coaches in this context would be those with the highest credentials and most prior experience as a teacher but not as a head teacher. But our sample size is small and our measure of coach quality over time is imprecise.
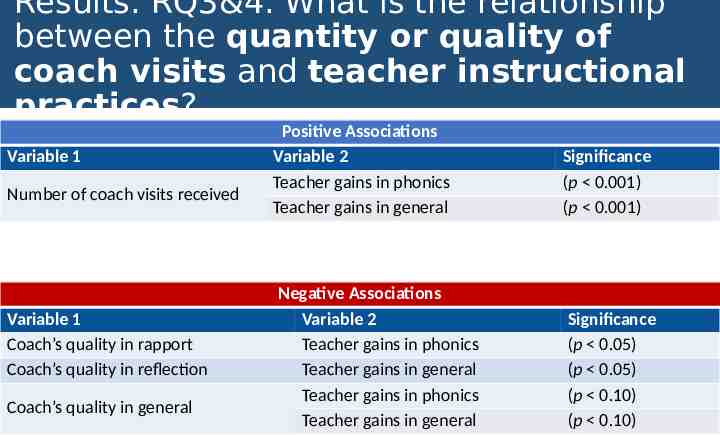
Results: RQ3&4. What is the relationship between the quantity or quality of coach visits and teacher instructional practices? Variable 1 Number of coach visits received Variable 1 Coach’s quality in rapport Coach’s quality in reflection Coach’s quality in general Positive Associations Variable 2 Teacher gains in phonics Teacher gains in general Significance (p 0.001) (p 0.001) Negative Associations Variable 2 Teacher gains in phonics Teacher gains in general Teacher gains in phonics Teacher gains in general Significance (p 0.05) (p 0.05) (p 0.10) (p 0.10)
Discussion: Associations with Coach Visits For coach visits, in our sample, quantity mattered more than (our measures of) quality. Implications for programming: – Does the quality of the coach visit really not matter that much, or do our data limitations just not capture it? – Ensuring quantity of visits may be “easier” than ensuring quality, but also more expensive? – What is the optimum number or frequency of coach visits needed to support teacher change? – If accountability is the main driver of results, can this be achieved more efficiently in some other way than by coach visits?
Discussion: No Associations with TextRelated Gains Also, even though the teachers increased both their Phonics and Textrelated instructional practices, nothing we measured—not coach background, quantity of visits or quality of visits—showed any association with the Text-related gains (only with Phonics). Why Phonics and not Text? What is driving the increase in Text-related instructional practices?
Limitations and Considerations for Future Research
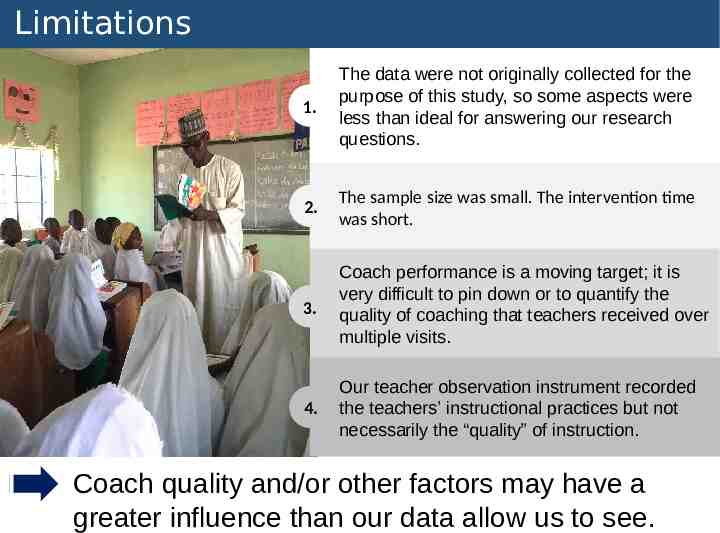
Limitations 1. The data were not originally collected for the purpose of this study, so some aspects were less than ideal for answering our research questions. 2. The sample size was small. The intervention time was short. 3. Coach performance is a moving target; it is very difficult to pin down or to quantify the quality of coaching that teachers received over multiple visits. 4. Our teacher observation instrument recorded the teachers’ instructional practices but not necessarily the “quality” of instruction. Coach quality and/or other factors may have a greater influence than our data allow us to see.
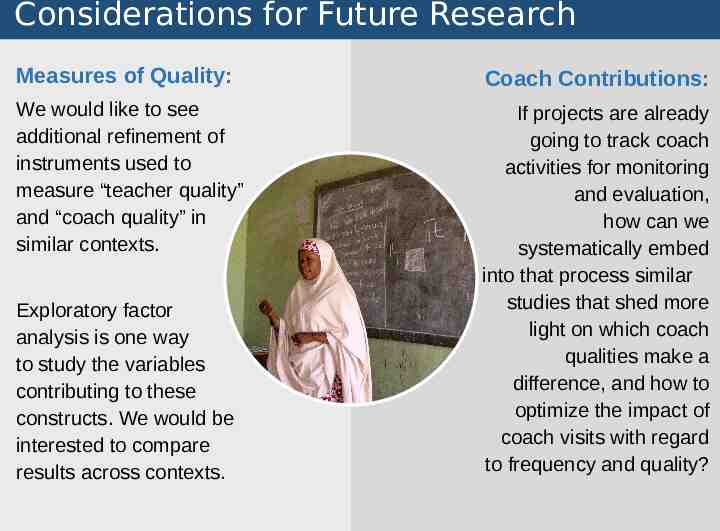
Considerations for Future Research Measures of Quality: Coach Contributions: We would like to see additional refinement of instruments used to measure “teacher quality” and “coach quality” in similar contexts. If projects are already going to track coach activities for monitoring and evaluation, how can we systematically embed into that process similar studies that shed more light on which coach qualities make a difference, and how to optimize the impact of coach visits with regard to frequency and quality? Exploratory factor analysis is one way to study the variables contributing to these constructs. We would be interested to compare results across contexts.
For More Information Karon Harden Research Education Analyst [email protected] SharEd.rti.org