Quality assurance and control Quality assurance Lec. 2 3rd Grade


47 Slides726.56 KB
Quality assurance and control Quality assurance Lec. 2 3rd Grade – Fall Semester 2021-2022 Goran N. Saleh / Assisst. lec [email protected] 27/10/2021
INTRODUCTION TO QUALITY CONTROL
1. INTRODUCTION Quality affects the manufacturing and service industry, the adoption of quality-related terms and the development of a system for the design and implementation of quality. The ability to recognize the specific needs of the consumer, which will help to sustain and increase market share, will be significant.
2. EVOLUTION OF QUALITY CONTROL Since time immemorial, the quality of products manufactured and services provided has been tracked, either directly or indirectly. However, the use of a quantitative base involving statistical concepts for quality control is a new phenomenon. As computer use grew in the 1980s, an explosion of quality management software systems were introduced.
3. QUALITY The notion of quality has been described in various ways by different writers. Garvin (1984) divides the concept of quality into five categories: transcendent, product-based, user-based, manufacturing-based, and value-based. It also defines a system of eight attributes that can be used to define quality: efficiency, features, reliability, consistency, longevity, serviceability, aesthetics, and perceived quality. This commonly used definition is credited to Crosby (1979): "Quality meets requirements or specifications." The more general definition suggested by Juran (1974) is as follows: "Quality is fitness for use."
Quality Characteristics The preceding example indicates that one or more of the elements determine the expected quality level of the product or service. These elements, known as quality characteristics, can be classified in these categories: Structural characteristics Sensory characteristics time-oriented characteristics Ethical characteristics
Variables and Attributes Quality characteristics fall into two large classes: variables and attributes. Characteristics that are observable and expressed on a numerical scale are called variables. The waiting time in the bank before serving, expressed in minutes, is variable, as is the density of the liquid in grams per cubic centimetre and the resistance of the coil in ohms.
Standard or Specification Because the concept of quality requires meeting the customer's requirements, these requirements need to be reported. A standard or specification refers to a particular statement that formalizes the customer's requirements; it may apply to a product, a process or a
Definitions given by the National Bureau of Standards (NBS, 2005) are as follows: Specification: a collection of conditions and specifications, of a particular and restricted application, which provide a comprehensive explanation of the method, process, material, product or service for use primarily in procurement and manufacturing. Standard: The specified collection of conditions and specifications, of general or broad application, defined by authority or agreement, to be met by means of a material, device, process, procedure, convention, test method; and/or the physical, functional, performance or conformity characteristic thereof.
Quality assurance and control Quality assurance Lec. 3 3rd Grade – Fall Semester 2021-2022 Goran N. Saleh / Assisst. lec [email protected] 3/11/2021
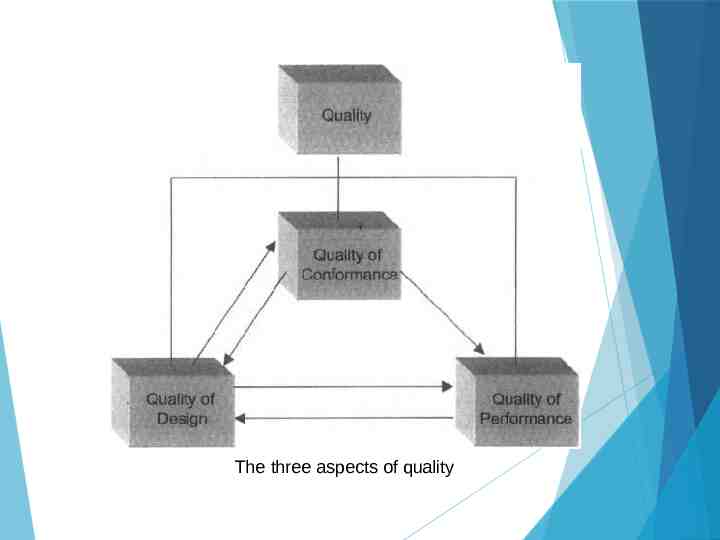
Quality of Design Design quality deals with the strict conditions that the product or service must provide to meet the expectations of the customer as a minimum. It means that the product or service must be planned to satisfy at least minimally the needs of the customer. Generally speaking, the design should be the simplest and least costly, while also meeting the requirements of the consumer. Design quality is affected by factors such as product type, cost, company profit policy, product demand, availability of parts and materials, and product protection.
Quality of Conformance Quality of conformity means that the produced product or service provided must comply with the requirements chosen during the design process. As far as the manufacturing sector is concerned, this process is concerned with the degree to which quality is regulated from the procurement of raw materials to the shipment of finished products.
The three aspects of quality
Quality of Performance Quality of performance includes how well a product or service performs when it is put to use. It shall calculate the degree to which the product or service satisfies the customer. This is a feature of both the quality of the design and the quality of the design. Know that the final measure of approval of the product or service is always with the consumers. A big aim is to meet or surpass their standards.
4. QUALITY CONTROL Quality management may generally be characterized as a system that maintains the desired level of quality, through feedback on the characteristics of the product/service and through the implementation of remedial steps, in the event of such a deviation from the prescribed norm. This general area can be divided into three main sub-baskets: off-line quality management, statistical process control, and acceptance sampling plans.
A. Off-Line Quality Control Off-line quality management techniques deal with the collection and selection of controllable product and process parameters in such a way that the difference between the performance of the product or process and the norm is reduced. Most of this mission is achieved through the design of the product and operation.
B. Statistical Process Control Statistical process management requires measuring the performance of a process or service to the norm and taking remedial measures in the event of a difference between the two. It also includes deciding whether a process will produce a product that meets the necessary specifications or requirements.
C. Acceptance Sampling Plans Acceptance sampling plans shall include the review of the product or service. When 100% inspection of all items is not possible, a decision must be taken as to how many items should be sampled or whether the batch should be sampled at all.
5. QUALITY ASSURANCE Quality is not just the responsibility of one person in the organization—the that's message. It is the responsibility of all those directly or indirectly involved in the production of an object or in the performance of a service. Unfortunately, something that is seen as everyone's responsibility will fall apart in the implementation process and become nobody's responsibility.
6. QUALITY CIRCLES AND QUALITY IMPROVEMENT TEAMS A quality circle Usually, an informal community of people is made up of operators, supervisors, administrators, and so on who work together to develop ways of producing a product or providing a service. The philosophy behind quality circles is that in most situations people who are nearest to an activity are in a stronger position to add ideas that will lead to change. Improvement-seeking suggestions therefore come not just from managers but also from all other workers involved in the specific activity. A quality circle aims to transcend the obstacles that might exist within the existing organizational framework in order to promote a free exchange of ideas.
A quality improvement team Another way of finding viable solutions to the challenges of quality management. Typically, such teams are cross-functional in nature and include people from different disciplines. It is not rare to have a quality management team of staff from design and development, engineering, production, marketing and servicing.
7. CUSTOMER NEEDS AND MARKET SHARE In the manufacturing or service sector, pleasing customers—both internal and external—is necessary for growth and improving market share. An significant part of the design quality process is the recognition of consumer needs and wishes. These consumer needs can be grouped into three broad categories that are critical to quality, critical to fulfilment and cost-critical. Not all needs are of the same value to the consumer. In addition, some are articulated, while others are taken for granted.
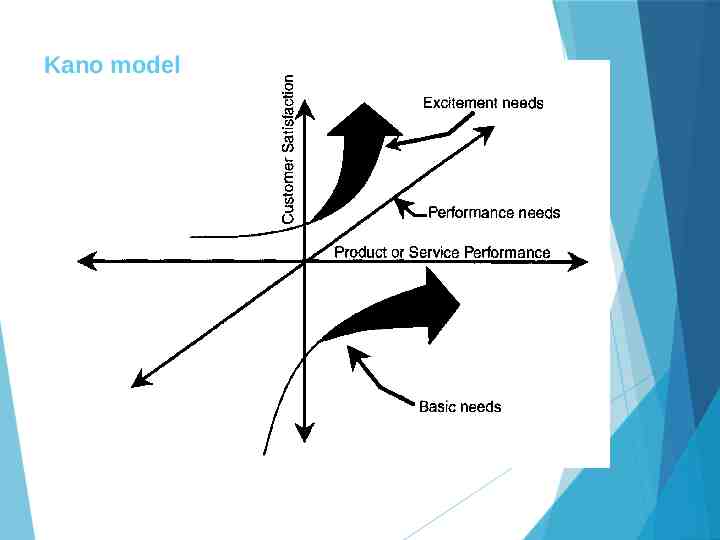
Kano Model Noriaki Kano, a Japanese consultant, Established a model relating to design characteristics to consumer satisfaction. Customer needs or desires can be classified into three priority categories: Essential needs Efficiency needs Excitement needs Simple needs are those which are taken for granted by the consumer. Responding to these needs might not steeply increase customer satisfaction; but failing to satisfy them will certainly cause dissatisfaction.
Kano model
Quality assurance and control Quality assurance Lec. 4 3rd Grade – Fall Semester 2021-2022 Goran N. Saleh / Assisst. lec [email protected] 10/11/2021
8. Total Quality System Performance is the obligation of everyone. This means that detailed plans should be developed to explain the specific roles of the different units, protocols should be identified to verify their compliance with the plans, and remedial steps should be proposed in the event of a difference between performance and norm. The quality assurance role, as defined above, monitors the system.
9. QUALITY AND RELIABILITY Reliability refers to the ability of a product to work effectively for a given period of time. Reliability is connected to the idea of performance consistency. Since the user has the ultimate say on the acceptability of a product or service, the better the performance over a given timeframe, the higher the reliability and the higher the level of customer satisfaction. Achieving acceptable levels of reliability requires thorough consideration in the design process of the product. Review of data collected on a timely basis during product performance keeps the design and production parameters up to date so that the product can continue to operate in an appropriate manner. Reliability is designed on the basis of design efficiency.
10. QUALITY IMPROVEMENT Efforts to minimize both process variability and development of non-compliant products should be ongoing, as quality assurance is a never-ending process. Whereas process control deals with the detection and removal of special causes (those for which an observable purpose can be determined) that push the system out of control (e.g. tool wear, operator fatigue, weak raw materials),
Quality improvement relates to the detection and elimination of common causes.
Popular triggers are inherent in the mechanism and are still present. Their effect on production can be consistent with that of special causes. An example of a common trigger is the variability of the characteristics (say, the diameter) caused by the inherent capacity of the particular machinery used (say, the milling machine).
Special causes are controllable mainly by the operator, but the management needs the attention of common causes. For this purpose, quality enhancement may only take place through the mutual effort of the operator and the management, along with the management. Focus mainly on the latter
11. PRODUCT AND SERVICE COSTING In costing a product or service, the broad categories of direct and indirect costs come into play. Direct costs Indirect costs
Activity-Based Costing Activities are activities conducted by a specialized group or department, such as an organization's buying unit, also known as an operation or cost center. The types of transactions that produce costs are known as cost drivers.
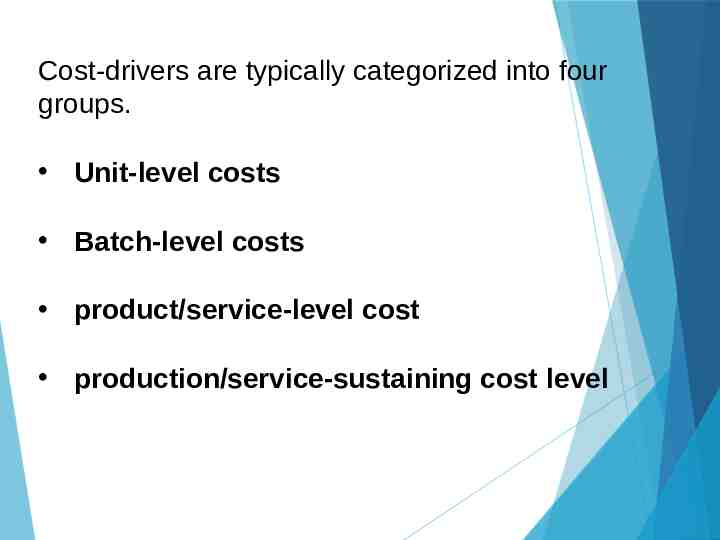
Cost-drivers are typically categorized into four groups. Unit-level costs Batch-level costs product/service-level cost production/service-sustaining cost level
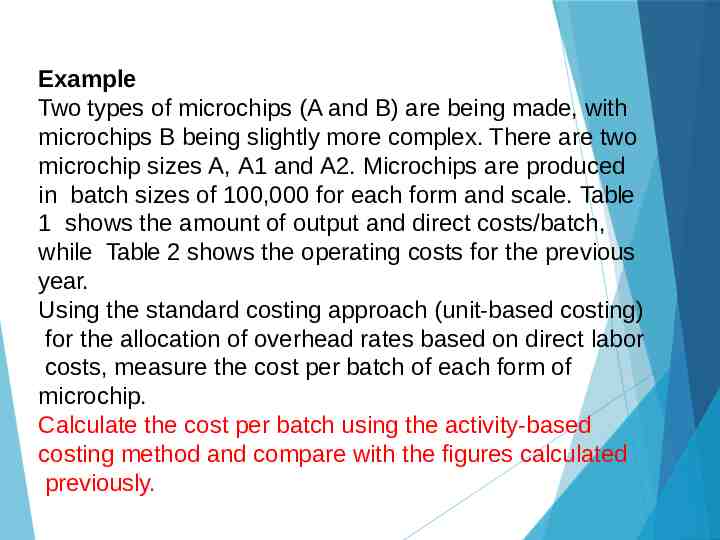
Example Two types of microchips (A and B) are being made, with microchips B being slightly more complex. There are two microchip sizes A, A1 and A2. Microchips are produced in batch sizes of 100,000 for each form and scale. Table 1 shows the amount of output and direct costs/batch, while Table 2 shows the operating costs for the previous year. Using the standard costing approach (unit-based costing) for the allocation of overhead rates based on direct labor costs, measure the cost per batch of each form of microchip. Calculate the cost per batch using the activity-based costing method and compare with the figures calculated previously.
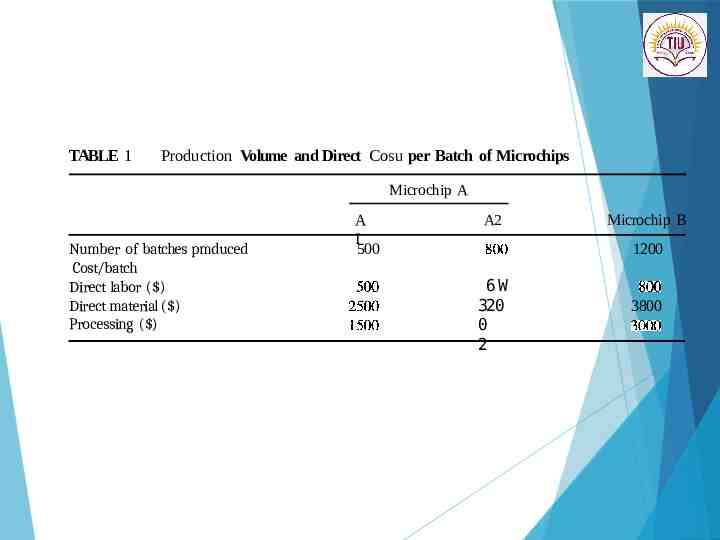
TABLE 1 Production Volume and Direct Cosu per Batch of Microchips Microchip A Number of batches pmduced Cost/batch Direct labor ( ) Direct material ( ) Processing ( ) A I 500 A2 Microchip B 1200 6W 320 0 2 3800
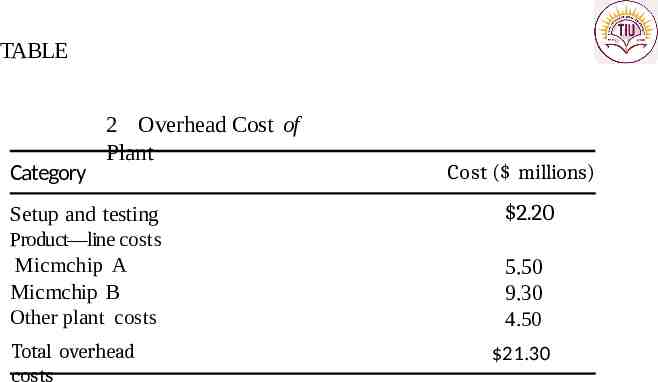
TABLE Category 2 Overhead Cost of Plant Setup and testing Product—line costs Micmchip A Micmchip B Other plant costs Total overhead costs Cost ( millions) 2.20 5.50 9.30 4.50 21.30
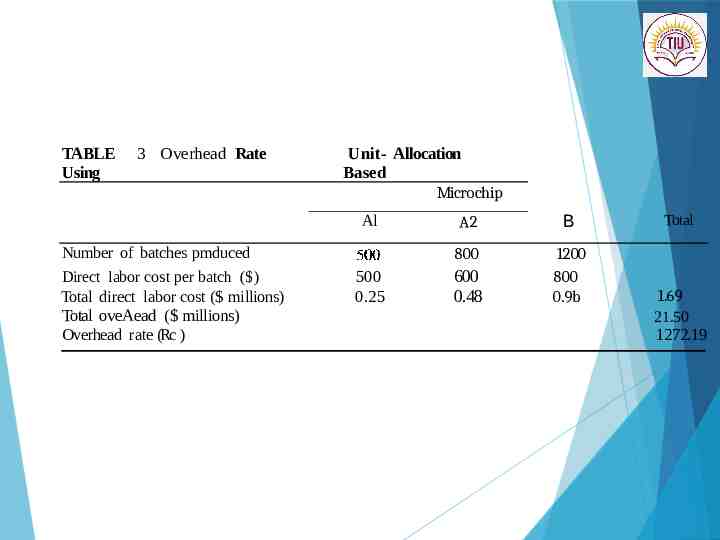
TABLE Using 3 Overhead Rate Unit- Allocation Based Microchip Al Number of batches pmduced Direct labor cost per batch ( ) Total direct labor cost ( millions) Total oveAead ( millions) Overhead rate (Rc ) 500 0.25 A2 B 800 1200 800 0.9b 600 0.48 Total 1.69 21.50 1272.19
Solution Second, the unit-based allocation system is illustrated. The total direct labor cost is used on the basis of which the overhead rate is calculated using the ratio of the total overhead to the total direct labor cost. This standard overhead rate is then applied to each type and size of microchip to decide the overhead cost assignment. Subsequently, the unit cost shall be measured. Table 3 shows the estimation of the common overhead rate.
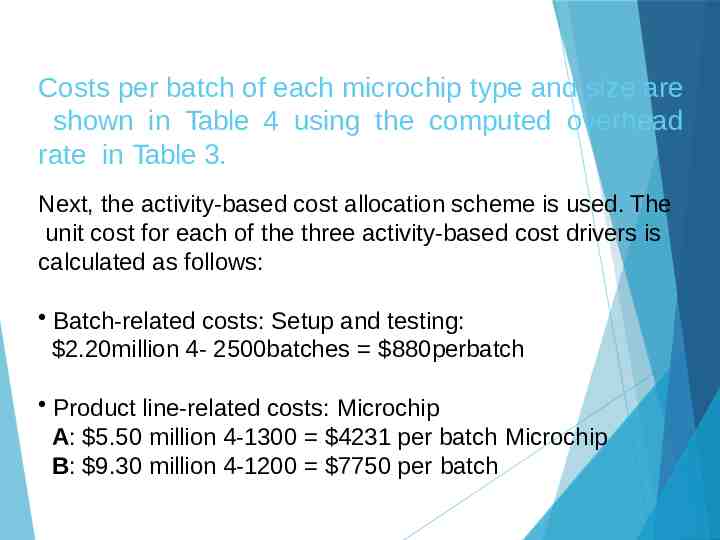
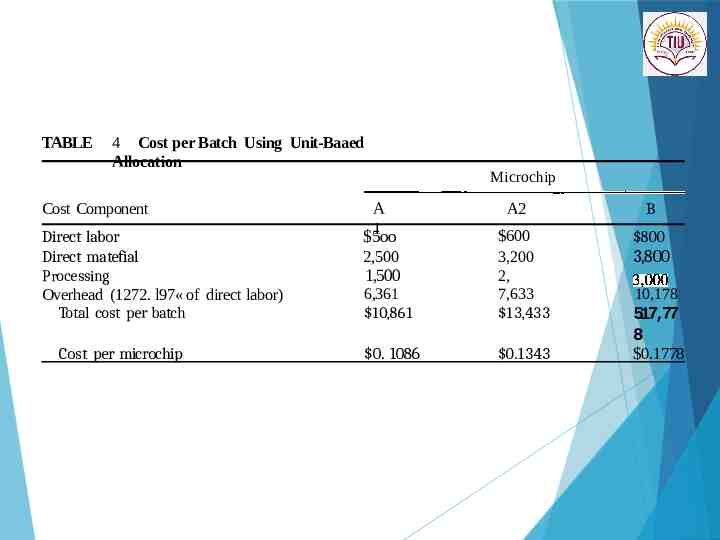
Costs per batch of each microchip type and size are shown in Table 4 using the computed overhead rate in Table 3. Next, the activity-based cost allocation scheme is used. The unit cost for each of the three activity-based cost drivers is calculated as follows: Batch-related costs: Setup and testing: 2.20million 4- 2500batches 880perbatch Product line-related costs: Microchip A: 5.50 million 4-1300 4231 per batch Microchip B: 9.30 million 4-1200 7750 per batch
TABLE 4 Cost per Batch Using Unit-Baaed Allocation Cost Component Direct labor Direct matefial Microchip A 1 5oo A2 Processing 1,500 Overhead (1272. l97« of direct labor) Total cost per batch 6,361 10,861 600 3,200 2, 7,633 13,433 0. 1086 0.1343 Cost per microchip 2,500 B 800 3,800 10,178 517,77 8 0.1778
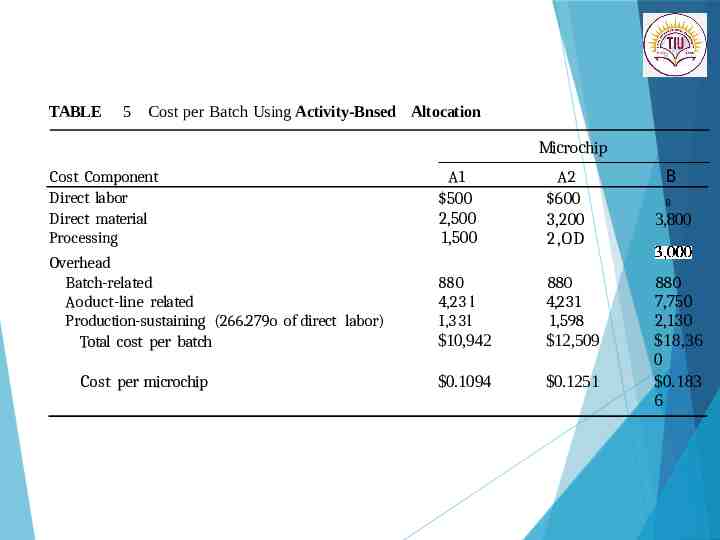
TABLE 5 Cost per Batch Using Activity-Bnsed Altocation Microchip Cost Component Direct labor Direct material Processing Overhead Batch-related Aoduct-line related Production-sustaining (266.279o of direct labor) Total cost per batch Cost per microchip A1 A2 500 2,500 1,500 600 3,200 2,OD 880 4,23 l I,33l 10,942 880 4,231 1,598 12,509 0.1094 0.1251 B 8 3,800 880 7,750 2,130 18,36 0 0.183 6
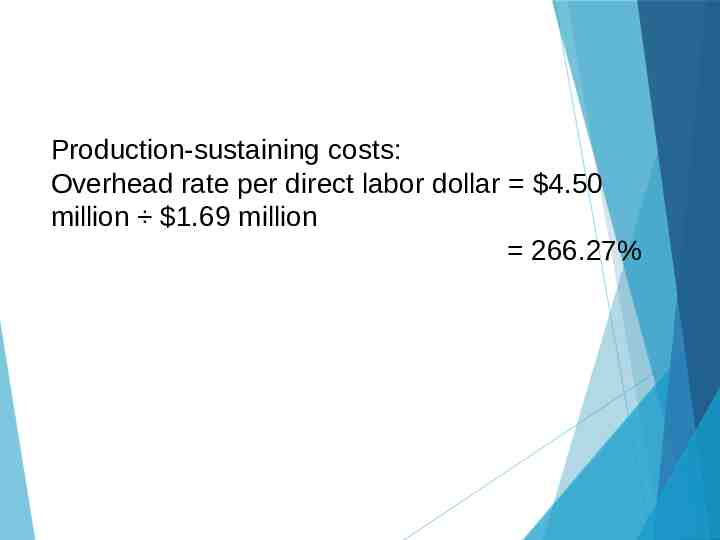
Production-sustaining costs: Overhead rate per direct labor dollar 4.50 million 1.69 million 266.27%
Tables 4 and 5 display variations between the two costing approaches per batch and the corresponding cost per microchip for each form and size of microchip. There are some assumptions that can be reached as follows. The unit-based (traditional costing approach tends to over-cost high-volume products within the category of product.