Project Risk Management: An Overview Andrew Westdorp Program
32 Slides589.00 KB
Project Risk Management: An Overview Andrew Westdorp Program Manger, IV&V Lockheed Martin (301)402-3924 [email protected]
Dilbert’s Take 2
Goals and Objectives Project Risk Risk Management Why Risk Management Risk Management Planning Identifying & Quantifying Risks Response Planning Risk Monitoring & Control Tools, Tricks and Helpful Links 3
What is Project Risk? An event that, if it occurs, causes either a positive or negative impact on a project Keys attributes of Risk – – – 4 Uncertainty Positive and Negative Cause and Consequence
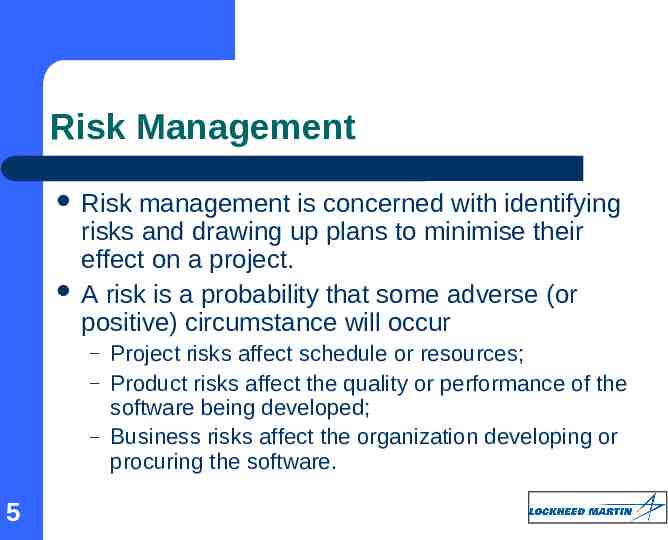
Risk Management Risk management is concerned with identifying risks and drawing up plans to minimise their effect on a project. A risk is a probability that some adverse (or positive) circumstance will occur – – – 5 Project risks affect schedule or resources; Product risks affect the quality or performance of the software being developed; Business risks affect the organization developing or procuring the software.
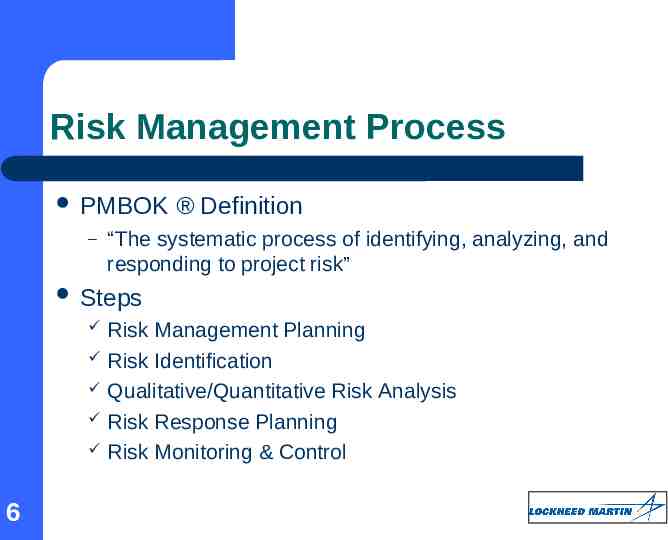
Risk Management Process PMBOK – Definition “The systematic process of identifying, analyzing, and responding to project risk” Steps 6 Risk Management Planning Risk Identification Qualitative/Quantitative Risk Analysis Risk Response Planning Risk Monitoring & Control
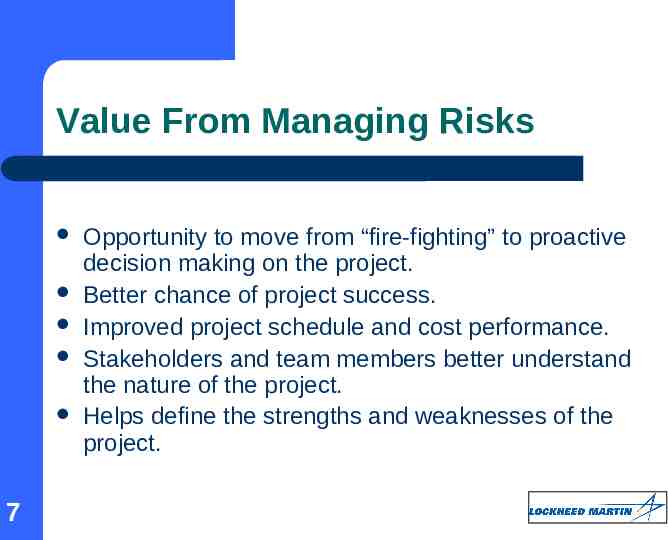
Value From Managing Risks 7 Opportunity to move from “fire-fighting” to proactive decision making on the project. Better chance of project success. Improved project schedule and cost performance. Stakeholders and team members better understand the nature of the project. Helps define the strengths and weaknesses of the project.
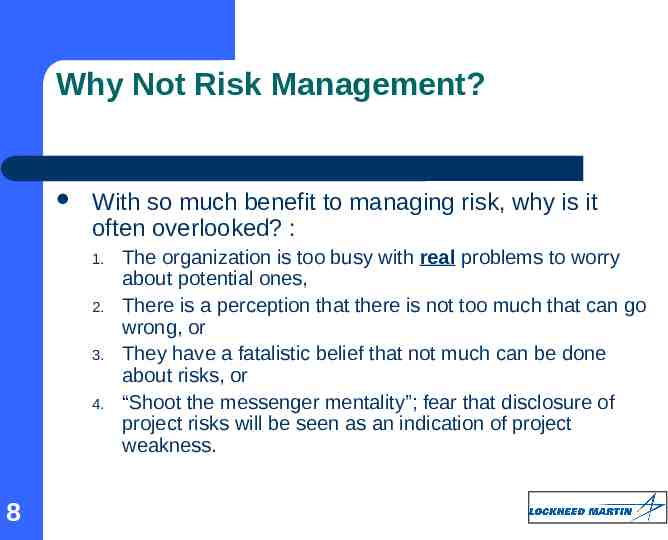
Why Not Risk Management? With so much benefit to managing risk, why is it often overlooked? : 1. 2. 3. 4. 8 The organization is too busy with real problems to worry about potential ones, There is a perception that there is not too much that can go wrong, or They have a fatalistic belief that not much can be done about risks, or “Shoot the messenger mentality”; fear that disclosure of project risks will be seen as an indication of project weakness.
Won’t identified risks make the project look bad? 9 All projects have risks, denial does not make them go away, it just makes you unprepared for them if they occur. Risk in itself is not bad, it is how well the project plans for and reacts to risks that counts. Formal risk management is a cornerstone of good project management. Stakeholder visibility into project risks makes it easier to get additional resources and organizational support when risks do occur.
Risk Management Planning Plan for the Planning – – Risk planning should be appropriate for the project Question you should ask: 1. 2. 3. 4. 5. 6. 10 How risky is the project? Is it a new technology or something your organization is familiar with? Do you have past projects to reference? What is the visibility of the project? How big is the project? How important is the project?
The Risk Management Plan What – should it include? How you will identify, quantify or qualify risk Methods – – – – – – 11 and tools Budget yes budget Who is doing what How often Risk categories, levels, and thresholds for action. Reporting requirements Monitoring, tracking and documenting strategies
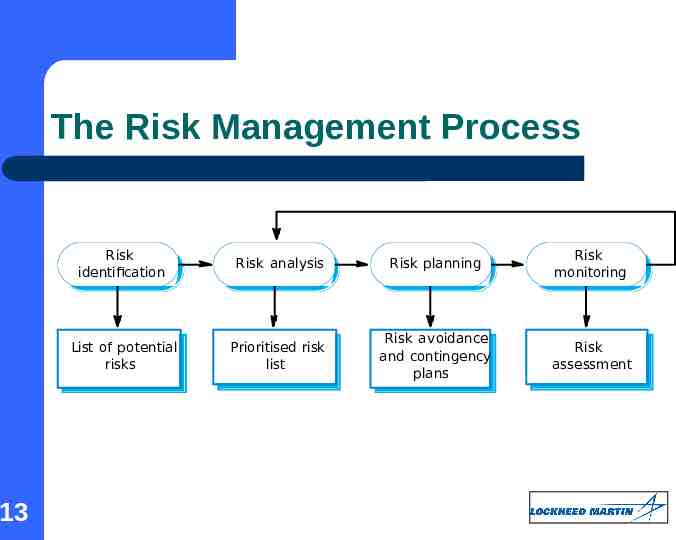
The Risk Management Process Risk – Identify project, product and business risks; Risk – 12 response planning Draw up plans to avoid or minimize the effects of the risk; Risk – analysis Assess the likelihood and consequences of these risks; Risk – identification monitoring Monitor the risks throughout the project;
The Risk Management Process 13 Risk identification Risk analysis Risk planning Risk monitoring List of potential risks Prioritised risk list Risk avoidance and contingency plans Risk assessment
Identifying Risk Continuous, Iterative Process What is it and what does it look like The sooner the better The more the merrier A fact is not a risk (it’s an issue). Be specific Don’t try to do everything at once 14
Identification Techniques Brainstorming Checklists Interviewing SWOT Analysis (strengths, weaknesses opportunities, threats) Delphi Technique (anonymous consensus building) Diagramming Techniques – – – 15 Cause & effect Flow Charts Influence Diagrams
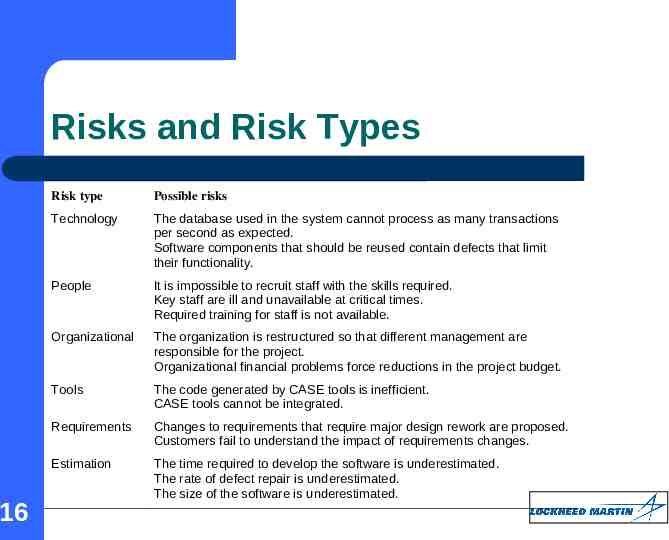
Risks and Risk Types 16 Risk type Possible risks Technology The database used in the system cannot process as many transactions per second as expected. Software components that should be reused contain defects that limit their functionality. People It is impossible to recruit staff with the skills required. Key staff are ill and unavailable at critical times. Required training for staff is not available. Organizational The organization is restructured so that different management are responsible for the project. Organizational financial problems force reductions in the project budget. Tools The code generated by CASE tools is inefficient. CASE tools cannot be integrated. Requirements Changes to requirements that require major design rework are proposed. Customers fail to understand the impact of requirements changes. Estimation The time required to develop the software is underestimated. The rate of defect repair is underestimated. The size of the software is underestimated.
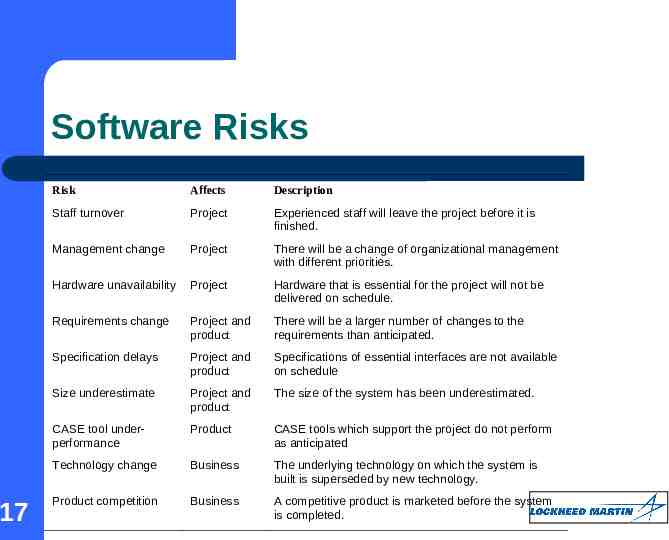
Software Risks 17 Risk Affects Description Staff turnover Project Experienced staff will leave the project before it is finished. Management change Project There will be a change of organizational management with different priorities. Hardware unavailability Project Hardware that is essential for the project will not be delivered on schedule. Requirements change Project and product There will be a larger number of changes to the requirements than anticipated. Specification delays Project and product Specifications of essential interfaces are not available on schedule Size underestimate Project and product The size of the system has been underestimated. CASE tool underperformance Product CASE tools which support the project do not perform as anticipated Technology change Business The underlying technology on which the system is built is superseded by new technology. Product competition Business A competitive product is marketed before the system is completed.
Risk Analysis Assess probability, seriousness, and urgency of each risk. Probability may be very low, low, moderate, high or very high. Risk effects might be catastrophic, serious, tolerable or insignificant. Urgency might be immediate, short term, or long term. 18
Analyzing Risk - Qualitative Subjective Educated Guess High, Medium, Low Red, Yellow, Green 1-10 Prioritized/Ranked list of ALL identified risks First step in risk analysis! 19
Risk Analysis - Quantitative 20 Numerical/Statistical Analysis Determines probability of occurrence and consequences of risks Should be focused to highest risks as determined by Qualitative Risk Analysis and Risk Threshold
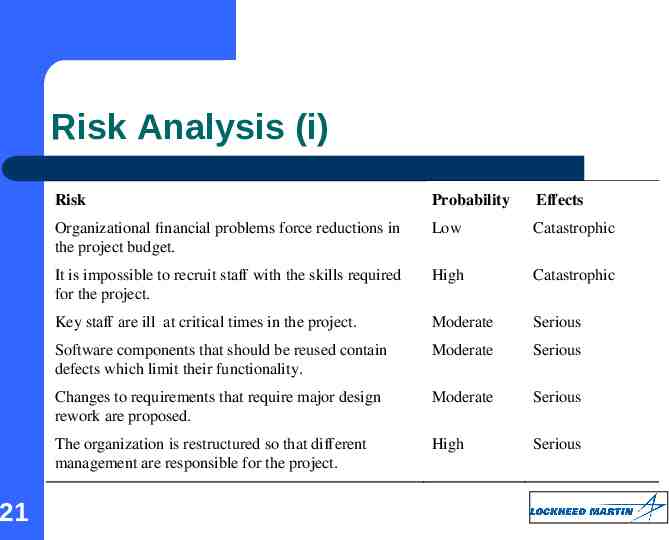
Risk Analysis (i) 21 Risk Probability Effects Organizational financial problems force reductions in the project budget. Low Catastrophic It is impossible to recruit staff with the skills required for the project. High Catastrophic Key staff are ill at critical times in the project. Moderate Serious Software components that should be reused contain defects which limit their functionality. Moderate Serious Changes to requirements that require major design rework are proposed. Moderate Serious The organization is restructured so that different management are responsible for the project. High Serious
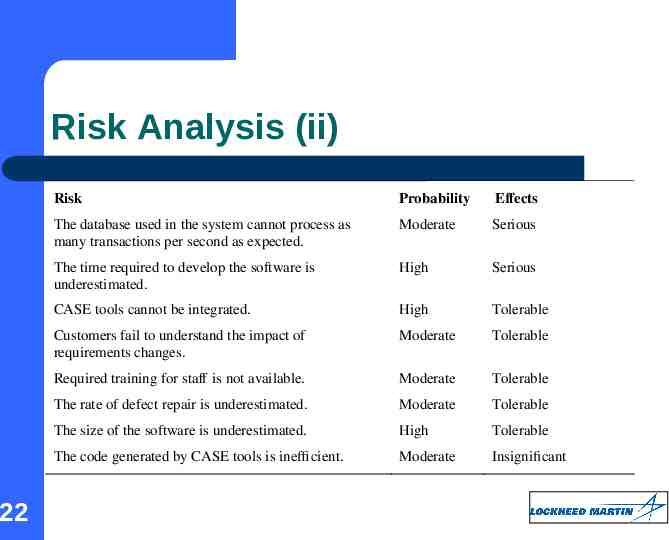
Risk Analysis (ii) 22 Risk Probability Effects The database used in the system cannot process as many transactions per second as expected. Moderate Serious The time required to develop the software is underestimated. High Serious CASE tools cannot be integrated. High Tolerable Customers fail to understand the impact of requirements changes. Moderate Tolerable Required training for staff is not available. Moderate Tolerable The rate of defect repair is underestimated. Moderate Tolerable The size of the software is underestimated. High Tolerable The code generated by CASE tools is inefficient. Moderate Insignificant
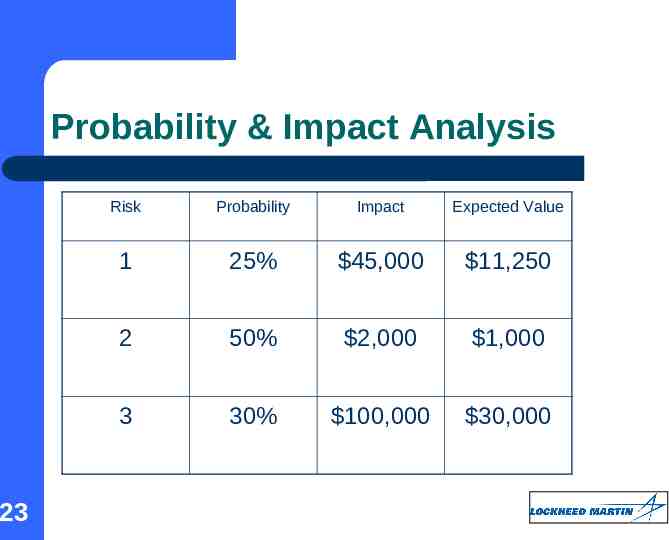
Probability & Impact Analysis 23 Risk Probability Impact Expected Value 1 25% 45,000 11,250 2 50% 2,000 1,000 3 30% 100,000 30,000
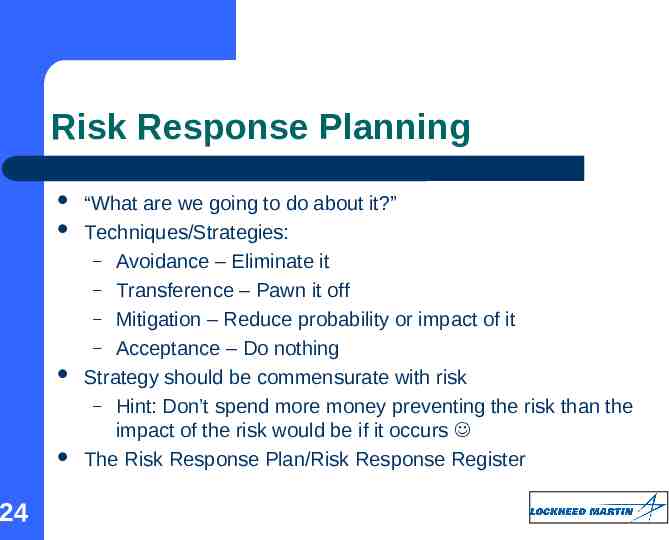
Risk Response Planning 24 “What are we going to do about it?” Techniques/Strategies: – Avoidance – Eliminate it – Transference – Pawn it off – Mitigation – Reduce probability or impact of it – Acceptance – Do nothing Strategy should be commensurate with risk – Hint: Don’t spend more money preventing the risk than the impact of the risk would be if it occurs The Risk Response Plan/Risk Response Register
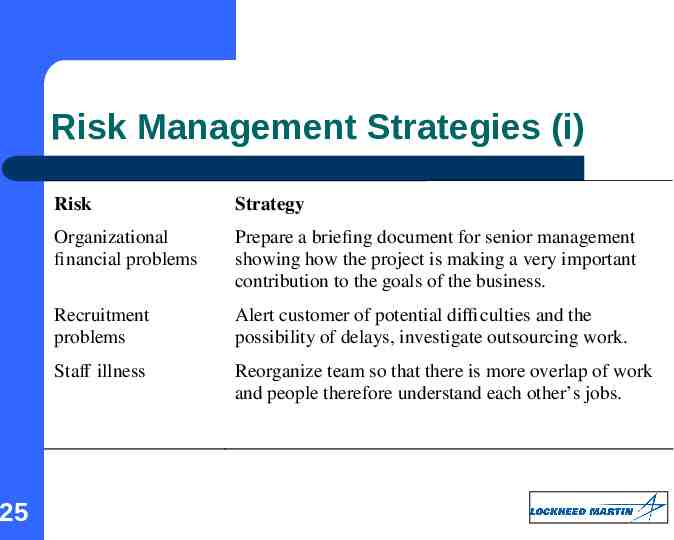
Risk Management Strategies (i) 25 Risk Strategy Organizational financial problems Prepare a briefing document for senior management showing how the project is making a very important contribution to the goals of the business. Recruitment problems Alert customer of potential difficulties and the possibility of delays, investigate outsourcing work. Staff illness Reorganize team so that there is more overlap of work and people therefore understand each other’s jobs.
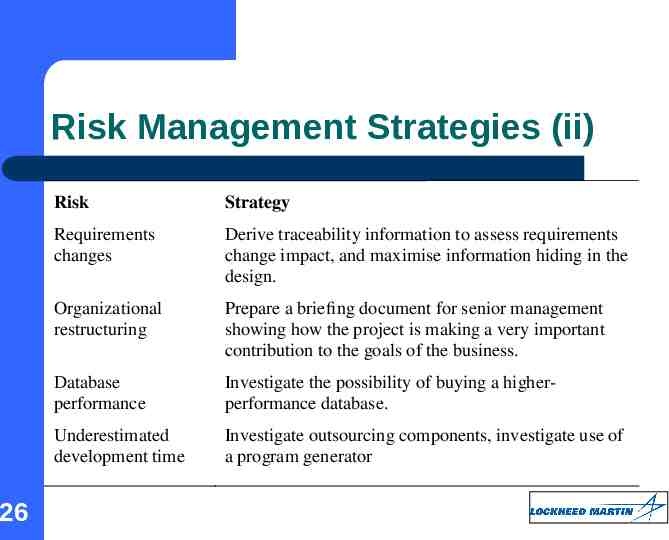
Risk Management Strategies (ii) 26 Risk Strategy Requirements changes Derive traceability information to assess requirements change impact, and maximise information hiding in the design. Organizational restructuring Prepare a briefing document for senior management showing how the project is making a very important contribution to the goals of the business. Database performance Investigate the possibility of buying a higherperformance database. Underestimated development time Investigate outsourcing components, investigate use of a program generator
Risk Monitoring Assess each identified risk regularly to decide whether or not it is becoming less or more probable. Also assess whether the effects of the risk have changed. Each key risk should be discussed at management progress meetings. 27
Risk Monitoring & Control Continuous, Iterative Process Done right the risk impact will be minimized: – – – – – Someone IS responsible Watch for risk triggers Communicate Communicate Communicate Take corrective action - Execute Re-evaluate and look for new risk constantly Tools: – – 28 Risk Reviews Risk Audits
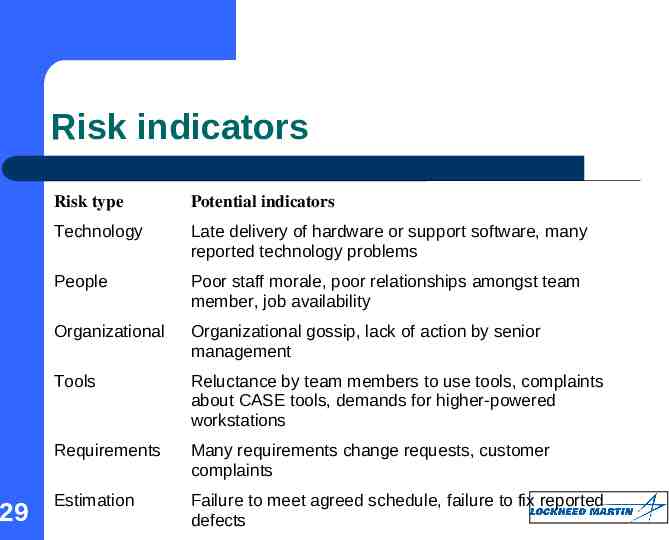
Risk indicators 29 Risk type Potential indicators Technology Late delivery of hardware or support software, many reported technology problems People Poor staff morale, poor relationships amongst team member, job availability Organizational Organizational gossip, lack of action by senior management Tools Reluctance by team members to use tools, complaints about CASE tools, demands for higher-powered workstations Requirements Many requirements change requests, customer complaints Estimation Failure to meet agreed schedule, failure to fix reported defects
Tools & Tricks Risk Identification Spreadsheet Risk log Spreadsheet Templates Make your own 30
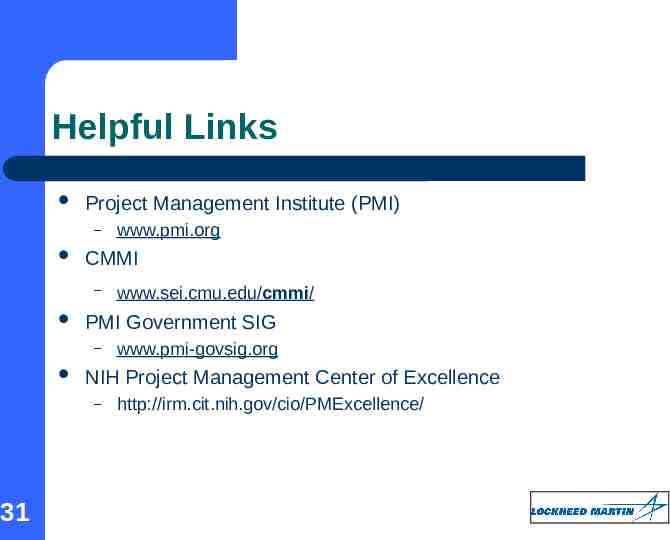
Helpful Links Project Management Institute (PMI) – CMMI – www.pmi-govsig.org NIH Project Management Center of Excellence – 31 www.sei.cmu.edu/cmmi/ PMI Government SIG – www.pmi.org http://irm.cit.nih.gov/cio/PMExcellence/
Questions? Thank You for the opportunity to present to you today! 32