OUTLINE 21 POPULATION GENETICS I. The New Synthesis A. Challenge


30 Slides1,020.00 KB
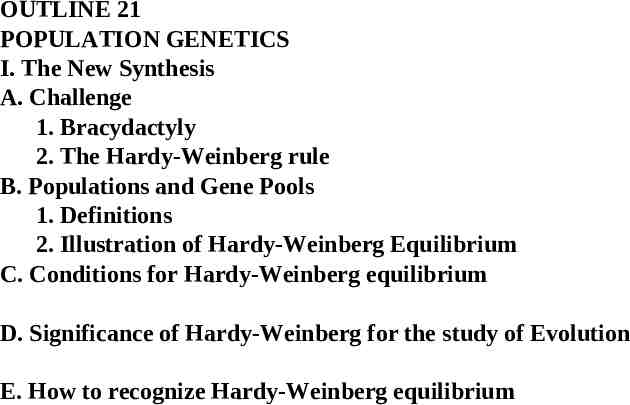
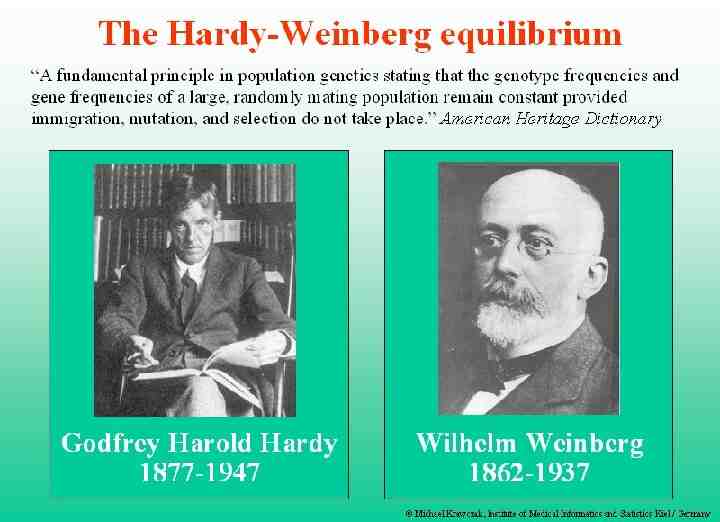
OUTLINE 21 POPULATION GENETICS I. The New Synthesis A. Challenge 1. Bracydactyly 2. The Hardy-Weinberg rule B. Populations and Gene Pools 1. Definitions 2. Illustration of Hardy-Weinberg Equilibrium C. Conditions for Hardy-Weinberg equilibrium D. Significance of Hardy-Weinberg for the study of Evolution E. How to recognize Hardy-Weinberg equilibrium
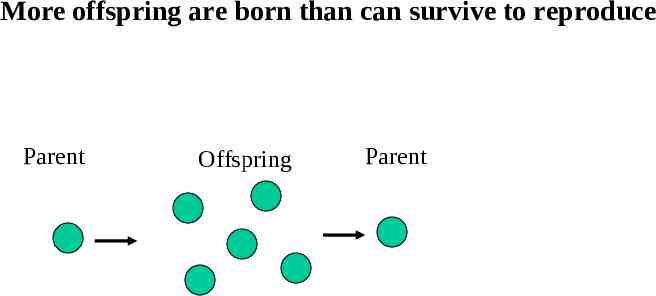
More offspring are born than can survive to reproduce Parent Offspring Parent
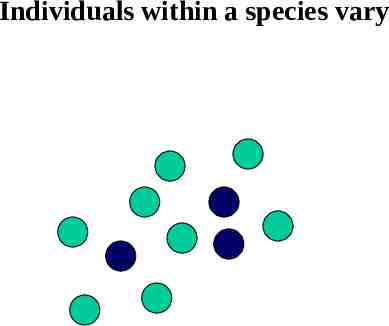
Individuals within a species vary
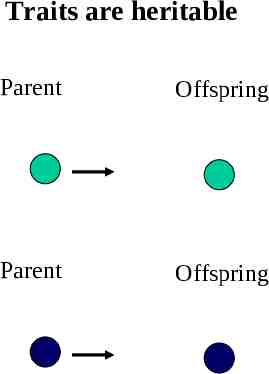
Traits are heritable Parent Offspring Parent Offspring
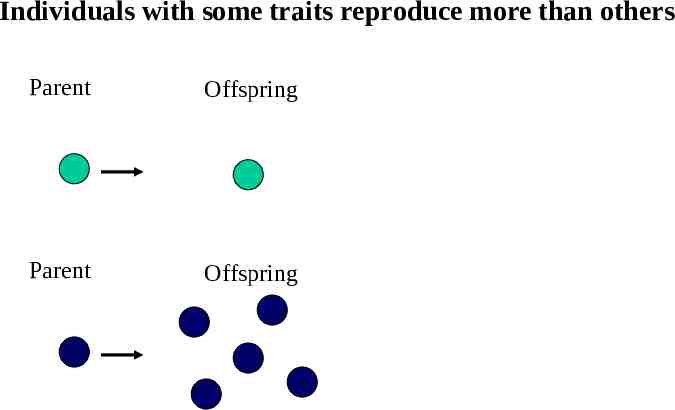
Individuals with some traits reproduce more than others Parent Offspring Parent Offspring
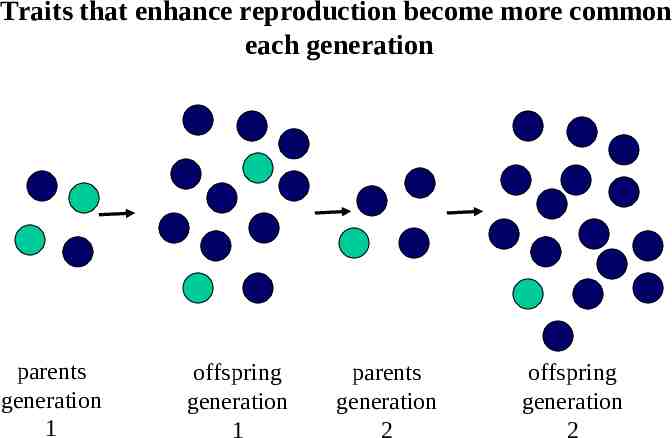
Traits that enhance reproduction become more common each generation parents generation 1 offspring generation 1 parents generation 2 offspring generation 2
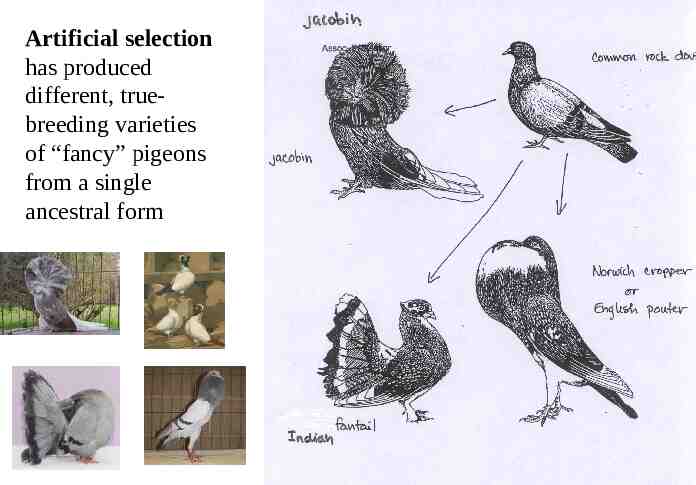
Artificial selection has produced different, truebreeding varieties of “fancy” pigeons from a single ancestral form
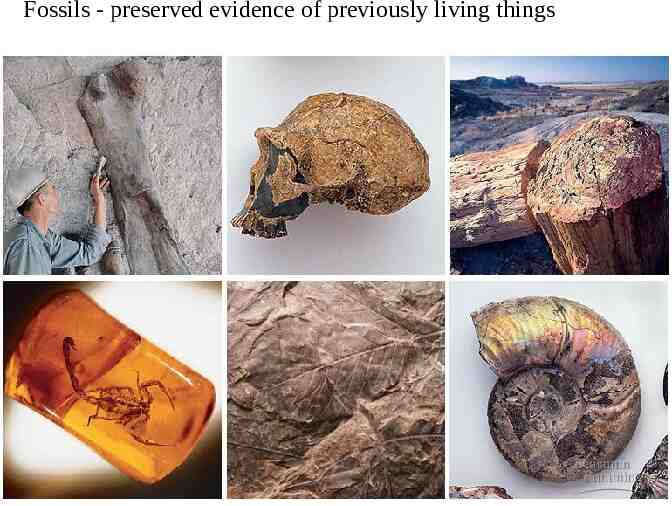
Fossils - preserved evidence of previously living things
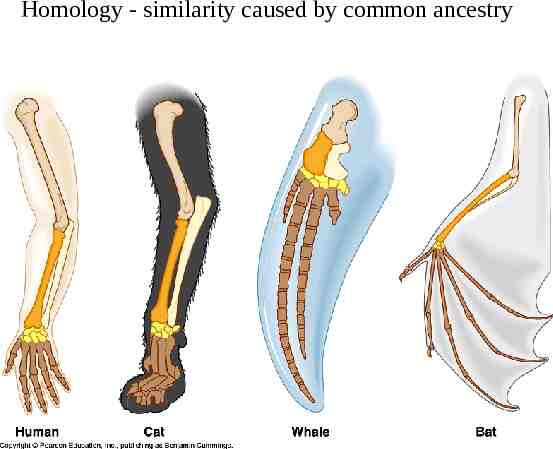
Homology - similarity caused by common ancestry
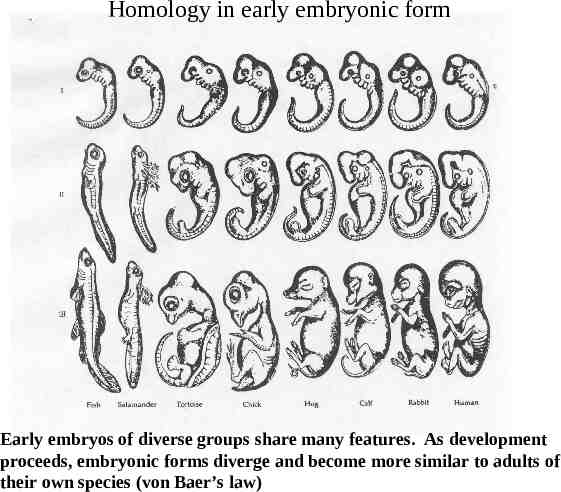
Homology in early embryonic form Early embryos of diverse groups share many features. As development proceeds, embryonic forms diverge and become more similar to adults of their own species (von Baer’s law)
The Paradox of Variation: Evolution requires natural selection, but natural selection eliminates variation.
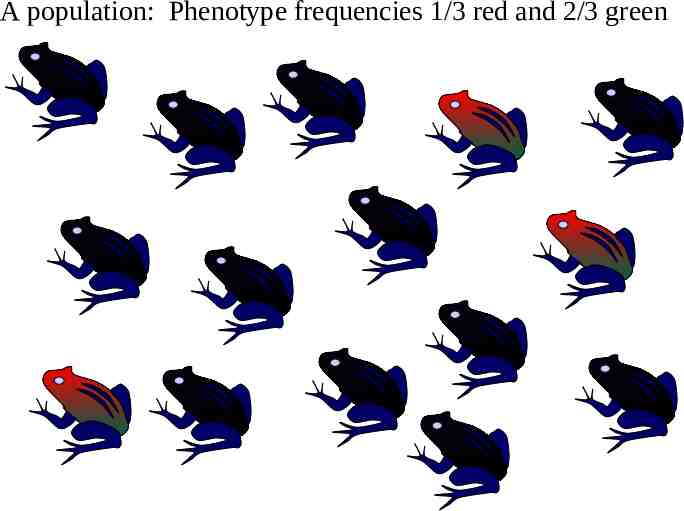
A population: Phenotype frequencies 1/3 red and 2/3 green
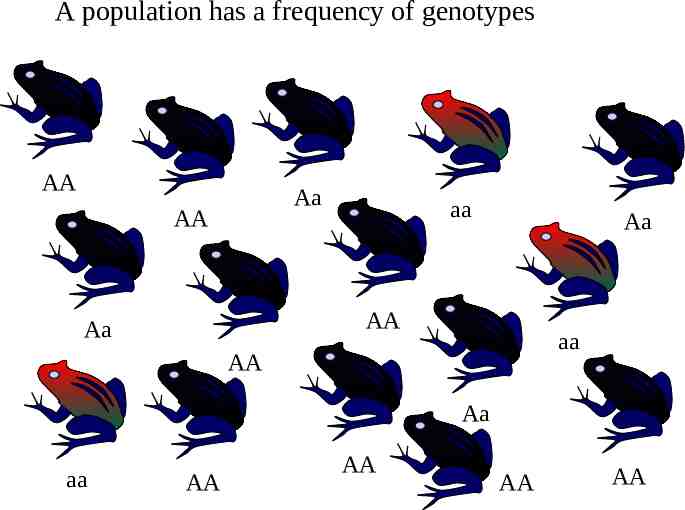
A population has a frequency of genotypes AA Aa AA aa Aa AA Aa aa AA Aa aa AA AA AA AA
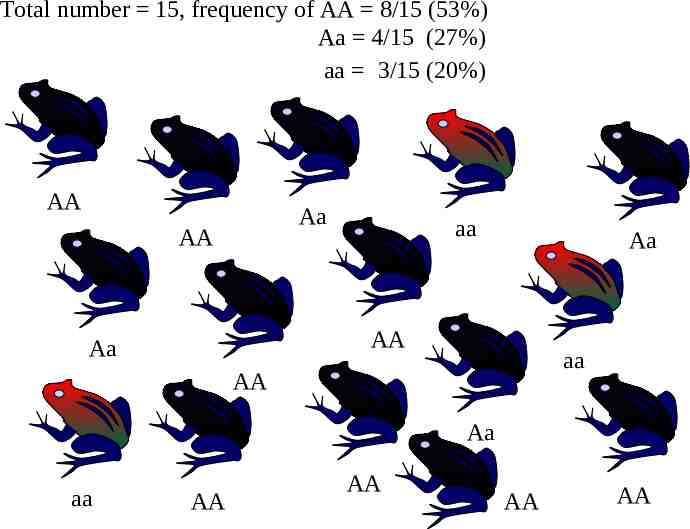
Total number 15, frequency of AA 8/15 (53%) Aa 4/15 (27%) aa 3/15 (20%) AA Aa AA aa Aa AA Aa aa AA Aa aa AA AA AA AA
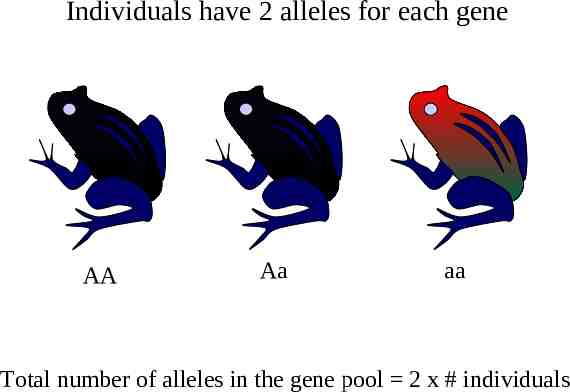
Individuals have 2 alleles for each gene AA Aa aa Total number of alleles in the gene pool 2 x # individuals
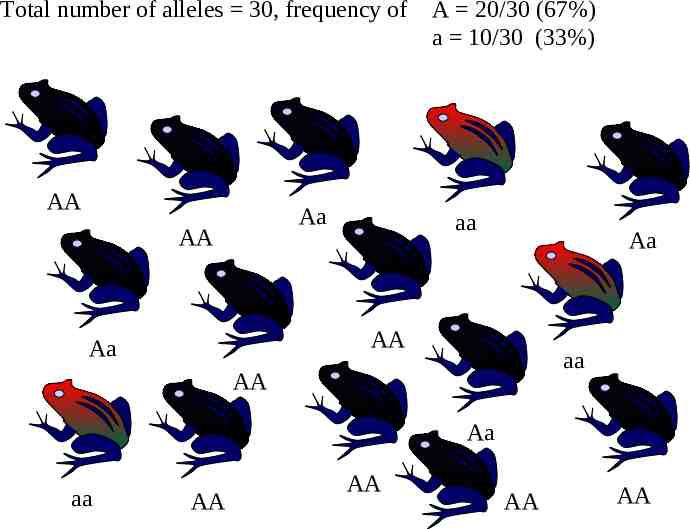
A population has a frequency of alleles AA Aa Aa aa AA AA aa Aa AA Aa aa AA AA AA
Total number of alleles 30, frequency of AA Aa AA A 20/30 (67%) a 10/30 (33%) aa Aa AA Aa aa AA Aa aa AA AA AA AA
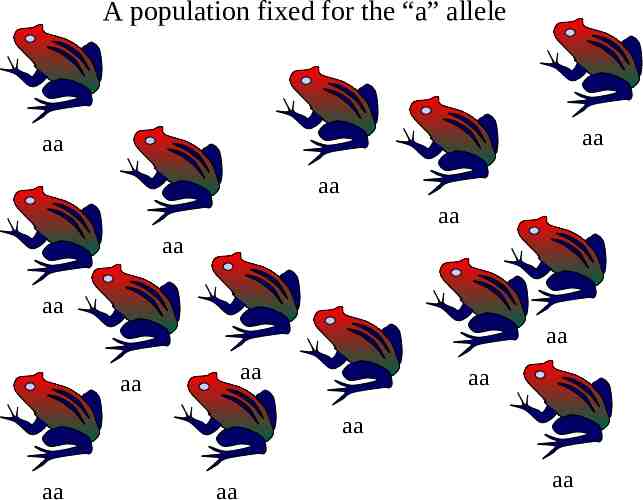
A population fixed for the “a” allele aa aa aa aa aa aa aa aa aa aa aa aa aa aa
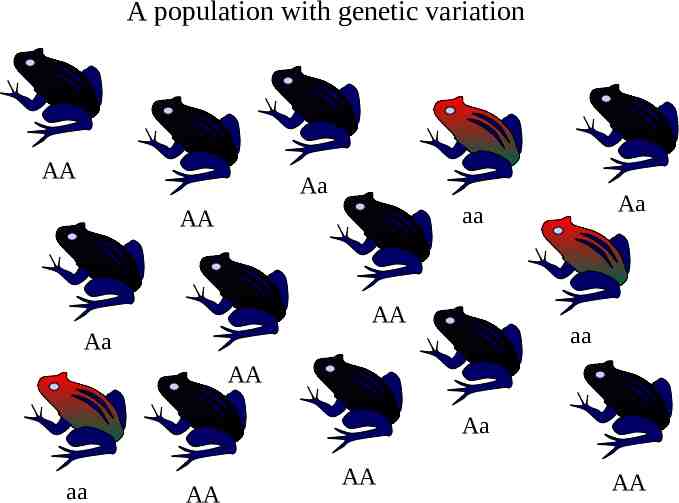
A population with genetic variation AA Aa Aa aa AA AA aa Aa AA Aa aa AA AA AA
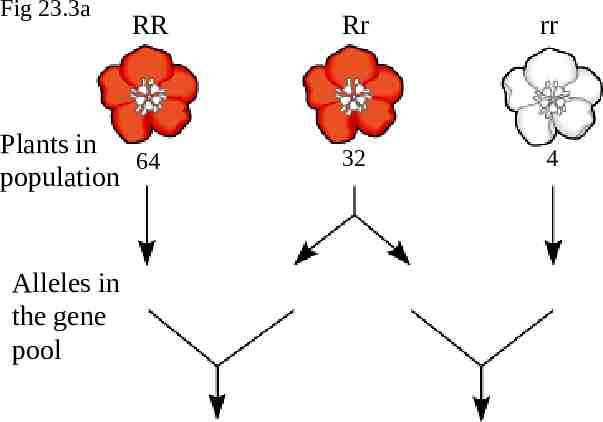
Fig 23.3a RR Plants in 64 population Alleles in the gene pool Rr rr 32 4
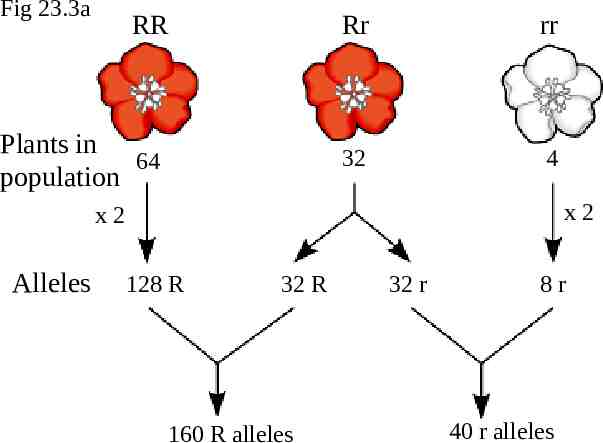
Fig 23.3a RR Plants in 64 population Rr rr 32 4 x2 x2 Alleles 128 R 32 R 160 R alleles 32 r 8r 40 r alleles
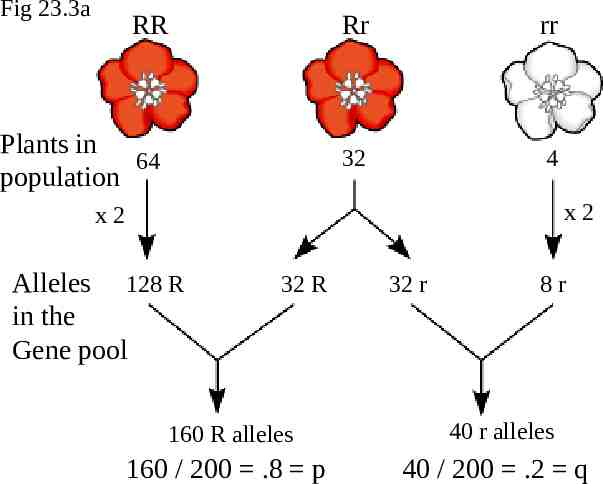
Fig 23.3a RR Plants in 64 population Rr rr 32 4 x2 x2 Alleles 128 R in the Gene pool 32 R 32 r 8r 160 R alleles 40 r alleles 160 / 200 .8 p 40 / 200 .2 q
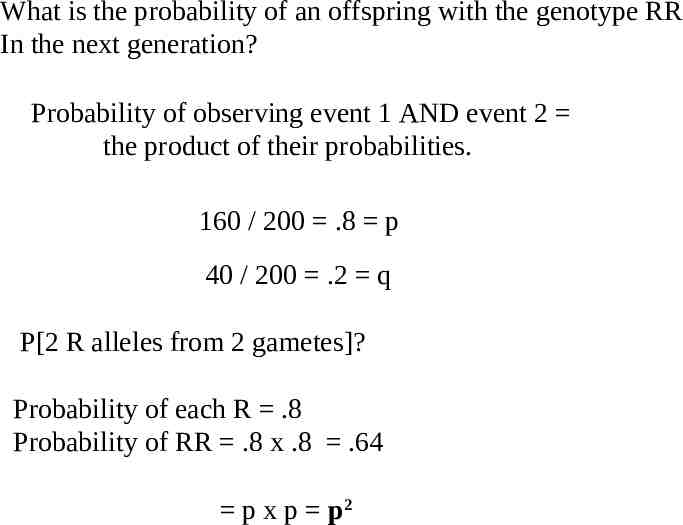
What is the probability of an offspring with the genotype RR In the next generation? Probability of observing event 1 AND event 2 the product of their probabilities. 160 / 200 .8 p 40 / 200 .2 q P[2 R alleles from 2 gametes]? Probability of each R .8 Probability of RR .8 x .8 .64 p x p p2
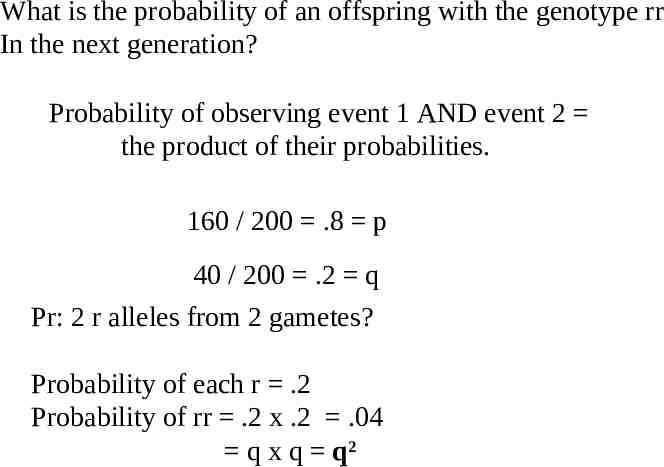
What is the probability of an offspring with the genotype rr In the next generation? Probability of observing event 1 AND event 2 the product of their probabilities. 160 / 200 .8 p 40 / 200 .2 q Pr: 2 r alleles from 2 gametes? Probability of each r .2 Probability of rr .2 x .2 .04 q x q q2
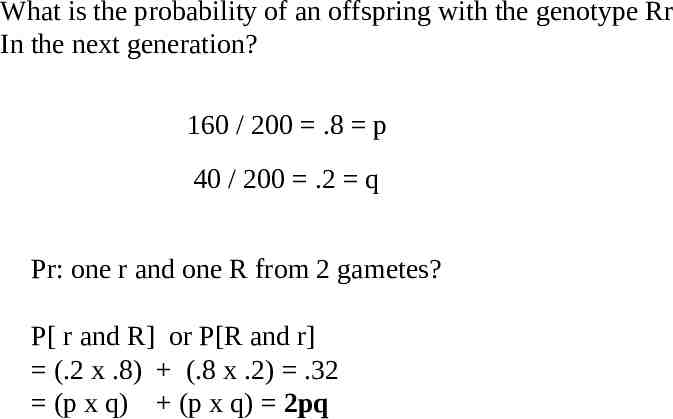
What is the probability of an offspring with the genotype Rr In the next generation? 160 / 200 .8 p 40 / 200 .2 q Pr: one r and one R from 2 gametes? P[ r and R] or P[R and r] (.2 x .8) (.8 x .2) .32 (p x q) (p x q) 2pq
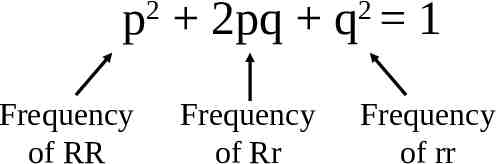
p2 2pq q2 1 Frequency of RR Frequency of Rr Frequency of rr
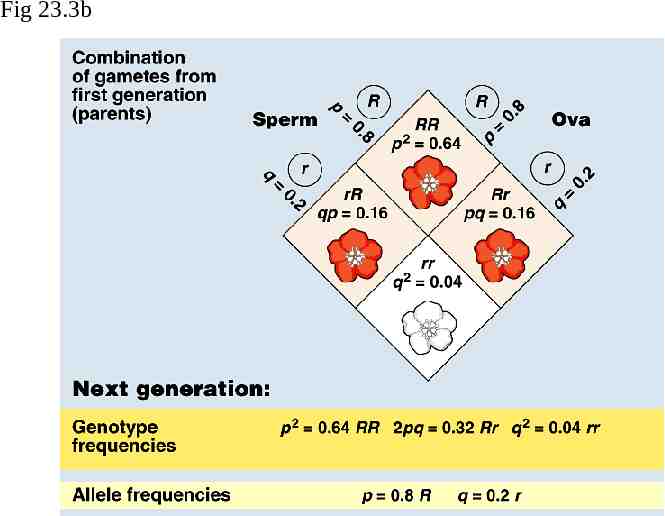
Fig 23.3b
Fig 23.3a RR Plants in 64 population Alleles in the gene pool Rr rr 32 4