MODULE 2: WARRANTY COST ANALYSIS Professor D.N.P. Murthy

31 Slides229.00 KB
MODULE 2: WARRANTY COST ANALYSIS Professor D.N.P. Murthy The University of Queensland Brisbane, Australia
WARRANTY COST ANALYSIS Modeling Warranty Costs Perspectives and Cost Bases Probabilistic Elements Cost Models for the FRW and PRW Other Cost Models Information Needs
WARRANTY MODELING Reasons for modeling Marketing (Sales) Economic (Cost) Engineering (Design) Operational (Servicing) Many disciplines involved
COST MODELS Costs depend on: Type of warranty Failure pattern of items Repairability Failure pattern of replaced or repaired items Incidental costs
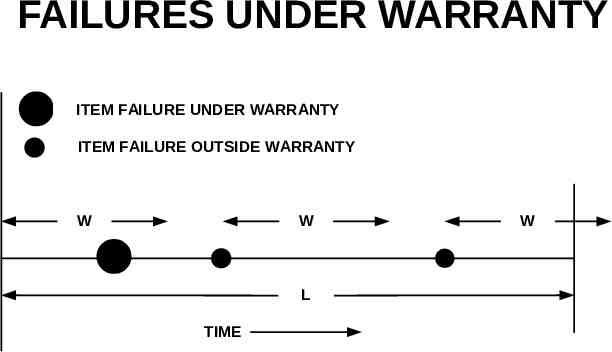
FAILURES Occur randomly Depend on Product characteristics Usage rate Age Maintenance Environmental factors
FAILURES UNDER WARRANTY ITEM FAILURE UNDER WARRANTY ITEM FAILURE OUTSIDE WARRANTY W W L TIME W
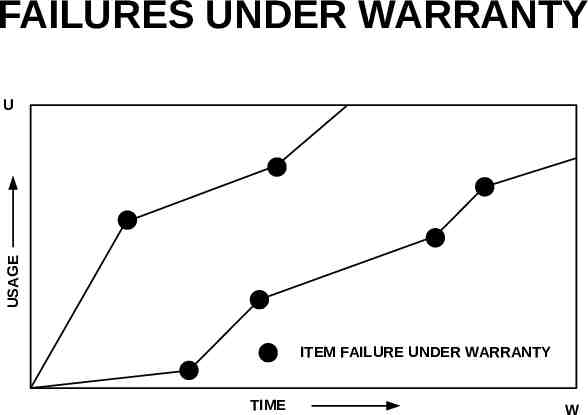
FAILURES UNDER WARRANTY USAGE U ITEM FAILURE UNDER WARRANTY TIME W
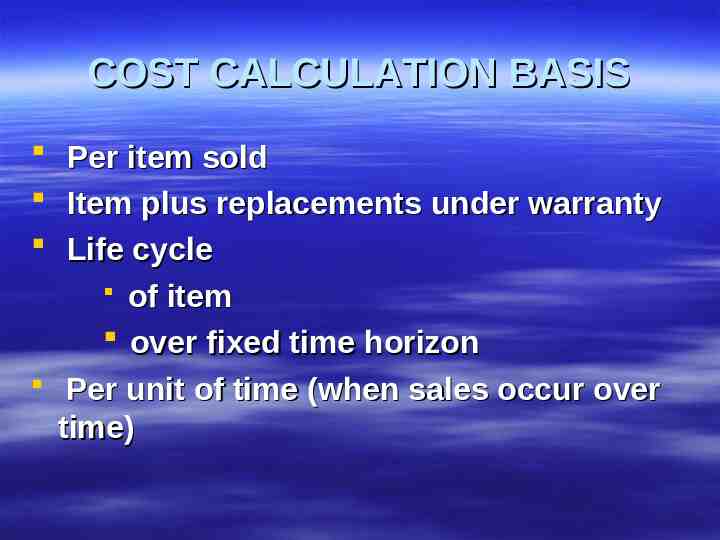
COST CALCULATION BASIS Per item sold Item plus replacements under warranty Life cycle of item over fixed time horizon Per unit of time (when sales occur over time)
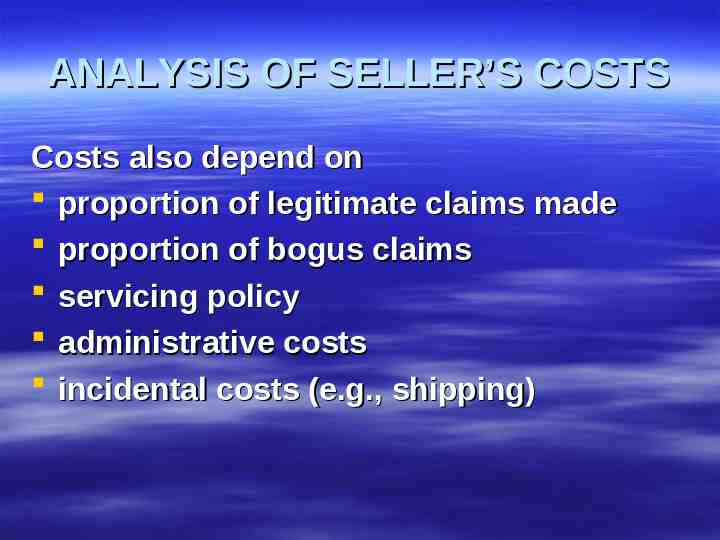
ANALYSIS OF SELLER’S COSTS Costs also depend on proportion of legitimate claims made proportion of bogus claims servicing policy administrative costs incidental costs (e.g., shipping)
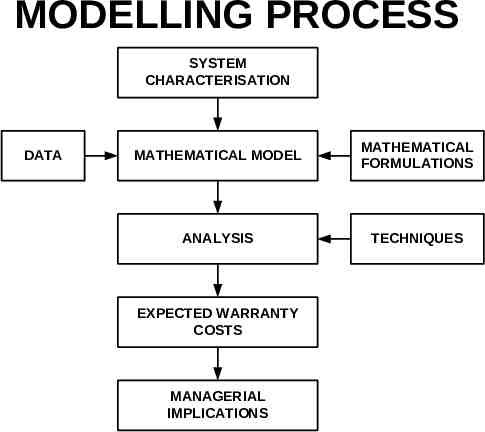
MODELLING PROCESS SYSTEM CHARACTERISATION DATA MATHEMATICAL MODEL MATHEMATICAL FORMULATIONS ANALYSIS TECHNIQUES EXPECTED WARRANTY COSTS MANAGERIAL IMPLICATIONS
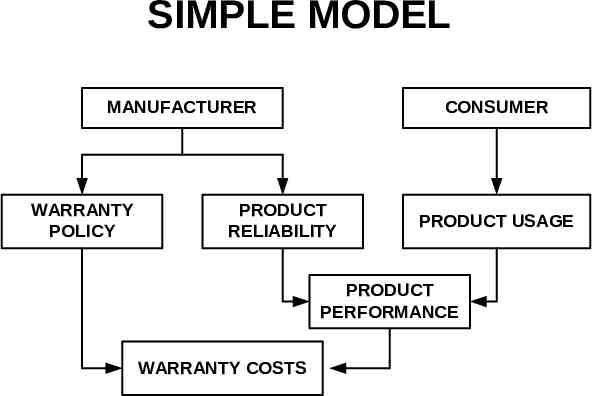
SIMPLE MODEL MANUFACTURER WARRANTY POLICY CONSUMER PRODUCT RELIABILITY PRODUCT USAGE PRODUCT PERFORMANCE WARRANTY COSTS
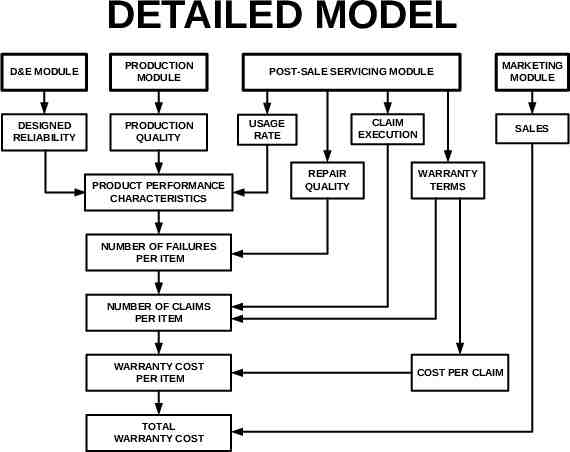
DETAILED MODEL D&E MODULE PRODUCTION MODULE DESIGNED RELIABILITY PRODUCTION QUALITY PRODUCT PERFORMANCE CHARACTERISTICS POST-SALE SERVICING MODULE MARKETING MODULE CLAIM EXECUTION USAGE RATE REPAIR QUALITY SALES WARRANTY TERMS NUMBER OF FAILURES PER ITEM NUMBER OF CLAIMS PER ITEM WARRANTY COST PER ITEM TOTAL WARRANTY COST COST PER CLAIM
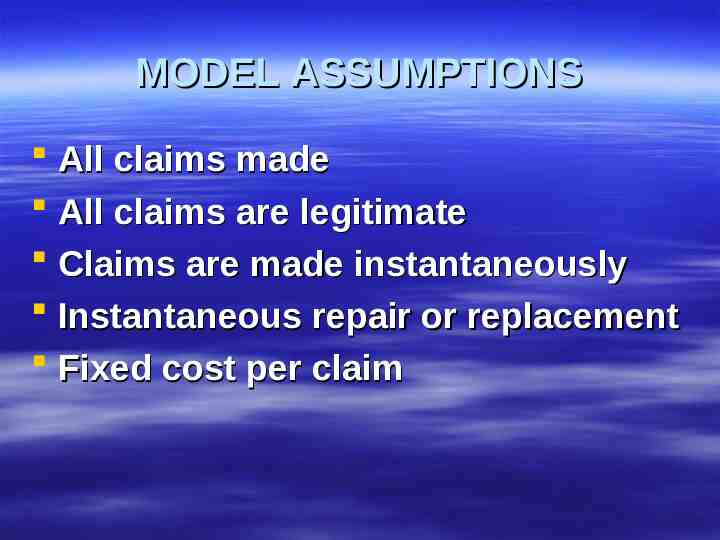
MODEL ASSUMPTIONS All claims made All claims are legitimate Claims are made instantaneously Instantaneous repair or replacement Fixed cost per claim
MODEL ASSUMPTIONS Identical items Independence (statistical) No brand switching All parameters known
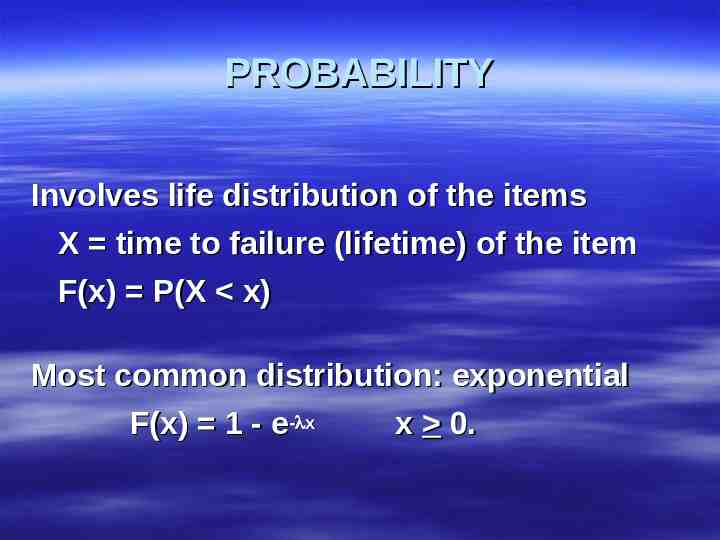
PROBABILITY Involves life distribution of the items X time to failure (lifetime) of the item F(x) P(X x) Most common distribution: exponential F(x) 1 - e- x x 0.
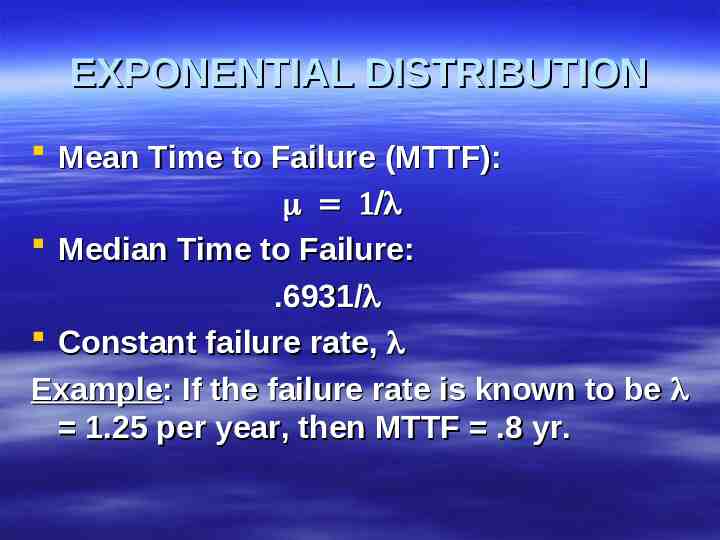
EXPONENTIAL DISTRIBUTION Mean Time to Failure (MTTF): Median Time to Failure: .6931/ Constant failure rate, Example: If the failure rate is known to be 1.25 per year, then MTTF .8 yr.
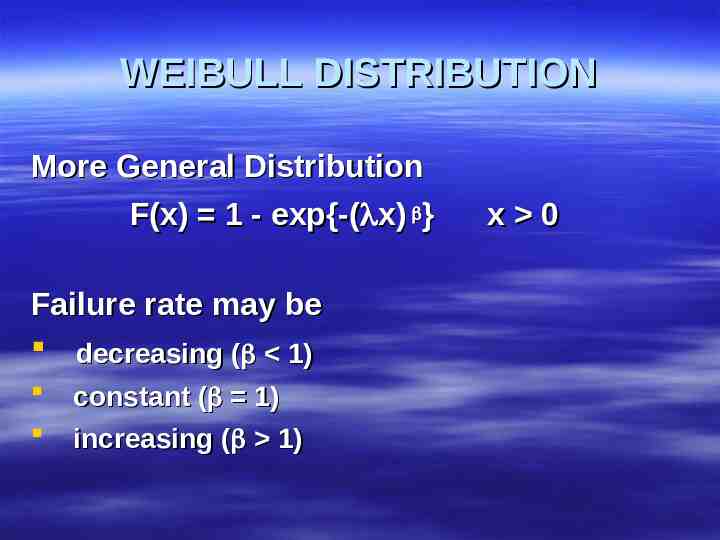
WEIBULL DISTRIBUTION More General Distribution F(x) 1 - exp{-( x) } Failure rate may be decreasing ( 1) constant ( 1) increasing ( 1) x 0
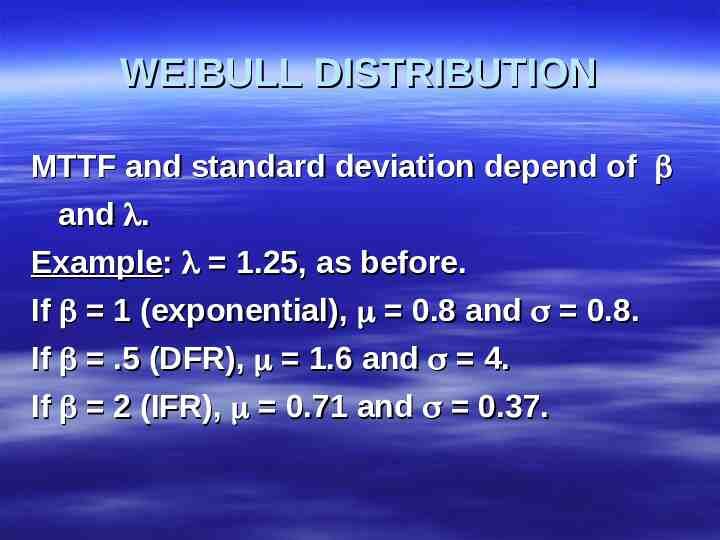
WEIBULL DISTRIBUTION MTTF and standard deviation depend of and . Example: 1.25, as before. If 1 (exponential), 0.8 and 0.8. If .5 (DFR), 1.6 and 4. If 2 (IFR), 0.71 and 0.37.
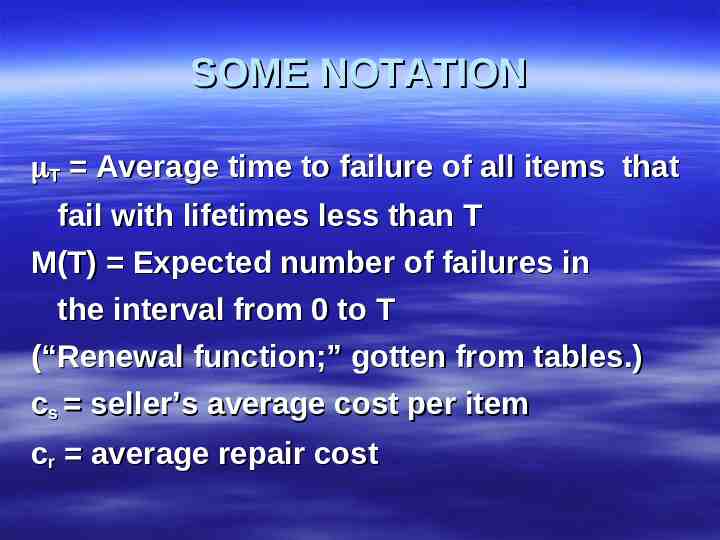
SOME NOTATION T Average time to failure of all items that fail with lifetimes less than T M(T) Expected number of failures in the interval from 0 to T (“Renewal function;” gotten from tables.) cs seller’s average cost per item cr average repair cost
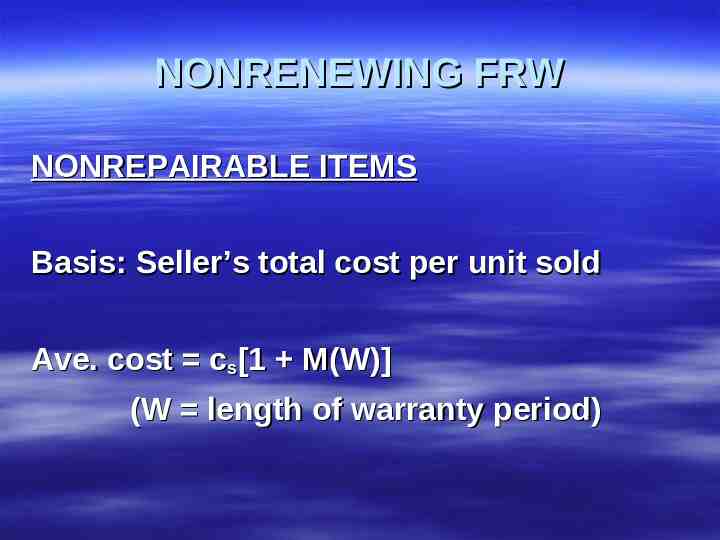
NONRENEWING FRW NONREPAIRABLE ITEMS Basis: Seller’s total cost per unit sold Ave. cost cs[1 M(W)] (W length of warranty period)
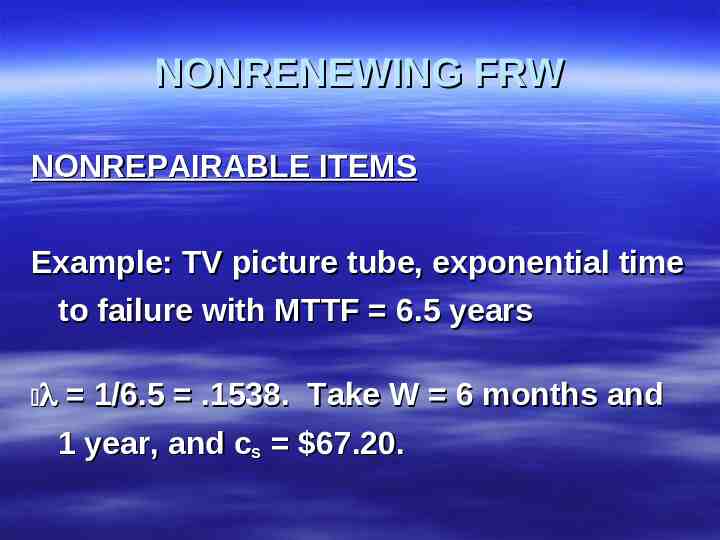
NONRENEWING FRW NONREPAIRABLE ITEMS Example: TV picture tube, exponential time to failure with MTTF 6.5 years 1/6.5 .1538. Take W 6 months and 1 year, and cs 67.20.
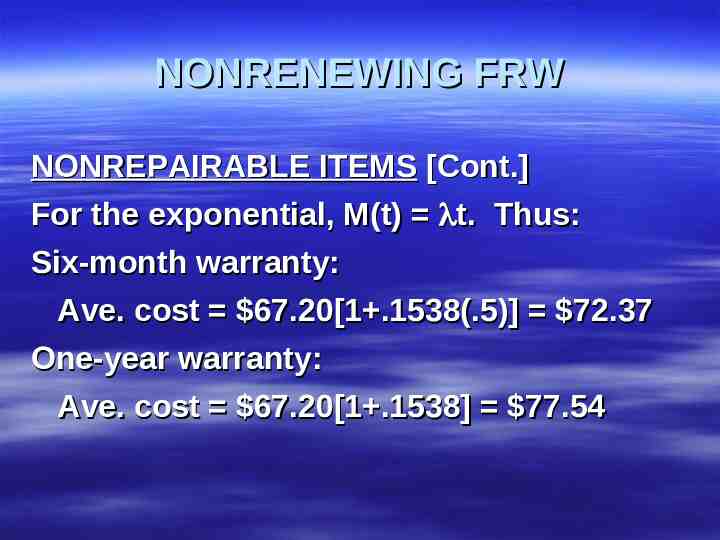
NONRENEWING FRW NONREPAIRABLE ITEMS [Cont.] For the exponential, M(t) t. Thus: Six-month warranty: Ave. cost 67.20[1 .1538(.5)] 72.37 One-year warranty: Ave. cost 67.20[1 .1538] 77.54
NONRENEWING FRW REPAIRABLE ITEMS Additional assumption: repaired items are “good-as-new” (i.e., have same failure distribution as new items). Ave. cost cs crM(W)
NONRENEWING PRW Equivalent to rebate form Non-repairable items cb buyer’s cost of item (selling price) Ave. cost to seller cs cb[F(W) - W/W] Formulas for W are needed. (See: Book on Warranty Cost Analysis)
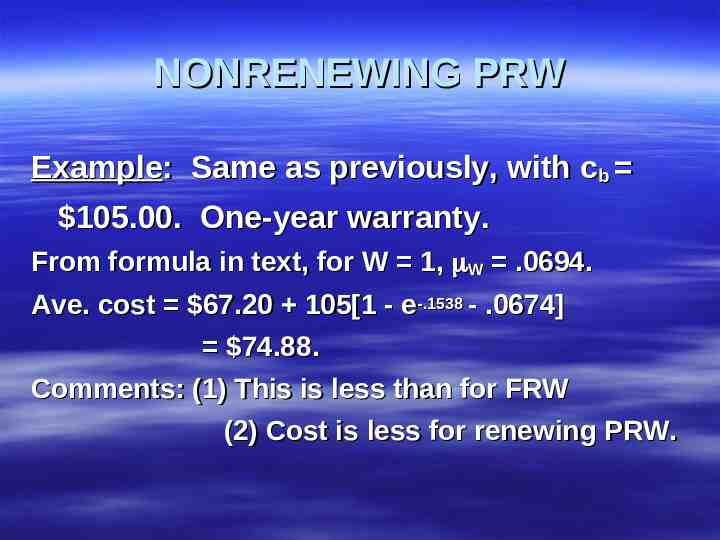
NONRENEWING PRW Example: Same as previously, with cb 105.00. One-year warranty. From formula in text, for W 1, W .0694. Ave. cost 67.20 105[1 - e-.1538 - .0674] 74.88. Comments: (1) This is less than for FRW (2) Cost is less for renewing PRW.
INFORMATION NEEDS Form of distribution Parameter values Type of warranty Rectification policy Other cost information
DATA MAY INCLUDE Test data Claims data Data on similar products Part and component data Vendor data Subjective information
OTHER COST MODELS Many other warranties Distributions other than exponential Two- and higher-dimensional versions Life-cycle cost models Other cost bases Discounting to present value Indifference pricing
REDUCING WARRANTY COSTS Improve reliability Better quality control Optimal servicing strategy (e.g., repair versus replace) Monitoring warranty claims – prevention of fraud Effective management of warranty logistics
FURTHER READING Blischke, W. R., and D. N. P. Murthy (1994), Warranty Cost Analysis, Marcel Dekker, Inc., New York Blischke, W.R. and D.N.P. Murthy (eds). (2002), Case Studies in Reliability and Maintenance, Wiley, New York [Contains two case studies]
FURTHER READING For more recent literature, see: DNP Murthy and I Djamaludin, Product warranty – A review, International Journal of Production Economics, 79 (2002), 231-260.