MANAGING PROJECT RESOURCES

38 Slides305.50 KB
MANAGING PROJECT RESOURCES
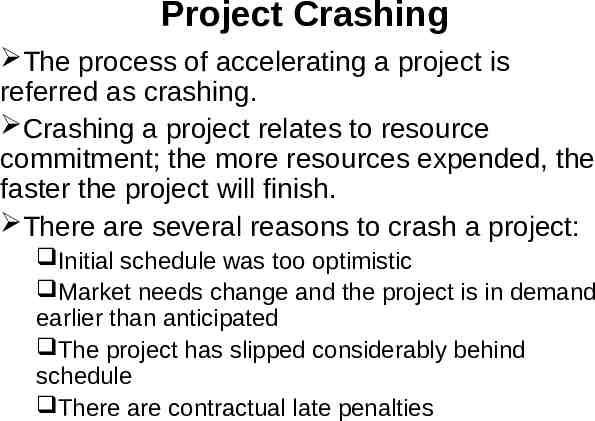
Project Crashing The process of accelerating a project is referred as crashing. Crashing a project relates to resource commitment; the more resources expended, the faster the project will finish. There are several reasons to crash a project: Initial schedule was too optimistic Market needs change and the project is in demand earlier than anticipated The project has slipped considerably behind schedule There are contractual late penalties
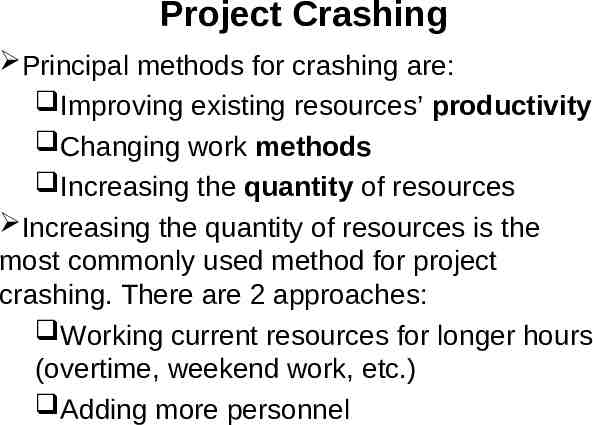
Project Crashing Principal methods for crashing are: Improving existing resources’ productivity Changing work methods Increasing the quantity of resources Increasing the quantity of resources is the most commonly used method for project crashing. There are 2 approaches: Working current resources for longer hours (overtime, weekend work, etc.) Adding more personnel
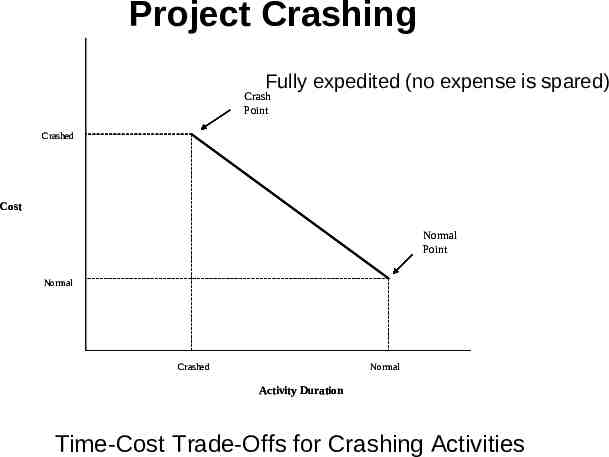
Project Crashing Fully expedited (no expense is spared) Crash Point Crashed Cost Normal Point Normal Crashed Normal Activity Duration Time-Cost Trade-Offs for Crashing Activities
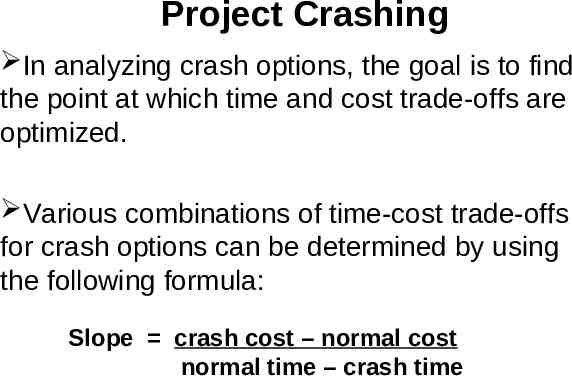
Project Crashing In analyzing crash options, the goal is to find the point at which time and cost trade-offs are optimized. Various combinations of time-cost trade-offs for crash options can be determined by using the following formula: Slope crash cost – normal cost normal time – crash time
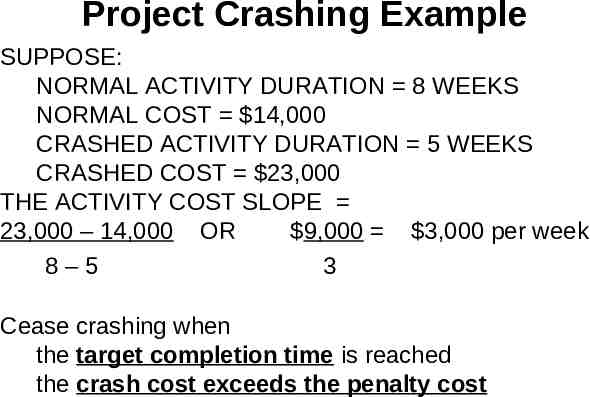
Project Crashing Example SUPPOSE: NORMAL ACTIVITY DURATION 8 WEEKS NORMAL COST 14,000 CRASHED ACTIVITY DURATION 5 WEEKS CRASHED COST 23,000 THE ACTIVITY COST SLOPE 23,000 – 14,000 OR 9,000 3,000 per week 8–5 3 Cease crashing when the target completion time is reached the crash cost exceeds the penalty cost
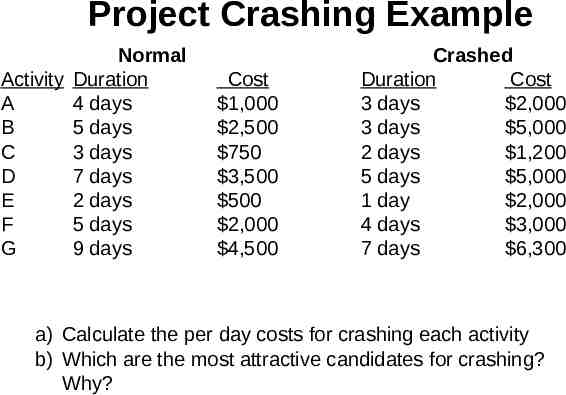
Project Crashing Example Normal Activity Duration A 4 days B 5 days C 3 days D 7 days E 2 days F 5 days G 9 days Cost 1,000 2,500 750 3,500 500 2,000 4,500 Crashed Duration Cost 3 days 2,000 3 days 5,000 2 days 1,200 5 days 5,000 1 day 2,000 4 days 3,000 7 days 6,300 a) Calculate the per day costs for crashing each activity b) Which are the most attractive candidates for crashing? Why?
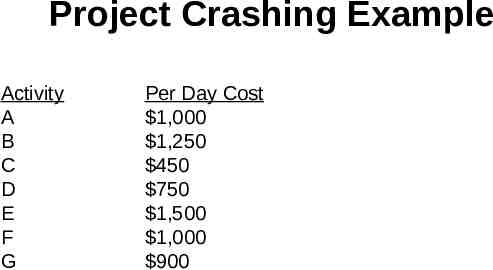
Project Crashing Example Activity A B C D E F G Per Day Cost 1,000 1,250 450 750 1,500 1,000 900
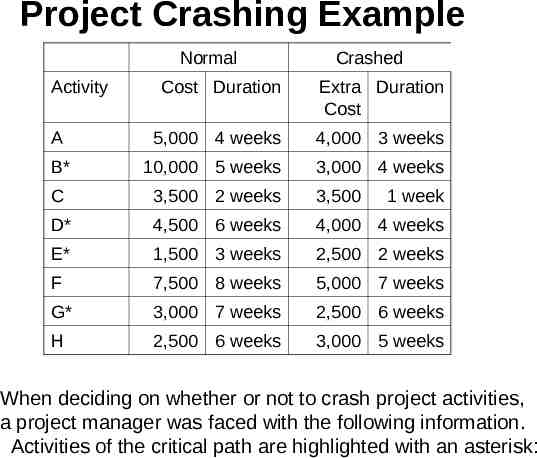
Project Crashing Example Normal Activity Crashed Cost Duration Extra Duration Cost A 5,000 4 weeks 4,000 3 weeks B* 10,000 5 weeks 3,000 4 weeks C 3,500 2 weeks 3,500 D* 4,500 6 weeks 4,000 4 weeks E* 1,500 3 weeks 2,500 2 weeks F 7,500 8 weeks 5,000 7 weeks G* 3,000 7 weeks 2,500 6 weeks H 2,500 6 weeks 3,000 5 weeks 1 week When deciding on whether or not to crash project activities, a project manager was faced with the following information. Activities of the critical path are highlighted with an asterisk:
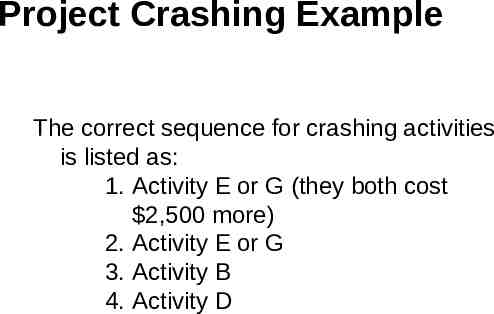
Project Crashing Example The correct sequence for crashing activities is listed as: 1. Activity E or G (they both cost 2,500 more) 2. Activity E or G 3. Activity B 4. Activity D
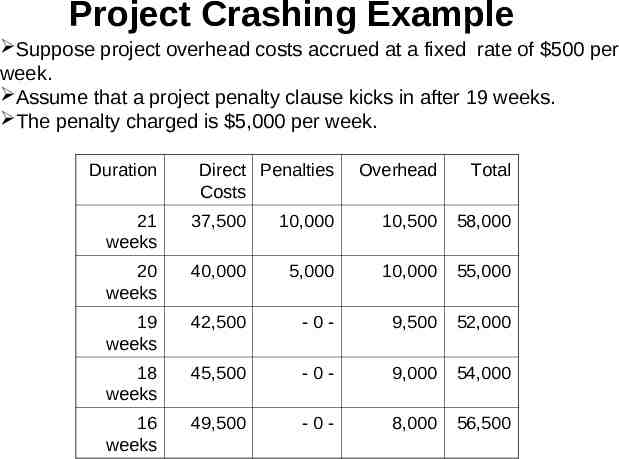
Project Crashing Example Suppose project overhead costs accrued at a fixed rate of 500 per week. Assume that a project penalty clause kicks in after 19 weeks. The penalty charged is 5,000 per week. Duration Direct Penalties Costs Overhead Total 21 weeks 37,500 10,000 10,500 58,000 20 weeks 40,000 5,000 10,000 55,000 19 weeks 42,500 -0- 9,500 52,000 18 weeks 45,500 -0- 9,000 54,000 16 weeks 49,500 -0- 8,000 56,500
Resource Allocation Problem A shortcoming of most scheduling procedures is that they do not address the issues of resource utilization and availability. Scheduling procedures tend to focus on time rather than physical resources.
Resource Allocation Problem Schedules should be evaluated not merely in terms of meeting project milestones, but also in terms of the timing and use of scarce resources. A fundamental measure of the project manager’s success in project management is the skill with which the trade-offs among performance, time, and cost are managed. “I can shorten this project by 1 day at a cost of 400. Should I do it?”
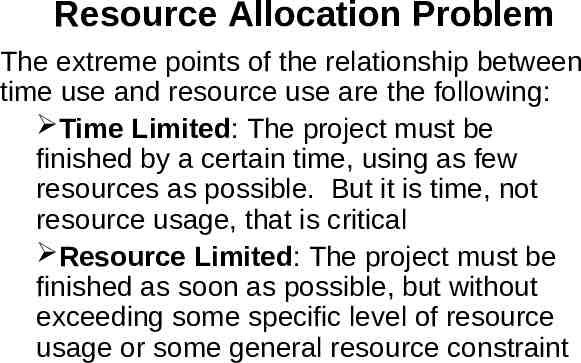
Resource Allocation Problem The extreme points of the relationship between time use and resource use are the following: Time Limited: The project must be finished by a certain time, using as few resources as possible. But it is time, not resource usage, that is critical Resource Limited: The project must be finished as soon as possible, but without exceeding some specific level of resource usage or some general resource constraint
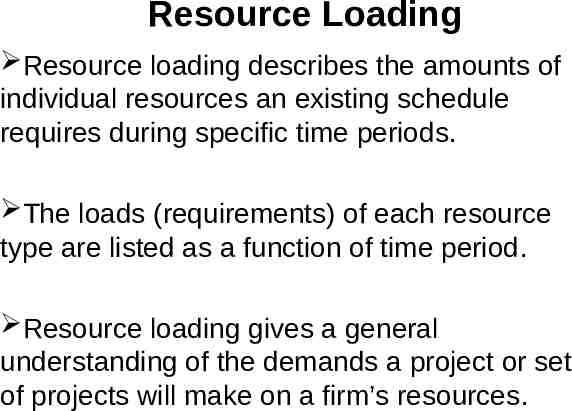
Resource Loading Resource loading describes the amounts of individual resources an existing schedule requires during specific time periods. The loads (requirements) of each resource type are listed as a function of time period. Resource loading gives a general understanding of the demands a project or set of projects will make on a firm’s resources.
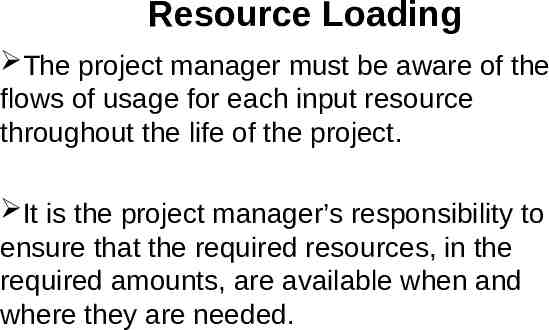
Resource Loading The project manager must be aware of the flows of usage for each input resource throughout the life of the project. It is the project manager’s responsibility to ensure that the required resources, in the required amounts, are available when and where they are needed.
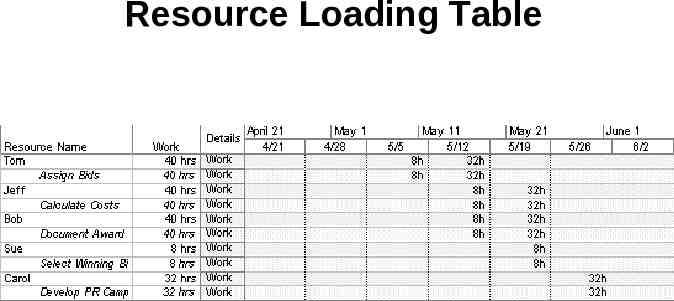
Resource Loading Table
Resource Leveling (Smooting) Resource leveling aims to minimize the period-by-period variations in resource loading by shifting tasks within their slack allowances. The purpose is to create a smoother distribution of resource usage. Resource leveling, referred to as resource smoothing, has two objectives: To determine the resource requirements so that they will be available at the right time, To allow each activity to be scheduled with the smoothest possible transition across usage levels.
Resource Leveling (Smooting) Resource management is a multivariate, combinatorial problem, i.e. multiple solutions with many variables, the mathematically optimal solution may be difficult or infeasible. More common approach to analyzing resource leveling problems is to apply some resource leveling heuristics.
Resource Leveling Heuristics Prioritizing resource allocation include applying resources to activities: with the smallest amount of slack with the smallest duration that start earliest with the most successor tasks requiring the most resources
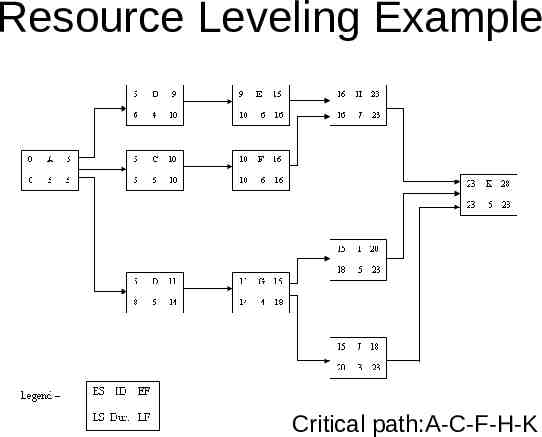
Resource Leveling Steps Create a project activity network diagram Create a table showing the resources required for each activity, durations, and the total float available Develop a time-phased resource loading table Identify any resource conflicts and begin to smooth the loading table using one or more heuristics
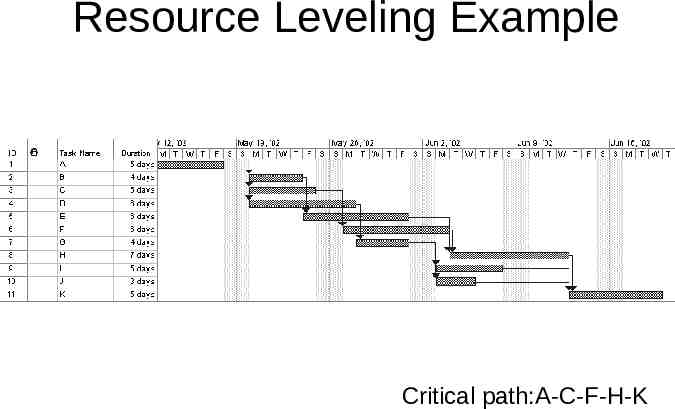
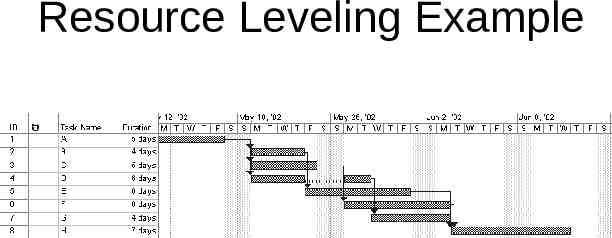
Resource Leveling Example Critical path:A-C-F-H-K
Resource Leveling Example Critical path:A-C-F-H-K
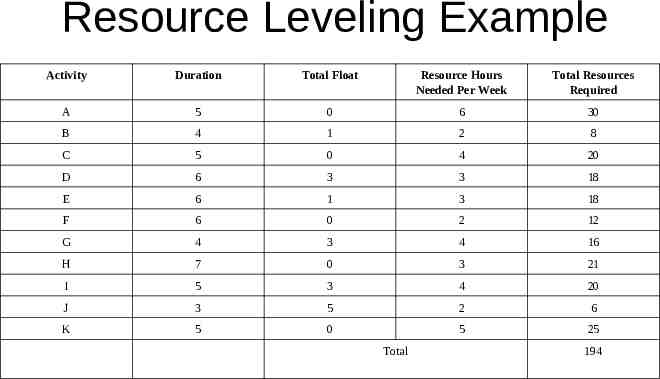
Resource Leveling Example Activity Duration Total Float Resource Hours Needed Per Week Total Resources Required A 5 0 6 30 B 4 1 2 8 C 5 0 4 20 D 6 3 3 18 E 6 1 3 18 F 6 0 2 12 G 4 3 4 16 H 7 0 3 21 I 5 3 4 20 J 3 5 2 6 K 5 0 5 25 Total 194
Resource Leveling Example
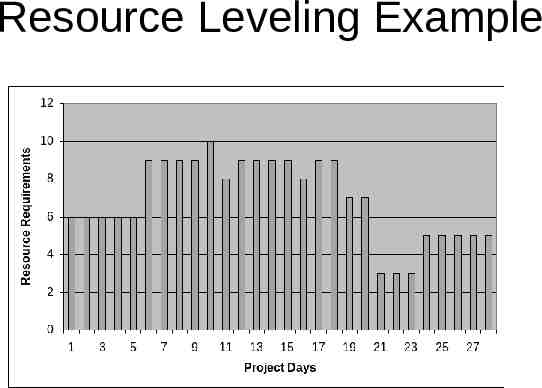
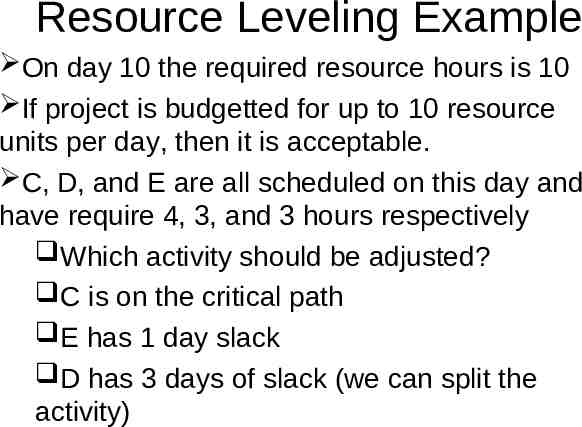
Resource Leveling Example On day 10 the required resource hours is 10 If project is budgetted for up to 10 resource units per day, then it is acceptable. C, D, and E are all scheduled on this day and have require 4, 3, and 3 hours respectively Which activity should be adjusted? C is on the critical path E has 1 day slack D has 3 days of slack (we can split the activity)
Resource Leveling Example
Resource Loading Chart Another way to create a visual diagram of resource management problem is to use resource-loading charts. Resource conflicts can be seen in the resource-loading charts. They are used to display the amount of resources required as a function of time on a graph. Each activity’s resource requirements are represented as a block (resource requirement over time).
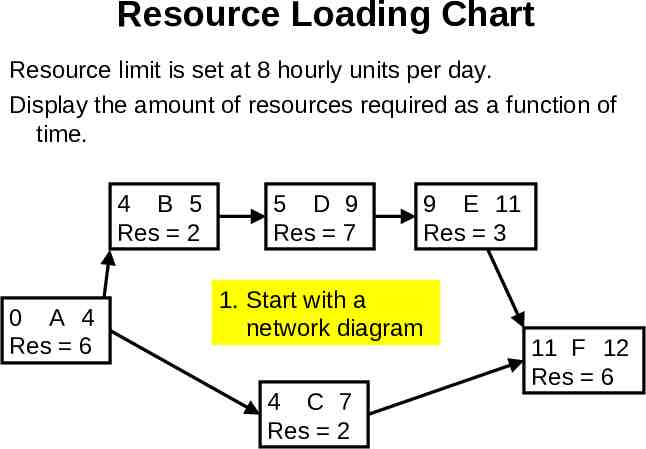
Resource Loading Chart Resource limit is set at 8 hourly units per day. Display the amount of resources required as a function of time. 4 B 5 Res 2 0 A 4 Res 6 5 D 9 Res 7 9 E 11 Res 3 1. Start with a network diagram 4 C 7 Res 2 11 F 12 Res 6
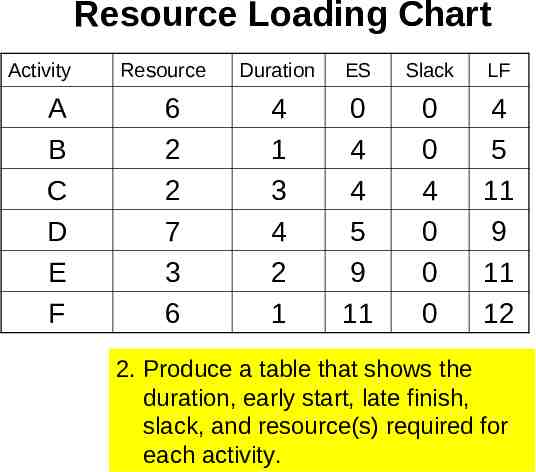
Resource Loading Chart Activity A B C D E F Resource 6 2 2 7 3 6 Duration ES Slack LF 4 1 3 4 2 1 0 4 4 5 9 11 0 0 4 0 0 0 4 5 11 9 11 12 2. Produce a table that shows the duration, early start, late finish, slack, and resource(s) required for each activity.
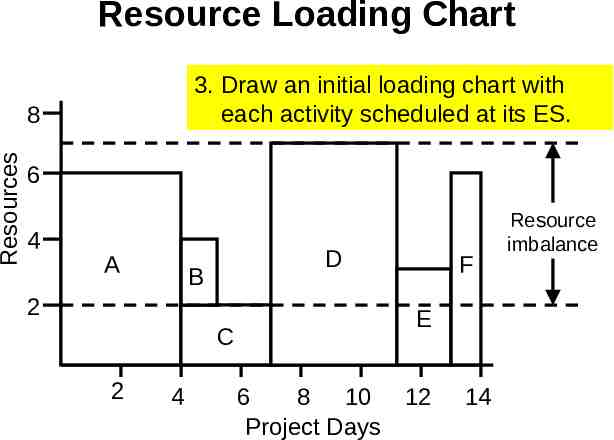
Resource Loading Chart 3. Draw an initial loading chart with each activity scheduled at its ES. Resources 8 6 4 A D B 2 C 2 4 F E 6 8 10 12 Project Days 14 Resource imbalance
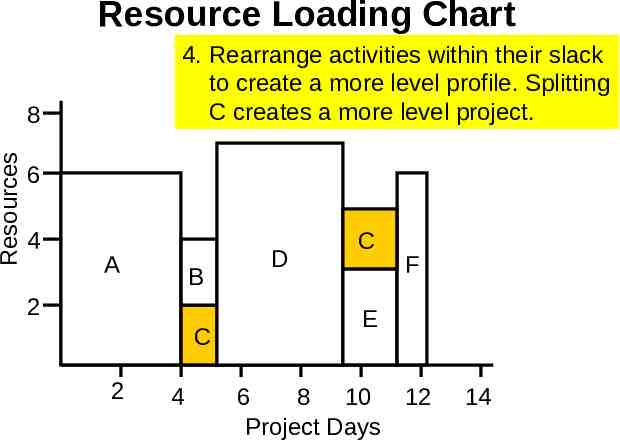
Resource Loading Chart 4. Rearrange activities within their slack to create a more level profile. Splitting C creates a more level project. Resources 8 6 4 A B 2 C 2 4 D C F E 6 8 10 12 Project Days 14
Resource Loading Chart
Critical Chain Project Management Critical Chain Project Management (CCPM), which was developed and publicized by Dr. Eliyahu M. Goldratt (1997) in his book Critical Chain, is a novel approach for managing projects. Goldratt is well known in the operations management community as the inventor of the Theory of Constraints (TOC). TOC is a tool for managing repetitive production systems based on the principle that every system has a constraint, and system performance can only be improved by enhancing the performance of the constraining resource.
Critical Chain Project Management CCPM identifies the critical chain as the set of tasks that results in the longest path to project completion after resource leveling. CCPM is the same as conventional project management except for the terminology "critical chain", which would otherwise be called the "leveled critical path".
Critical Chain Project Management CCPM planning consists of recalculating the project schedule based on shortened task duration estimates. The rationale for shortening the original duration estimates is as follows: all tasks in the project are subject to some degree of uncertainty when asked to provide an estimate of the duration, the task owner adds a safety margin in order to be almost certain of completing the task on time. This means that, in general, task durations are overestimated In most cases, the task will not require the entire amount of safety margin and should be completed sooner than scheduled Because the safety margin is internal to the task, if it is not needed, it is wasted.
Critical Chain Project Management For project plan execution, CCPM prescribes the following principles: Resources working on critical chain tasks are expected to work continuously on a single task at a time. They do not work on several tasks in parallel or suspend their critical tasks to do other work Resources are to complete the task assigned as soon as possible, regardless of scheduled dates
Critical Chain Project Management If the task is completed ahead of schedule, work on its successor is to begin immediately. If the task successor utilizes a critical resource for which a resource buffer has been defined, advance warning is provided to that resource at the point in time where the resource buffer begins If the task is completed past its planned completion date, as shown on the CCPM schedule, this is no reason for immediate concern, as the buffer will absorb the delay. Source: http://en.wikipedia.org/wiki/Critical chain