LSP 121 Intro to Statistics and SPSS
34 Slides479.00 KB
LSP 121 Intro to Statistics and SPSS
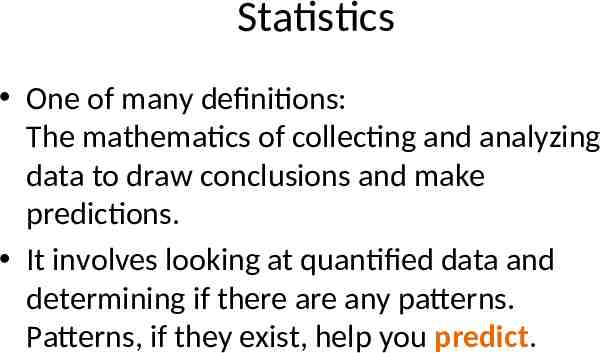
Statistics One of many definitions: The mathematics of collecting and analyzing data to draw conclusions and make predictions. It involves looking at quantified data and determining if there are any patterns. Patterns, if they exist, help you predict.
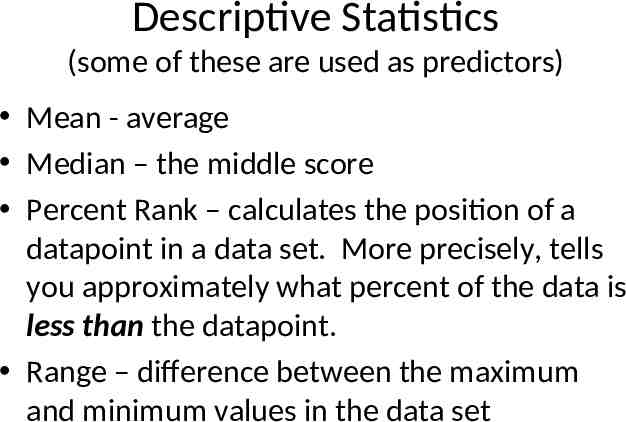
Descriptive Statistics (some of these are used as predictors) Mean - average Median – the middle score Percent Rank – calculates the position of a datapoint in a data set. More precisely, tells you approximately what percent of the data is less than the datapoint. Range – difference between the maximum and minimum values in the data set
The mean or the median? Advantages of the median are: · If one of the extreme values changes, then the median remains unaltered. Whereas the mean would be affected hugely. · If a set of numbers has a lop-sided pattern – if for example, most of the scores are small, several medium sized, but only one or two high – then the median may again be more appropriate than the mean, as its value will be close to the majority of numbers
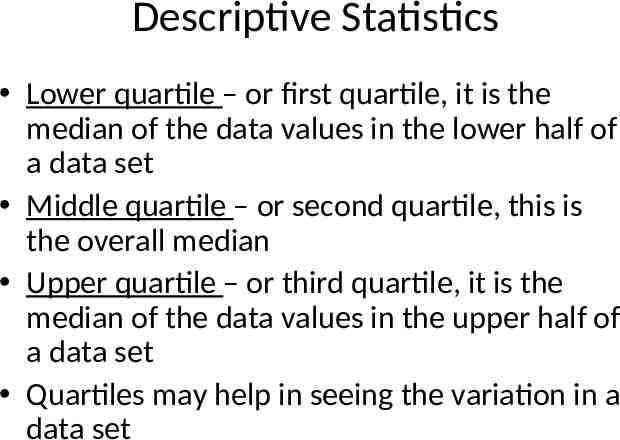
Descriptive Statistics Lower quartile – or first quartile, it is the median of the data values in the lower half of a data set Middle quartile – or second quartile, this is the overall median Upper quartile – or third quartile, it is the median of the data values in the upper half of a data set Quartiles may help in seeing the variation in a data set
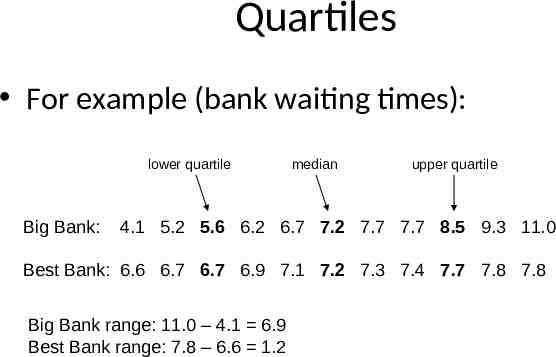
Quartiles For example (bank waiting times): lower quartile Big Bank: median upper quartile 4.1 5.2 5.6 6.2 6.7 7.2 7.7 7.7 8.5 9.3 11.0 Best Bank: 6.6 6.7 6.7 6.9 7.1 7.2 7.3 7.4 7.7 7.8 7.8 Big Bank range: 11.0 – 4.1 6.9 Best Bank range: 7.8 – 6.6 1.2
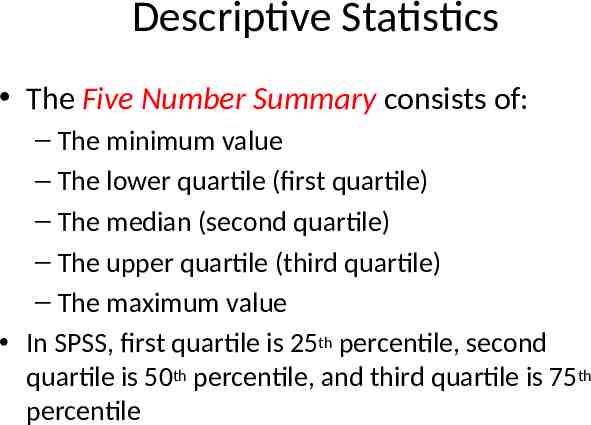
Descriptive Statistics The Five Number Summary consists of: – The minimum value – The lower quartile (first quartile) – The median (second quartile) – The upper quartile (third quartile) – The maximum value In SPSS, first quartile is 25th percentile, second quartile is 50th percentile, and third quartile is 75th percentile
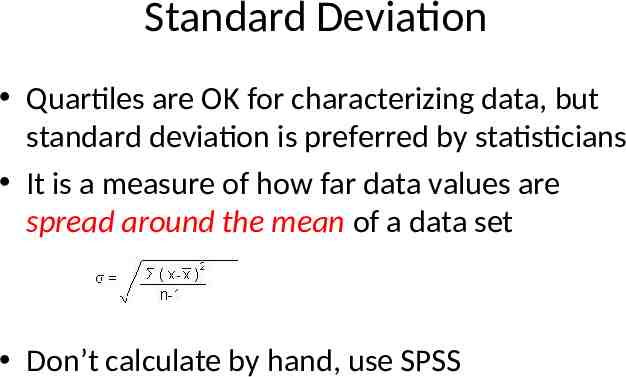
Standard Deviation Quartiles are OK for characterizing data, but standard deviation is preferred by statisticians It is a measure of how far data values are spread around the mean of a data set Don’t calculate by hand, use SPSS
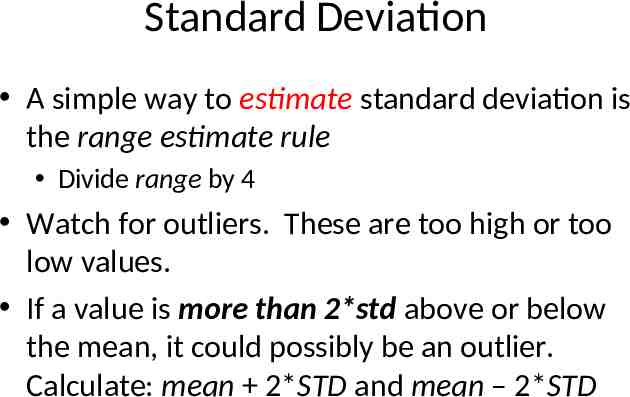
Standard Deviation A simple way to estimate standard deviation is the range estimate rule Divide range by 4 Watch for outliers. These are too high or too low values. If a value is more than 2*std above or below the mean, it could possibly be an outlier. Calculate: mean 2*STD and mean – 2*STD
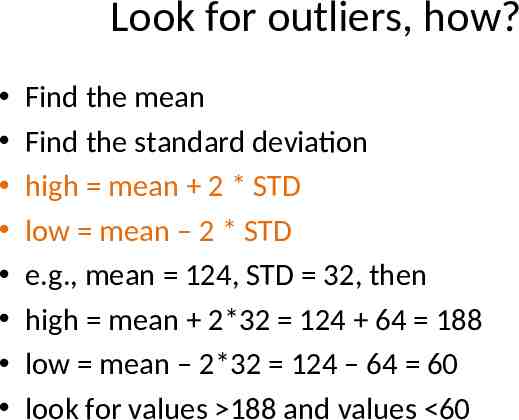
Look for outliers, how? Find the mean Find the standard deviation high mean 2 * STD low mean – 2 * STD e.g., mean 124, STD 32, then high mean 2*32 124 64 188 low mean – 2*32 124 – 64 60 look for values 188 and values 60
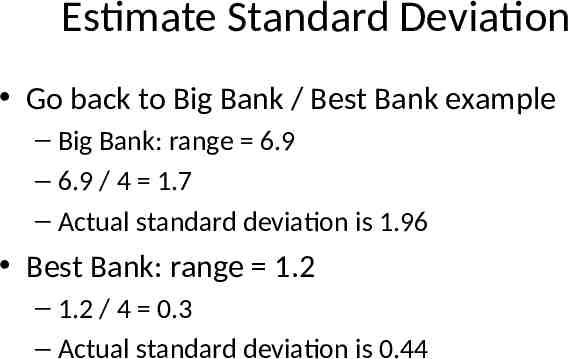
Estimate Standard Deviation Go back to Big Bank / Best Bank example – Big Bank: range 6.9 – 6.9 / 4 1.7 – Actual standard deviation is 1.96 Best Bank: range 1.2 – 1.2 / 4 0.3 – Actual standard deviation is 0.44
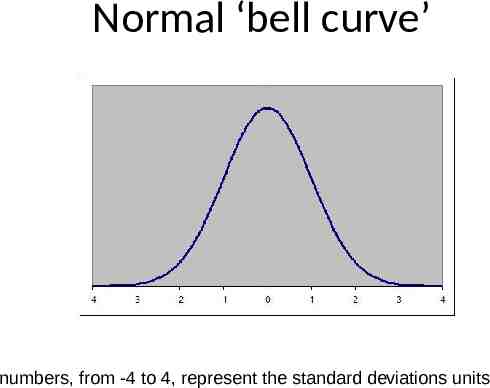
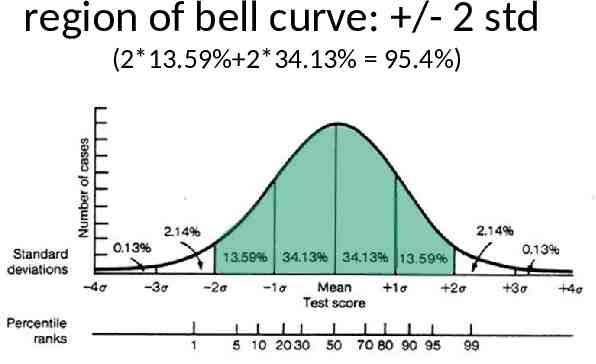
Normal ‘bell curve’ numbers, from -4 to 4, represent the standard deviations units
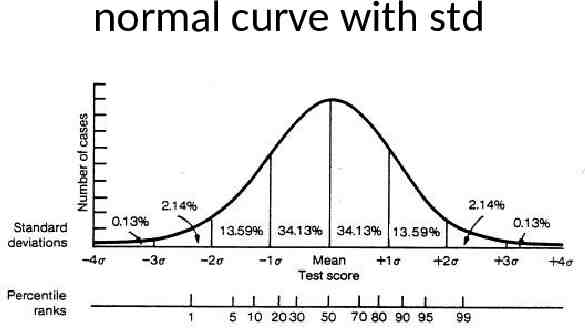
normal curve with std
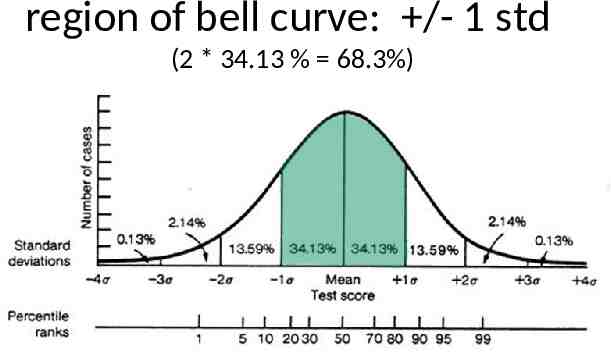
region of bell curve: /- 1 std (2 * 34.13 % 68.3%)
region of bell curve: /- 2 std (2*13.59% 2*34.13% 95.4%)
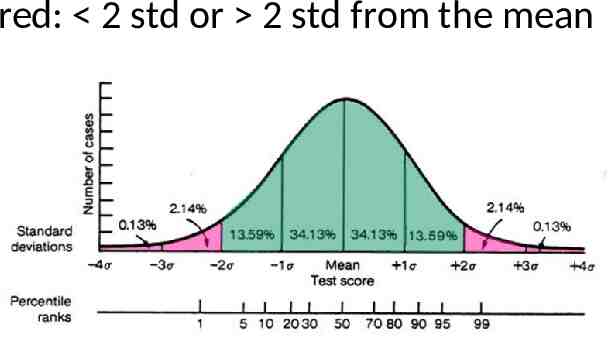
red: 2 std or 2 std from the mean
Histograms Nice way to view a data set A histogram is a chart similar to a dotplot created by defining a set of bins and counting how many data points lie in each bin. Bars are drawn with height proportional to the number of data points in each bin.
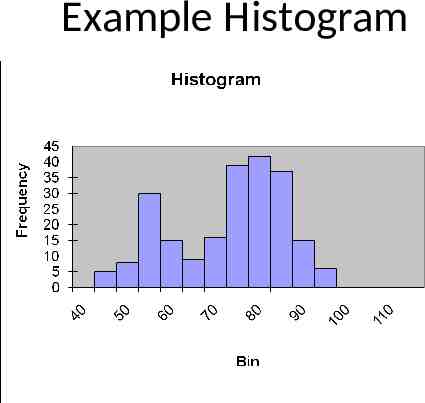
Example Histogram
Statistics and SPSS While Excel can do some basic statistics, it is not considered a serious statistics tool You really should use something like SPSS (statistical package for social sciences) We will be using SPSS since DePaul has a site license for this application
Try this example Download the dataset Grades.xls from the QRC website (under older data) and start SPSS Import the Excel data into SPSS Change the variable names and set data to numeric (not text) Click on Analyze - Descriptive Statistics - Frequencies
Example continued When importing data, if the numeric fields show as ‘ ’, ‘%’, or ‘#’, then PASW will have difficulty converting to numeric In most cases, SPSS will briefly display dollar signs indicating that conversion is taking place.
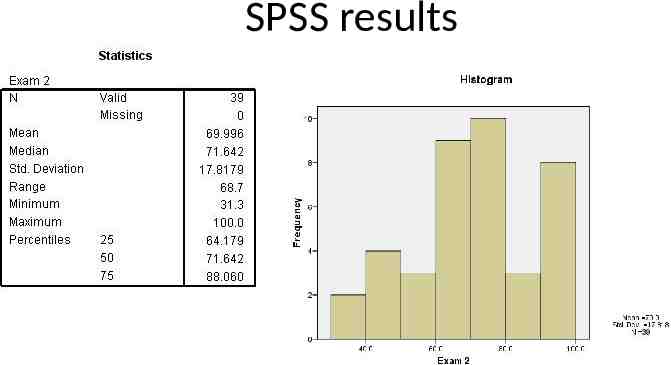
Example continued Using the grades for Exam 2, find the – 5 number summary (minimum, 1st quartile, median, 3rd quartile, maximum) – mean – range, and – standard deviation
SPSS results
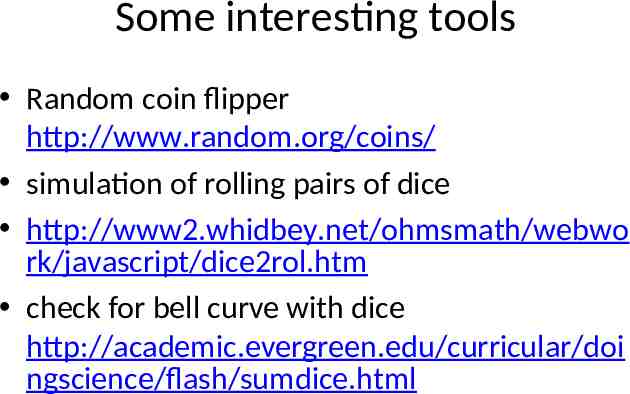
Some interesting tools Random coin flipper http://www.random.org/coins/ simulation of rolling pairs of dice http://www2.whidbey.net/ohmsmath/webwo rk/javascript/dice2rol.htm check for bell curve with dice http://academic.evergreen.edu/curricular/doi ngscience/flash/sumdice.html
Pivot Tables/Crosstabs Next topic pivot tables and crosstabs
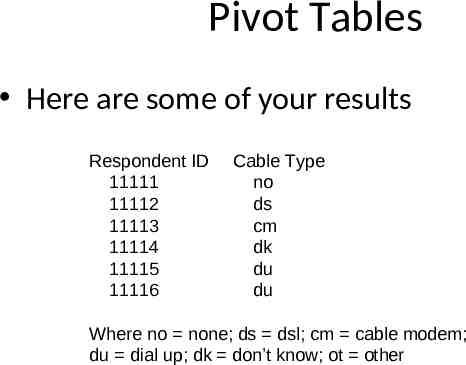
Pivot Tables Suppose you have just performed a survey. One of the questions you ask is, what type of home computer connection do you have? Answers can be: none, dial-up, dsl, cable, other, not sure.
Pivot Tables Here are some of your results Respondent ID 11111 11112 11113 11114 11115 11116 Cable Type no ds cm dk du du Where no none; ds dsl; cm cable modem; du dial up; dk don’t know; ot other
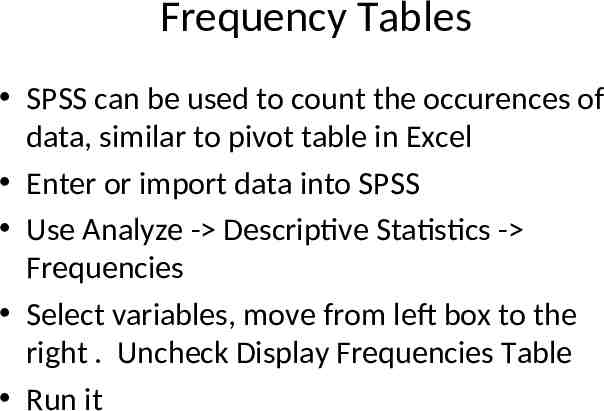
Frequency Tables SPSS can be used to count the occurences of data, similar to pivot table in Excel Enter or import data into SPSS Use Analyze - Descriptive Statistics - Frequencies Select variables, move from left box to the right . Uncheck Display Frequencies Table Run it
Crosstabulations (Crosstabs) Crosstabs are an extension of pivot tables Suppose you have asked a number of students: How many schools did you apply to? You get results something like the following (in a spreadsheet):
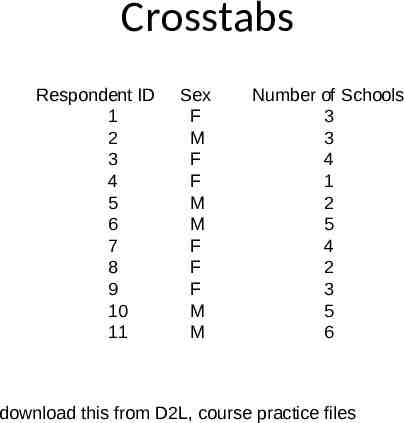
Crosstabs Respondent ID 1 2 3 4 5 6 7 8 9 10 11 Sex F M F F M M F F F M M Number of Schools 3 3 4 1 2 5 4 2 3 5 6 download this from D2L, course practice files
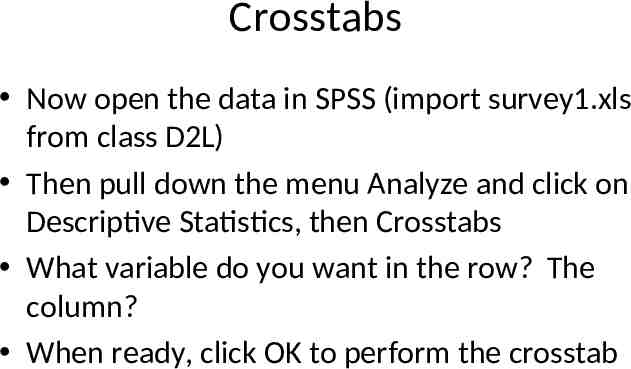
Crosstabs Now open the data in SPSS (import survey1.xls from class D2L) Then pull down the menu Analyze and click on Descriptive Statistics, then Crosstabs What variable do you want in the row? The column? When ready, click OK to perform the crosstab
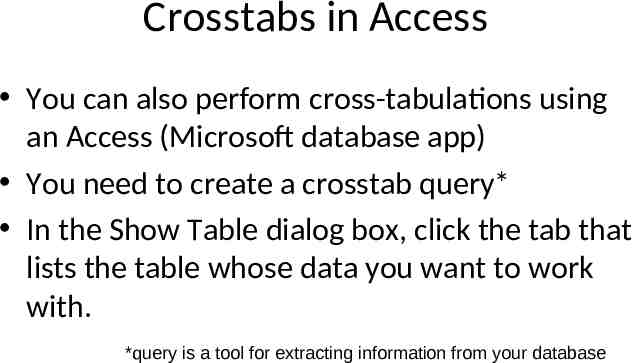
Crosstabs in Access You can also perform cross-tabulations using an Access (Microsoft database app) You need to create a crosstab query* In the Show Table dialog box, click the tab that lists the table whose data you want to work with. *query is a tool for extracting information from your database
Crosstabs in Access Add the fields to the Field row in the design grid. Note: Since we want to perform a crosstab query on ‘Sex’ and ‘Number of Schools’, bring the field ‘Sex’ down once and ‘Number of Schools’ down twice.
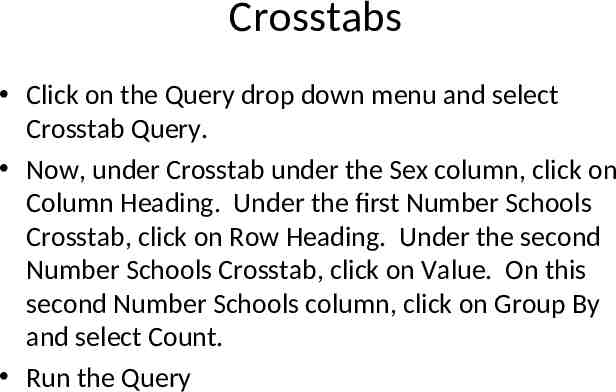
Crosstabs Click on the Query drop down menu and select Crosstab Query. Now, under Crosstab under the Sex column, click on Column Heading. Under the first Number Schools Crosstab, click on Row Heading. Under the second Number Schools Crosstab, click on Value. On this second Number Schools column, click on Group By and select Count. Run the Query