Joseph M. Lancaster, Roger D. Chamberlain Dept. of Computer Science
38 Slides3.78 MB
Joseph M. Lancaster, Roger D. Chamberlain Dept. of Computer Science and Engineering Washington University in St. Louis {lancaster, roger}@wustl.edu Research supported by ofNSF grant CNS-0720667 Performance Monitoring Diverse Computer Systems
Run correctly Do not dead-lock Meet hard real-time deadlines Run fast High-throughput / low latency Low rate of soft deadline misses Infrastructure should help us debug when it runs incorrectly or slow 9/25/08 – HPEC 2008 Performance Monitoring of Diverse Computer Systems 2
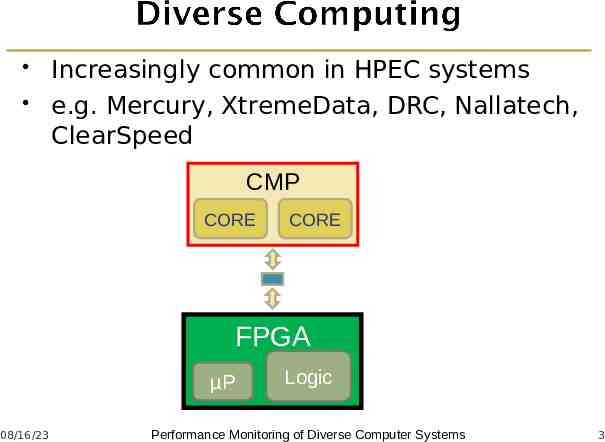
Increasingly common in HPEC systems e.g. Mercury, XtremeData, DRC, Nallatech, ClearSpeed CMP CORE CORE FPGA µP 08/16/23 Logic Performance Monitoring of Diverse Computer Systems 3
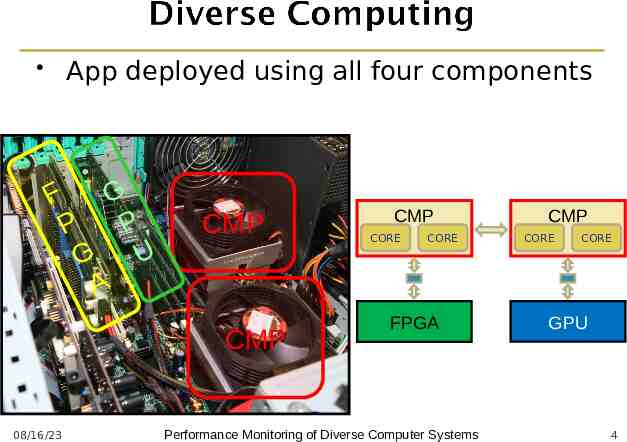
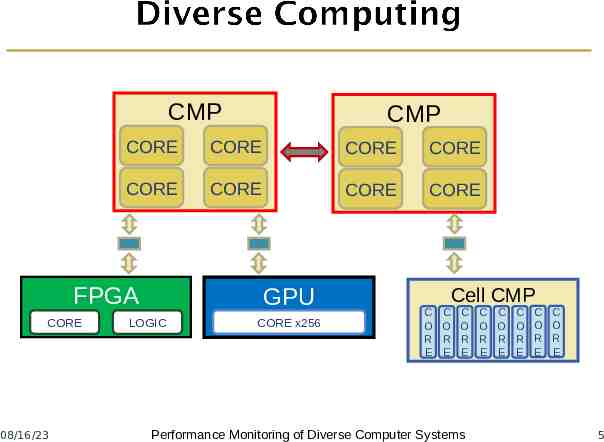
App deployed using all four components G F P P U G A CMP CMP 08/16/23 CMP CORE CORE FPGA Performance Monitoring of Diverse Computer Systems CMP CORE CORE GPU 4
CMP CORE CORE CORE CORE CORE CORE CORE CORE FPGA CORE 08/16/23 CMP GPU LOGIC CORE x256 C O R E Cell CMP C O R E C O R E Performance Monitoring of Diverse Computer Systems C O R E C O R E C O R E C O R E C O R E 5
– – Large performance gains realized Power efficient compared to CMP alone Requires knowledge of individual architectures/languages Components operate independently Distributed system Separate memories and clocks 08/16/23 Performance Monitoring of Diverse Computer Systems 6
Tool support for these systems insufficient Many architectures lack tools for monitoring and validation Tools for different architectures not integrated Ad hoc solutions Solution: Runtime performance monitoring and validation for diverse systems! 08/16/23 Performance Monitoring of Diverse Computer Systems 7
Introduction Runtime performance monitoring Frame monitoring User-guidance 08/16/23 Performance Monitoring of Diverse Computer Systems 8
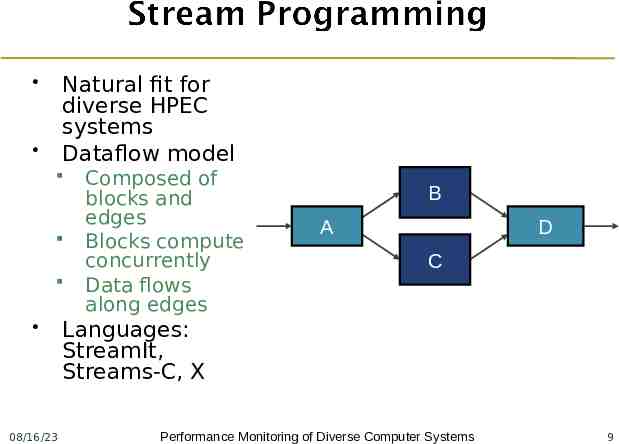
Natural fit for diverse HPEC systems Dataflow model 08/16/23 Composed of blocks and edges Blocks compute concurrently Data flows along edges B A D C Languages: StreamIt, Streams-C, X Performance Monitoring of Diverse Computer Systems 9
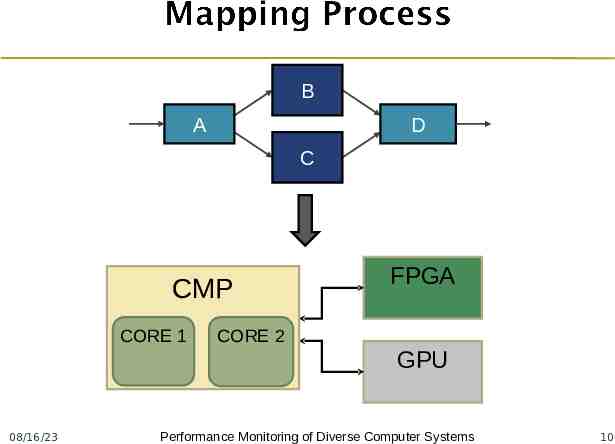
B A D C CMP CORE 1 FPGA CORE 2 GPU 08/16/23 Performance Monitoring of Diverse Computer Systems 10
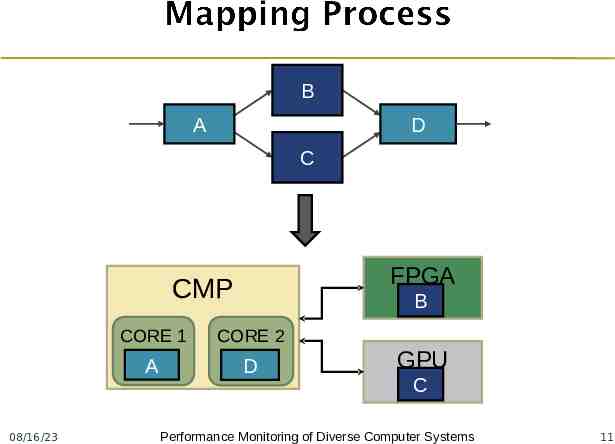
B A D C FPGA CMP 08/16/23 B CORE 1 CORE 2 A D GPU C Performance Monitoring of Diverse Computer Systems 11
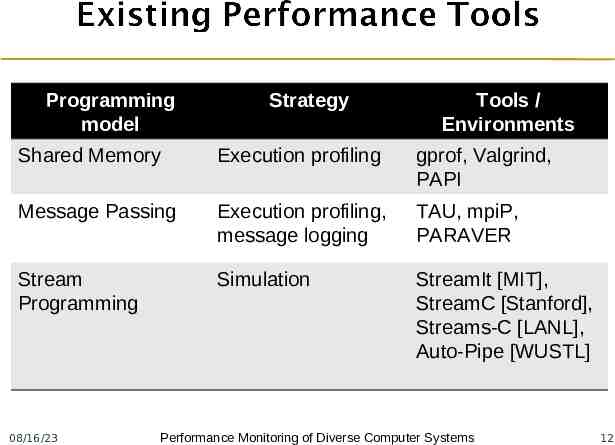
Programming model Strategy Tools / Environments Shared Memory Execution profiling gprof, Valgrind, PAPI Message Passing Execution profiling, message logging TAU, mpiP, PARAVER Stream Programming Simulation StreamIt [MIT], StreamC [Stanford], Streams-C [LANL], Auto-Pipe [WUSTL] 08/16/23 Performance Monitoring of Diverse Computer Systems 12
Limitations for diverse systems No universal PC or architecture No shared memory Different clocks Communication latency and bandwidth 08/16/23 Performance Monitoring of Diverse Computer Systems 13
Simulation is a useful first step but: Models can abstract away system details Too slow for large datasets HPEC applications growing in complexity Need to monitor deployed, running app Measure actual performance of system Validate performance of large, real-world datasets 08/16/23 Performance Monitoring of Diverse Computer Systems 14
Report more than just aggregate statistics Quantify measurement impact where possible Capture rare events Overhead due to sampling, communication, etc. Measure runtime performance efficiently Low overhead High accuracy Validate performance of real datasets Increase developer productivity 08/16/23 Performance Monitoring of Diverse Computer Systems 15
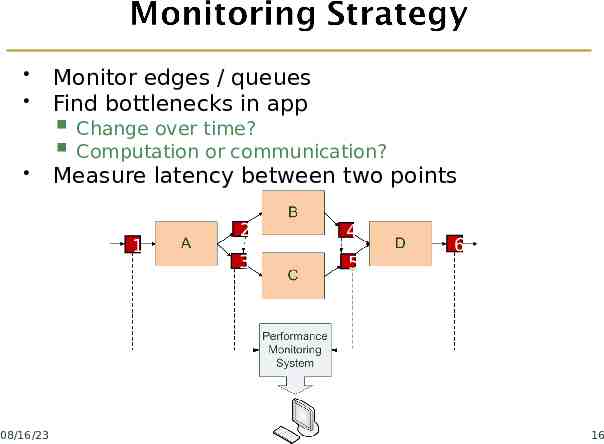
Monitor edges / queues Find bottlenecks in app Change over time? Computation or communication? Measure latency between two points 1 08/16/23 2 4 3 5 6 Performance Monitoring of Diverse Computer Systems 16
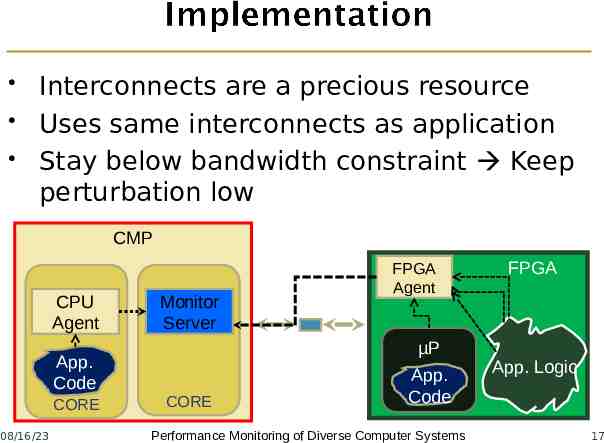
Interconnects are a precious resource Uses same interconnects as application Stay below bandwidth constraint Keep perturbation low CMP CPU Agent App. Code CORE 08/16/23 Monitor Server FPGA Agent µP CORE App. Code Performance Monitoring of Diverse Computer Systems FPGA App. Logic 17
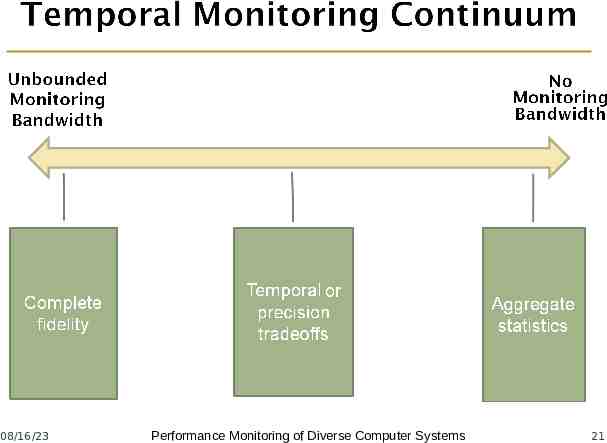
Understand measurement perturbation Dedicate compute resources when possible Aggressively reduce amount of performance meta-data stored and transmitted Utilize compression in both time resolution and fidelity of data values Use knowledge from user to specify their performance expectations / measurements 08/16/23 Performance Monitoring of Diverse Computer Systems 18
Use CMP core as the server monitor Monitor other cores for performance information Process data from agents (e.g. FPGA, GPU) Combine hardware and software information for global view Use logical clocks to synchronize events Dedicate unused FPGA area to monitoring 08/16/23 Performance Monitoring of Diverse Computer Systems 19
Introduction Runtime Performance Monitoring Frame monitoring User-guidance 08/16/23 Performance Monitoring of Diverse Computer Systems 20
08/16/23 Performance Monitoring of Diverse Computer Systems 21
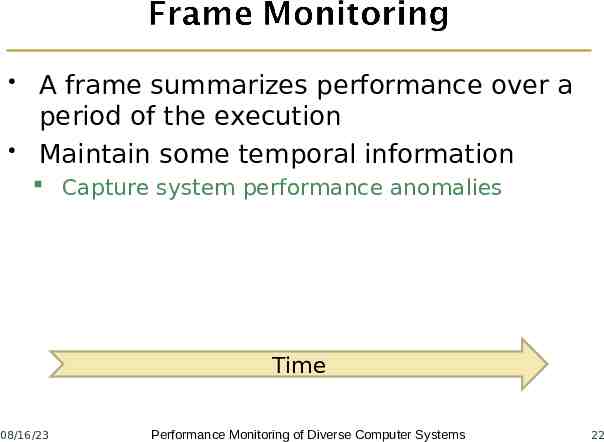
A frame summarizes performance over a period of the execution Maintain some temporal information Capture system performance anomalies Time 08/16/23 Performance Monitoring of Diverse Computer Systems 22
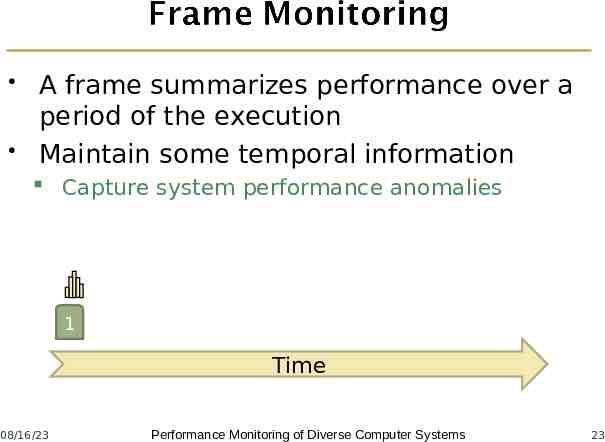
A frame summarizes performance over a period of the execution Maintain some temporal information Capture system performance anomalies 1 Time 08/16/23 Performance Monitoring of Diverse Computer Systems 23
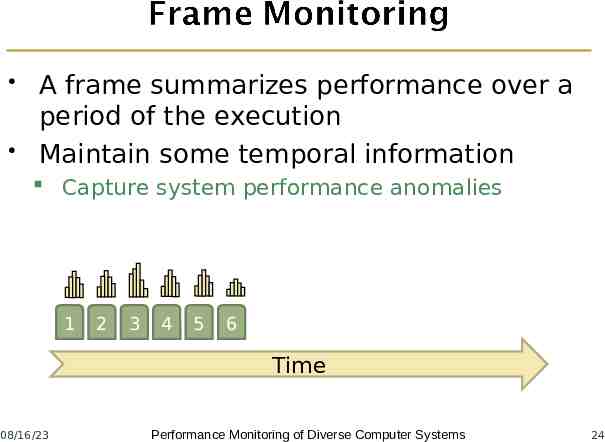
A frame summarizes performance over a period of the execution Maintain some temporal information Capture system performance anomalies 1 2 3 4 5 6 Time 08/16/23 Performance Monitoring of Diverse Computer Systems 24
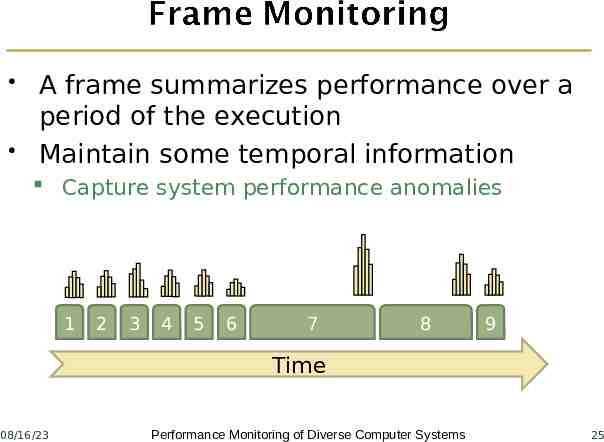
A frame summarizes performance over a period of the execution Maintain some temporal information Capture system performance anomalies 1 2 3 4 5 6 7 8 9 Time 08/16/23 Performance Monitoring of Diverse Computer Systems 25
Each frame reports one performance metric Frame size can be dynamic Dynamic bandwidth budget Low variance data / application phases Trade temporal granularity for lower perturbation Frames from different agents will likely be unsynchronized and different sizes Monitor server presents user with consistent global view of performance 08/16/23 Performance Monitoring of Diverse Computer Systems 26
Introduction Runtime Performance Monitoring Frame Monitoring User-guidance 08/16/23 Performance Monitoring of Diverse Computer Systems 27
Why? Related work: Performance Assertions for Mobile Devices [Lenecevicius’06] Validates user performance assertions on multithreaded embedded CPU Our system enables validation of performance expectations across diverse architectures 08/16/23 Performance Monitoring of Diverse Computer Systems 28
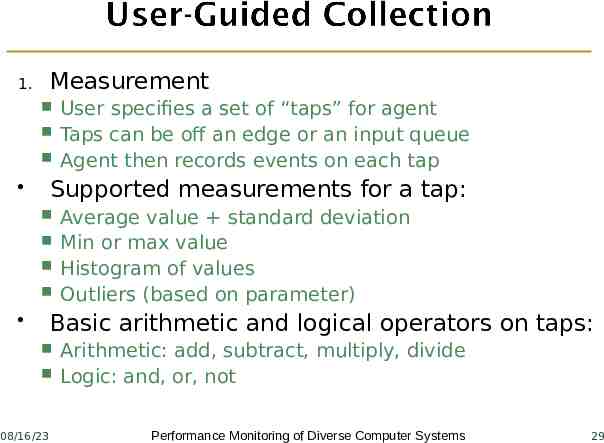
Measurement 1. User specifies a set of “taps” for agent Taps can be off an edge or an input queue Agent then records events on each tap Supported measurements for a tap: Average value standard deviation Min or max value Histogram of values Outliers (based on parameter) Basic arithmetic and logical operators on taps: 08/16/23 Arithmetic: add, subtract, multiply, divide Logic: and, or, not Performance Monitoring of Diverse Computer Systems 29
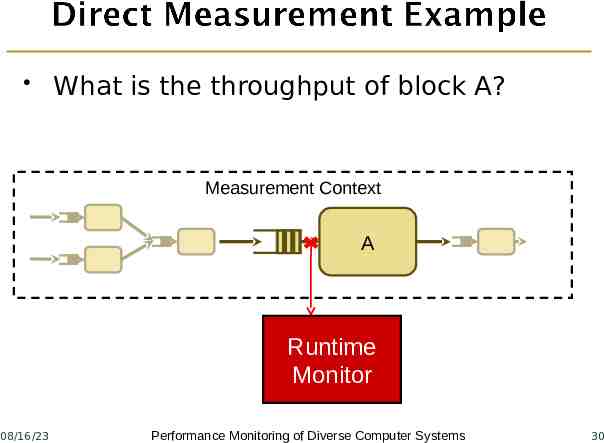
What is the throughput of block A? Measurement Context A Runtime Monitor 08/16/23 Performance Monitoring of Diverse Computer Systems 30
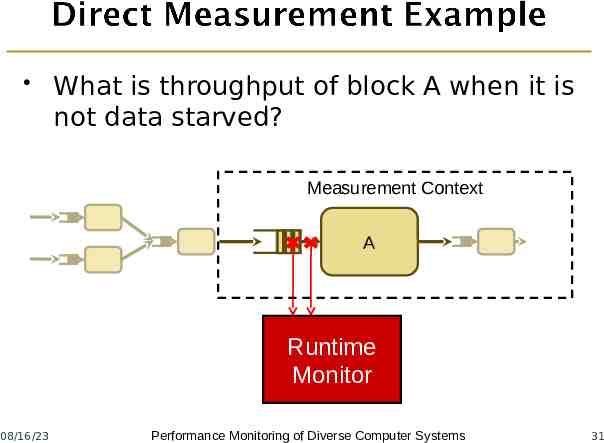
What is throughput of block A when it is not data starved? Measurement Context A Runtime Monitor 08/16/23 Performance Monitoring of Diverse Computer Systems 31
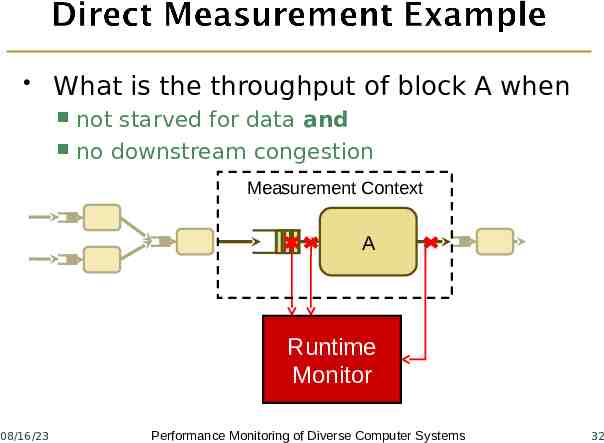
What is the throughput of block A when not starved for data and no downstream congestion Measurement Context A Runtime Monitor 08/16/23 Performance Monitoring of Diverse Computer Systems 32
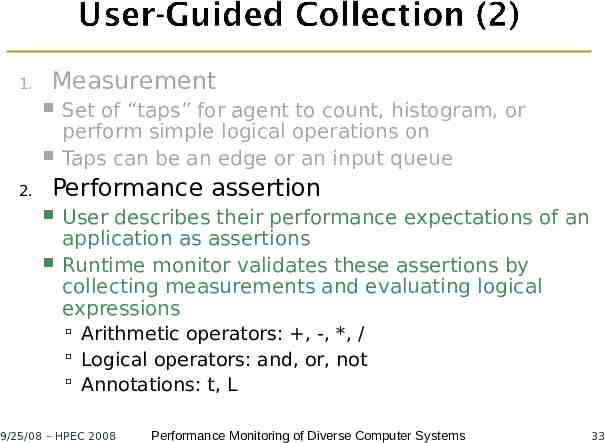
1. Measurement 2. Set of “taps” for agent to count, histogram, or perform simple logical operations on Taps can be an edge or an input queue Performance assertion User describes their performance expectations of an application as assertions Runtime monitor validates these assertions by collecting measurements and evaluating logical expressions Arithmetic operators: , -, *, / Logical operators: and, or, not Annotations: t, L 9/25/08 – HPEC 2008 Performance Monitoring of Diverse Computer Systems 33
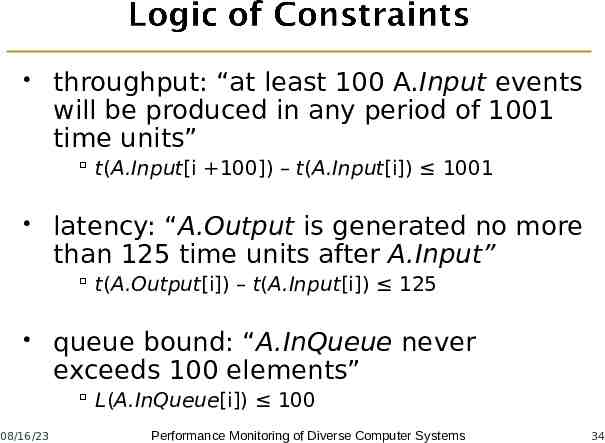
throughput: “at least 100 A.Input events will be produced in any period of 1001 time units” t(A.Input[i 100]) – t(A.Input[i]) 1001 latency: “A.Output is generated no more than 125 time units after A.Input” t(A.Output[i]) – t(A.Input[i]) 125 queue bound: “A.InQueue never exceeds 100 elements” L(A.InQueue[i]) 100 08/16/23 Performance Monitoring of Diverse Computer Systems 34
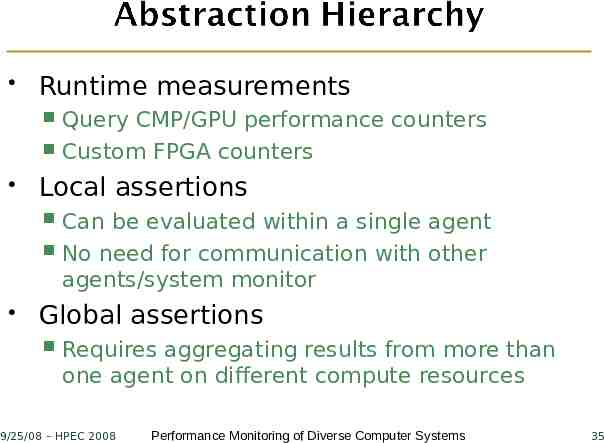
Runtime measurements Query CMP/GPU performance counters Custom FPGA counters Local assertions Can be evaluated within a single agent No need for communication with other agents/system monitor Global assertions Requires aggregating results from more than one agent on different compute resources 9/25/08 – HPEC 2008 Performance Monitoring of Diverse Computer Systems 35
Some assertions impose prohibitive memory requirements Either disallow these or warn user of large monitoring impact Other assertions are compute intensive A few are both! Fortunately, much can be gained from simple queries Input queue lengths over time 9/25/08 – HPEC 2008 Performance Monitoring of Diverse Computer Systems 36
FPGA Agent mostly operational Monitor only, no user assertions yet Initial target application is the BLAST biosequence analysis application CPU FPGA hardware platform [Jacob, et al. TRETS ’08] Next target application is computational finance CPU GPU FPGA Performance significantly worse than models 9/25/08 – HPEC 2008 Performance Monitoring of Diverse Computer Systems 37
Runtime performance monitoring enables More efficient development Better testing for real-time systems Support correctness assertions Investigate ways to best present results to developer 9/25/08 – HPEC 2008 Performance Monitoring of Diverse Computer Systems 38