Investigating the Physics of the Tokamak Operational Boundaries


17 Slides1.26 MB
Investigating the Physics of the Tokamak Operational Boundaries using Machine Learning Tools Authors: A. Murari, E. Peluso, M. Lungaroni and M. Gelfusa
Machine learning for disruption prediction Disruptions have proved to be unavoidable in present day Tokamaks particularly when reducing q95 towards 3. Simulators based on plasma physics first principles are being developed but they are challenging. In the past decades quite satisfactory Machine Learning predictors have been deployed in particular on JET. ML tools are typically criticised because they are difficult to interpret (poor physics fidelity) and have insufficient performance (obsolescence, too much data needed for the training etc).
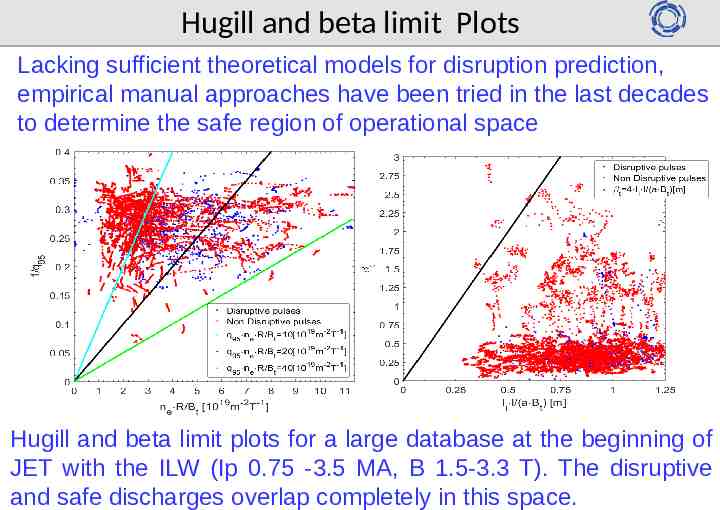
Hugill and beta limit Plots Lacking sufficient theoretical models for disruption prediction, empirical manual approaches have been tried in the last decades to determine the safe region of operational space Hugill and beta limit plots for a large database at the beginning of JET with the ILW (Ip 0.75 -3.5 MA, B 1.5-3.3 T). The disruptive and safe discharges overlap completely in this space.
INTERPRETABILITY and PHYSICS FIDELITY Machine learning tools have proved to be very effective: APODIS originally had about 97% of success rate and a few % of false alarms. It had reasonable performance even last year campaign (last discharge in the training set dates back to 2009) Machine learning tools can learn something fundamental about disruptions. This is proved by the good performance and relatively low obsolescence. On the other hand, having been developed mainly for the private sector, they have a poor “physics fidelity” The proposed line of research intends to investigate to what extent machine learning tools can be used to identify practically useful and physically meaningful models of the boundary between safe and disruptive regions of the operational space.
How to improve the Physics Fidelity of the Models The developed method aims at combining the success rate of ML tools with the advantages of a formulation of the results in traditional mathematical form. The technique consists of the following main steps: 1- Deploy ML tools for feature extraction 2- Training the ML tools for classification 3- Determining a sufficient number of points on the boundary identified by the ML tools 4- Deploying symbolic regression via genetic programming to derive the equation of the from these points boundary
Genetic Algorithms and Programs GAs and GPs work with a population of individuals. Each individual represents a possible solution to a problem. The quality of each individual (possible solution) is evaluated in terms of a fitness function. A higher probability to have descendants is assigned to individuals with better fitness functions. Symbolic regression via GP is basically the application of Genetic Programing to mathematical symbols in order to extract equations directly from the databases.
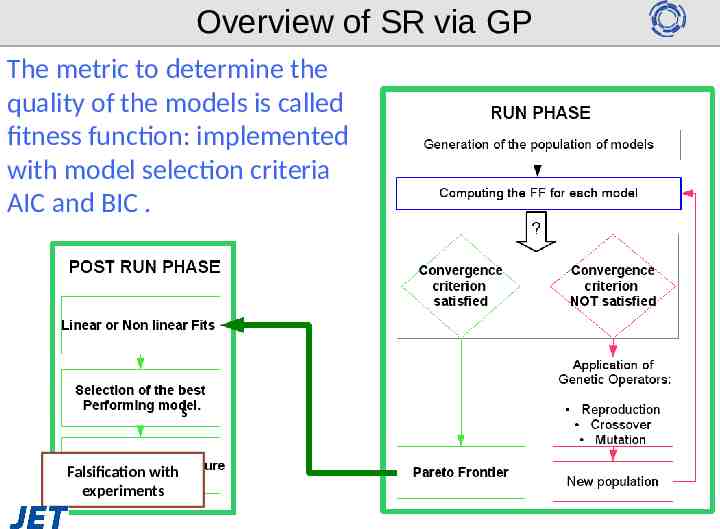
Overview of SR via GP The metric to determine the quality of the models is called fitness function: implemented with model selection criteria AIC and BIC . s Falsification with experiments
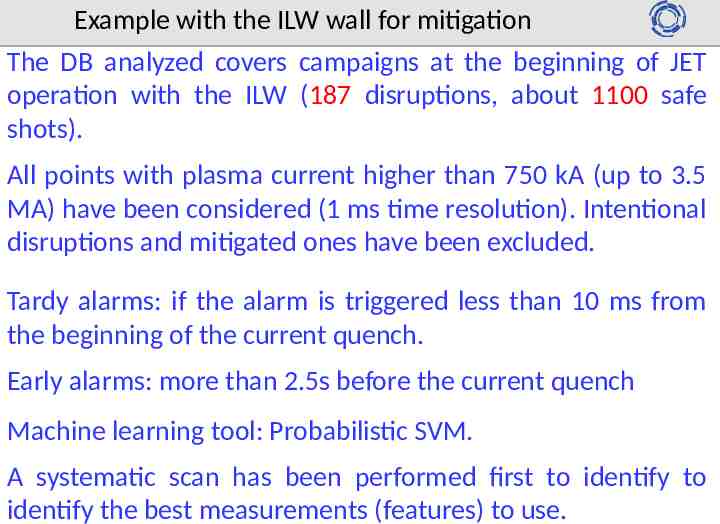
Example with the ILW wall for mitigation The DB analyzed covers campaigns at the beginning of JET operation with the ILW (187 disruptions, about 1100 safe shots). All points with plasma current higher than 750 kA (up to 3.5 MA) have been considered (1 ms time resolution). Intentional disruptions and mitigated ones have been excluded. Tardy alarms: if the alarm is triggered less than 10 ms from the beginning of the current quench. Early alarms: more than 2.5s before the current quench Machine learning tool: Probabilistic SVM. A systematic scan has been performed first to identify to identify the best measurements (features) to use.
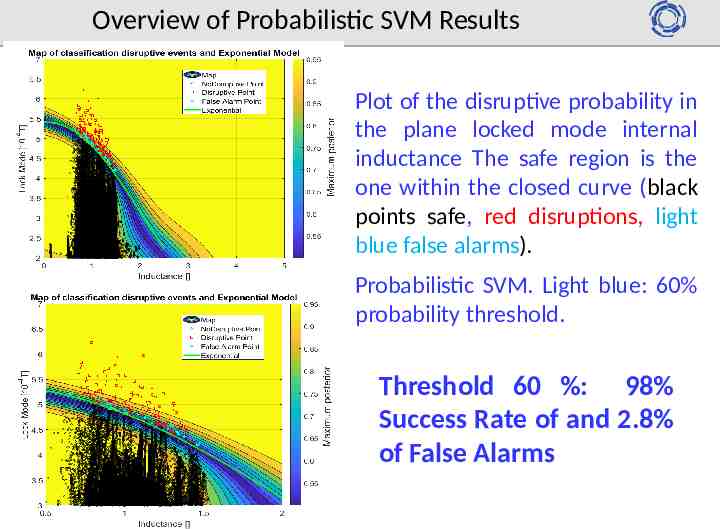
Overview of Probabilistic SVM Results Plot of the disruptive probability in the plane locked mode internal inductance The safe region is the one within the closed curve (black points safe, red disruptions, light blue false alarms). Probabilistic SVM. Light blue: 60% probability threshold. Threshold 60 %: 98% Success Rate of and 2.8% of False Alarms
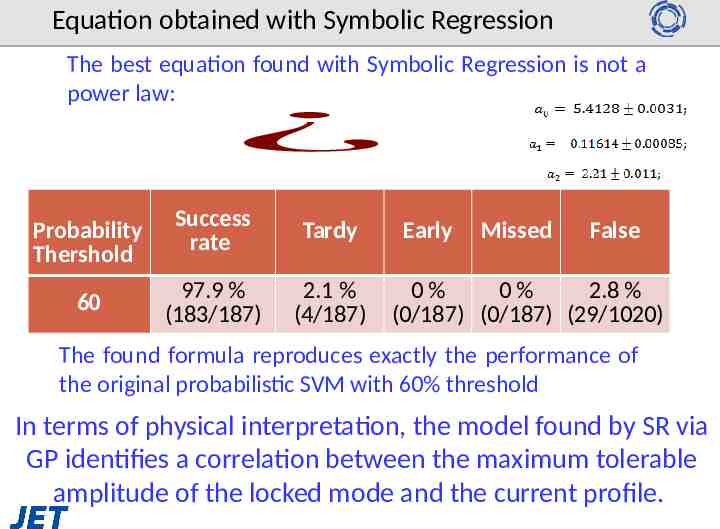
Equation obtained with Symbolic Regression The best equation found with Symbolic Regression is not a power law: ¿ Probability Thershold Success rate Tardy 60 97.9 % (183/187) 2.1 % (4/187) Early Missed False 0% 0% 2.8 % (0/187) (0/187) (29/1020) The found formula reproduces exactly the performance of the original probabilistic SVM with 60% threshold In terms of physical interpretation, the model found by SR via GP identifies a correlation between the maximum tolerable amplitude of the locked mode and the current profile.
Overview of a Multimachine Model In a recent study, the amplitude of the locked mode, the consequence of magnetic islands locked to the wall, is studied in JET, ASDEX-U and COMPASS. The simple locking of the magnetic configuration to the wall is not deemed a sufficient condition per se to trigger disruptions; the amplitude is claimed to be the relevant quantity. Based on theoretical considerations involving the Chirickov criterion, the amplitude of the island size required to trigger a disruption was determined. A scaling for the value of the locked mode amplitude, considered the limit for the triggering a disruption is: 𝑎𝐼 𝑃 𝑎𝑎 𝑎𝑞 95 𝐵𝑀𝐿 (𝑟 𝑐 ) 𝑐 𝐼 𝑎 𝑞 ¿ ¿
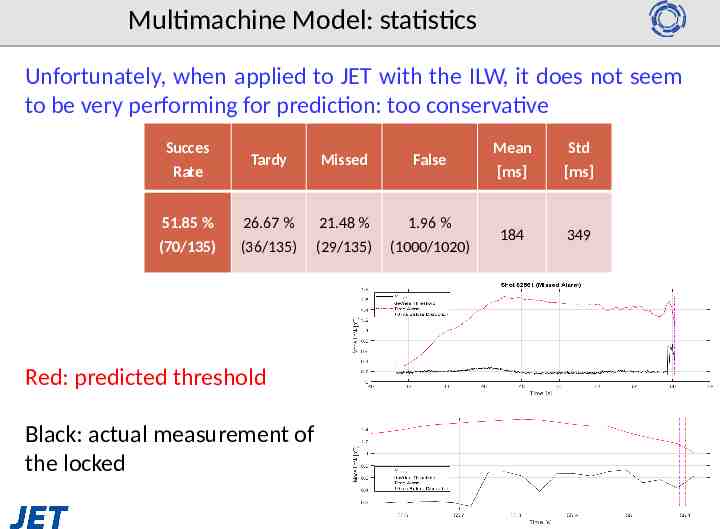
Multimachine Model: statistics Unfortunately, when applied to JET with the ILW, it does not seem to be very performing for prediction: too conservative Succes Rate Tardy Missed False Mean [ms] Std [ms] 51.85 % (70/135) 26.67 % (36/135) 21.48 % (29/135) 1.96 % (1000/1020) 184 349 Red: predicted threshold Black: actual measurement of the locked
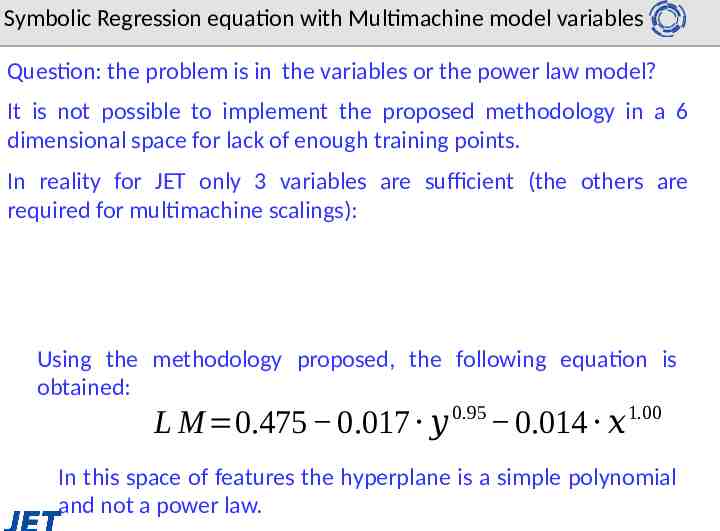
Symbolic Regression equation with Multimachine model variables Question: the problem is in the variables or the power law model? It is not possible to implement the proposed methodology in a 6 dimensional space for lack of enough training points. In reality for JET only 3 variables are sufficient (the others are required for multimachine scalings): Using the methodology proposed, the following equation is obtained: L M 0.475 0.017 𝑦 0.95 0.014 𝑥 1.00 In this space of features the hyperplane is a simple polynomial and not a power law.
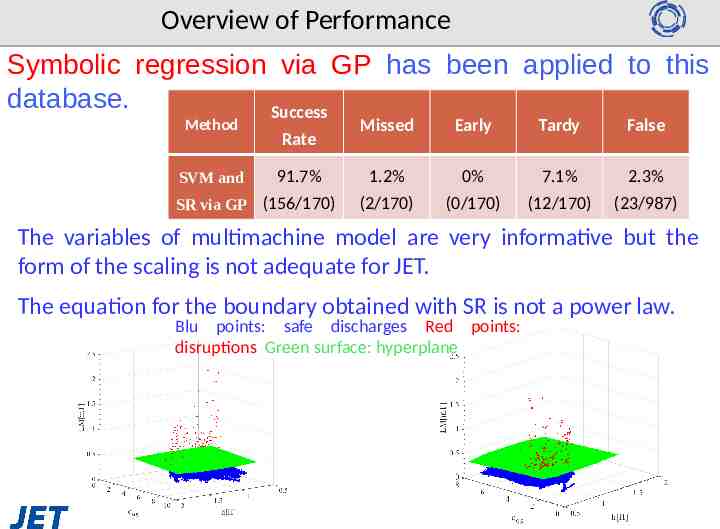
Overview of Performance Symbolic regression via GP has been applied to this database. Success Method Rate Missed Early Tardy False SVM and 91.7% 1.2% 0% 7.1% 2.3% SR via GP (156/170) (2/170) (0/170) (12/170) (23/987) The variables of multimachine model are very informative but the form of the scaling is not adequate for JET. The equation for the boundary obtained with SR is not a power law. Blu points: safe discharges Red points: disruptions Green surface: hyperplane
Conclusions and Future Work (1) A method has been devised that allows deriving the equations of the boundary between safe and disruptive regions of the operational space directly from the data and with a minimum of “a priori” hypotheses. The exploratory phase is performed by machine learning tools. Symbolic regression is used to convert the points on the boundary identified by the ML tools into interpretable and physically meaningful equations. The success rate of the resulting formulas is almost identical to the ML tools: at least for this problem there is no penalty for reformulating the model in a simpler form.
Conclusions and Future Work (2) The proposed methodology involves almost all the basics threads of machine learning (symbolic manipulation, Bayesian statistics, Genetic Programming, etc. ), each one devoted to a specific task. The technique can be applied to any type of classifier, which can output a probability (ANN, SVM, Bayesian etc.); for other ML tools solutions have been developed In the near future it is planned a) to provide the equations of the boundary between the safe and disruptive regions of the operational space for avoidance b) to apply the same methodology for deriving the equation of the boundary between different types of disruptions.
Thanks for Your Attention! QUESTIONS?