Introductory Psychology: Statistical Analysis A P P S Y C H O L O G Y:
24 Slides2.14 MB
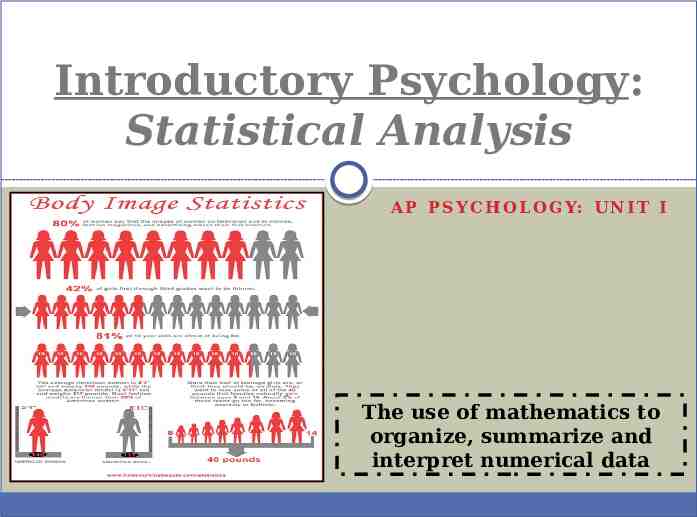
Introductory Psychology: Statistical Analysis A P P S Y C H O L O G Y: U N I T I The use of mathematics to organize, summarize and interpret numerical data
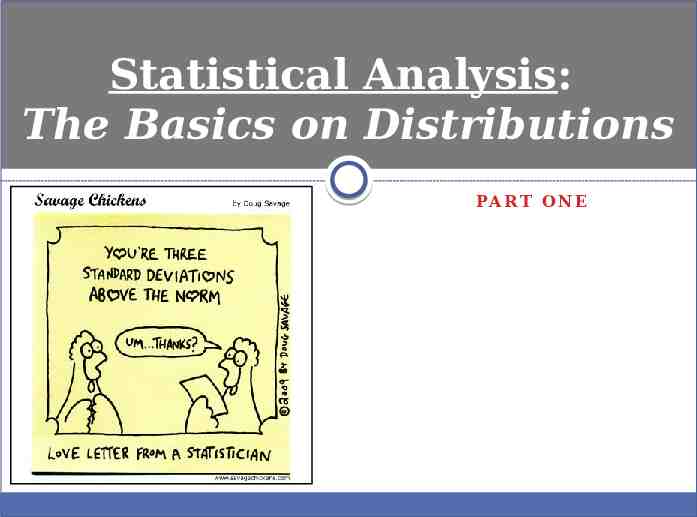
Statistical Analysis: The Basics on Distributions PA R T O N E
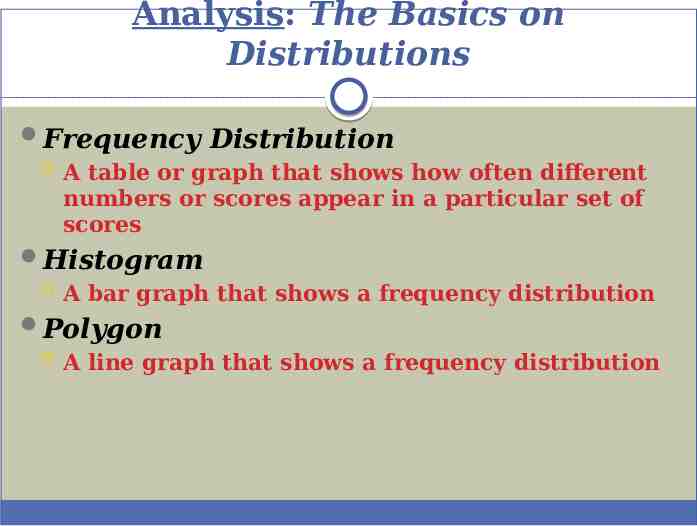
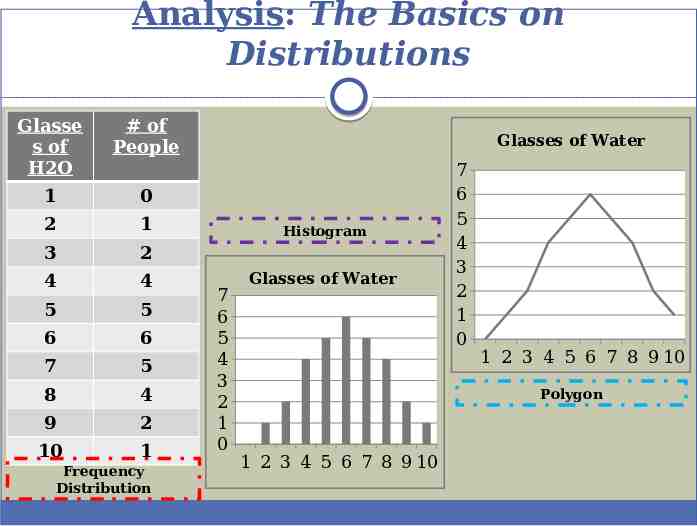
Analysis: The Basics on Distributions Frequency Distribution A table or graph that shows how often different numbers or scores appear in a particular set of scores Histogram A bar graph that shows a frequency distribution Polygon A line graph that shows a frequency distribution
Analysis: The Basics on Distributions Glasse s of H2O # of People 1 0 2 1 3 2 4 4 5 5 6 6 7 5 8 4 9 2 10 1 Frequency Distribution Glasses of Water Histogram 7 6 5 4 3 2 1 0 Glasses of Water 7 6 5 4 3 2 1 0 1 2 3 4 5 6 7 8 9 10 Polygon 1 2 3 4 5 6 7 8 9 10
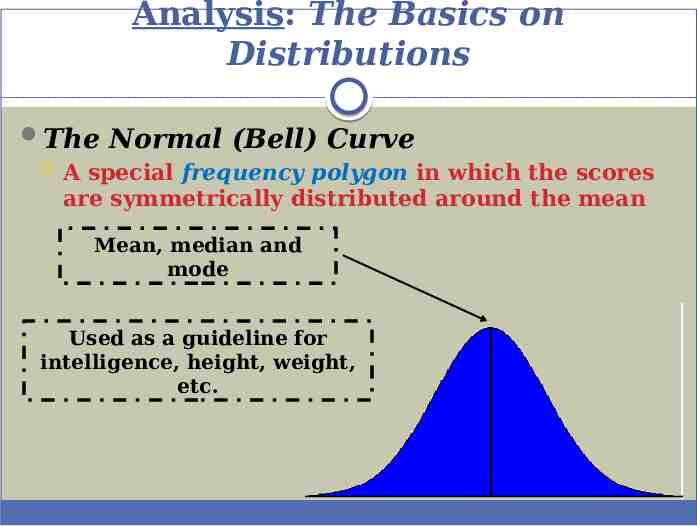
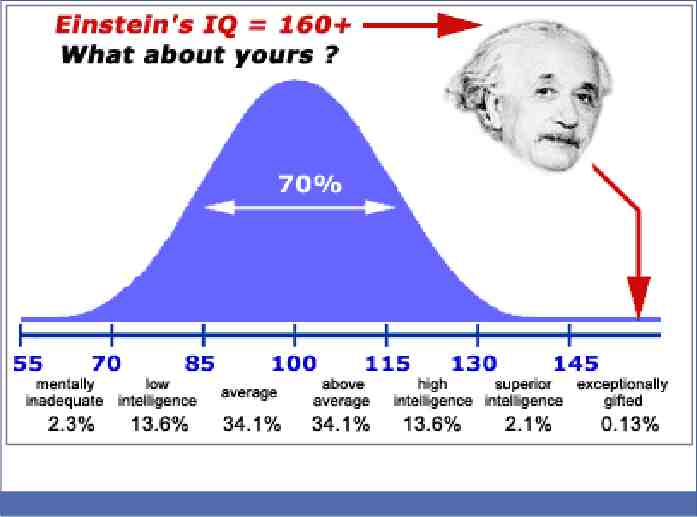
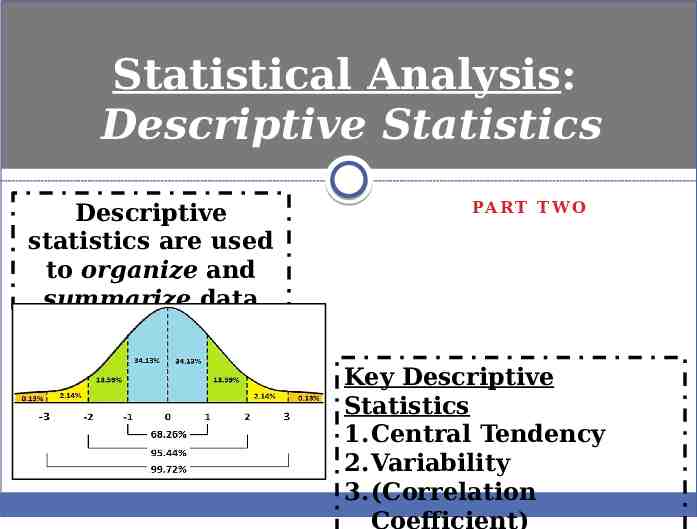
Analysis: The Basics on Distributions The Normal (Bell) Curve A special frequency polygon in which the scores are symmetrically distributed around the mean Mean, median and mode Used as a guideline for intelligence, height, weight, etc.
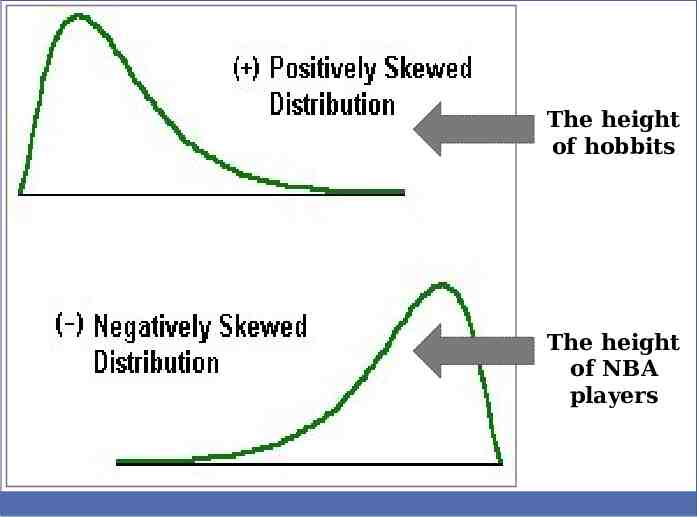
Analysis: The Basics on Distributions Positively Skewed Distribution Scores are concentrated at the low end of the distribution Negatively Skewed Distribution Scores are concentrated at the high end of the distribution Bimodal Distribution Frequency distribution in which there are two high points rather than one
The height of hobbits The height of NBA players
Statistical Analysis: Descriptive Statistics Descriptive statistics are used to organize and summarize data PA R T T W O Key Descriptive Statistics 1.Central Tendency 2.Variability 3.(Correlation Coefficient)
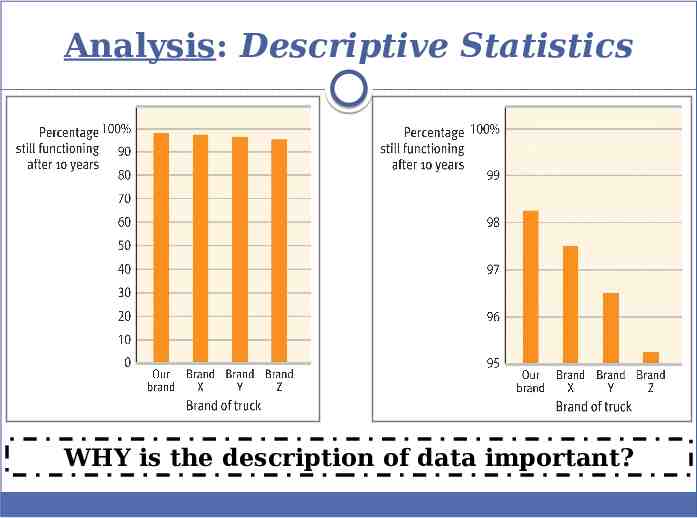
Analysis: Descriptive Statistics WHY is the description of data important?
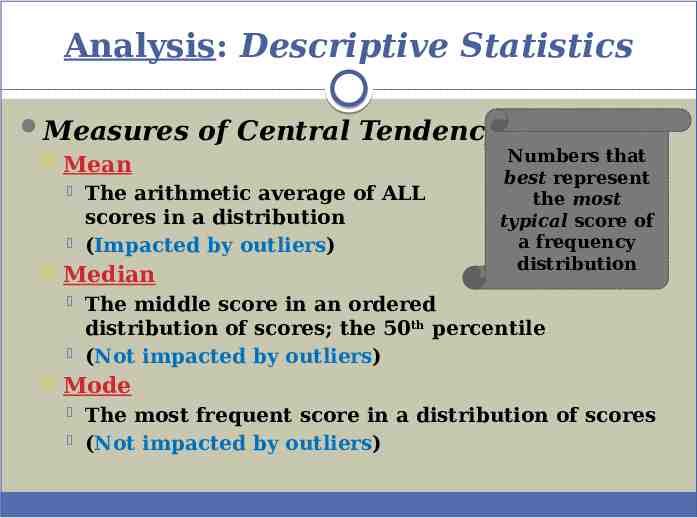
Analysis: Descriptive Statistics Measures of Central Tendency Numbers that Mean Median The arithmetic average of ALL scores in a distribution (Impacted by outliers) best represent the most typical score of a frequency distribution The middle score in an ordered distribution of scores; the 50th percentile (Not impacted by outliers) Mode The most frequent score in a distribution of scores (Not impacted by outliers)
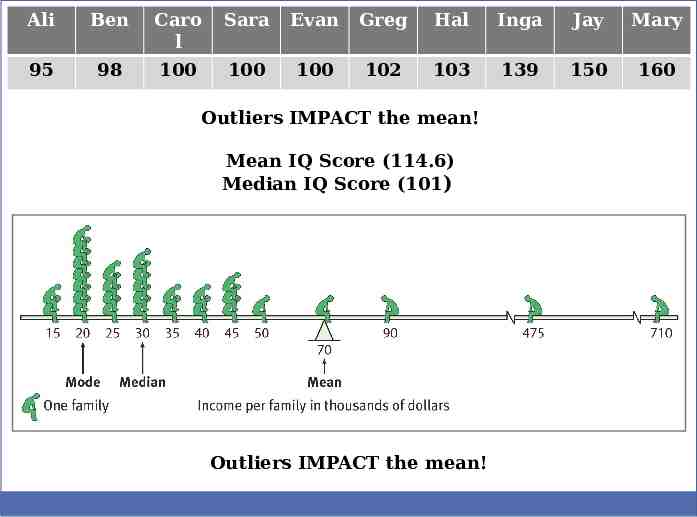
Ali Ben Caro l Sara Evan Greg Hal Inga Jay Mary 95 98 100 100 100 102 103 139 150 160 Outliers IMPACT the mean! Mean IQ Score (114.6) Median IQ Score (101) Outliers IMPACT the mean!
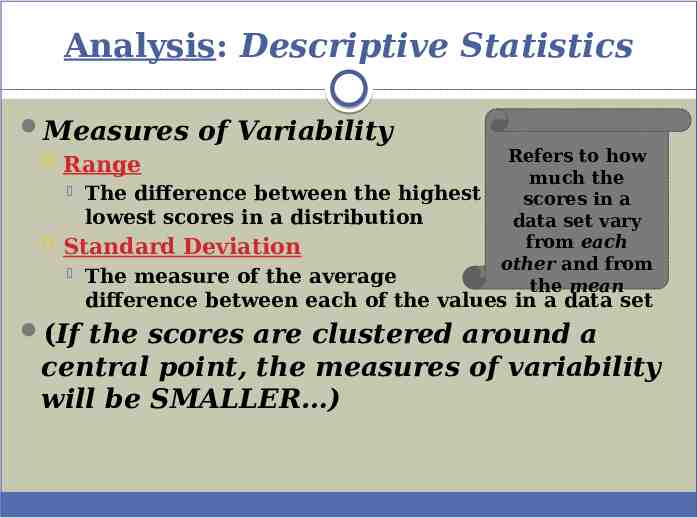
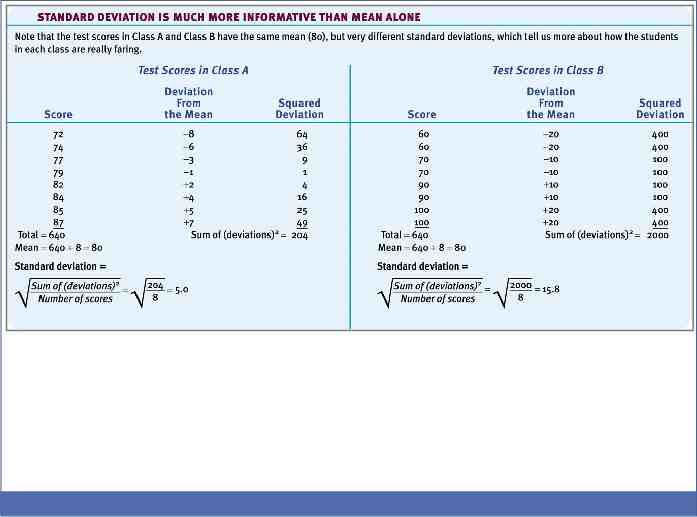
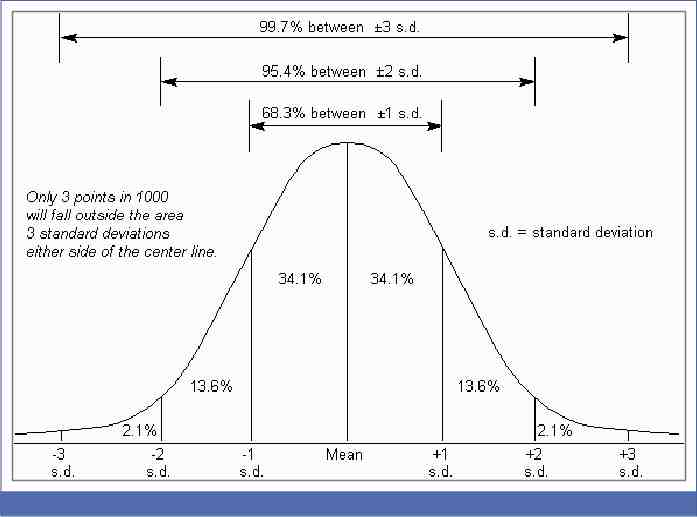
Analysis: Descriptive Statistics Measures of Variability Range Refers to how much the The difference between the highest & scores in a lowest scores in a distribution data set vary from each Standard Deviation other and from The measure of the average the mean difference between each of the values in a data set (If the scores are clustered around a central point, the measures of variability will be SMALLER )
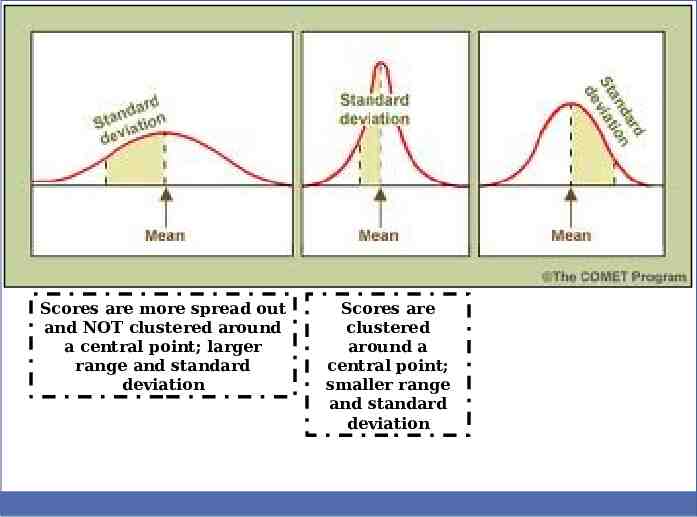
Scores are more spread out and NOT clustered around a central point; larger range and standard deviation Scores are clustered around a central point; smaller range and standard deviation
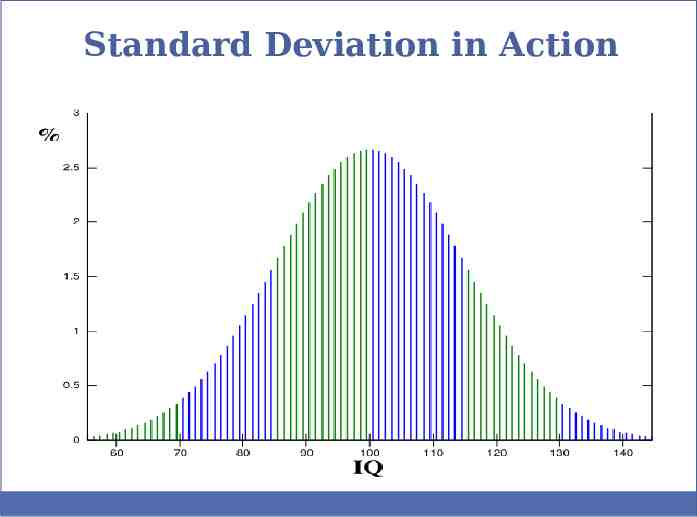
Standard Deviation in Action
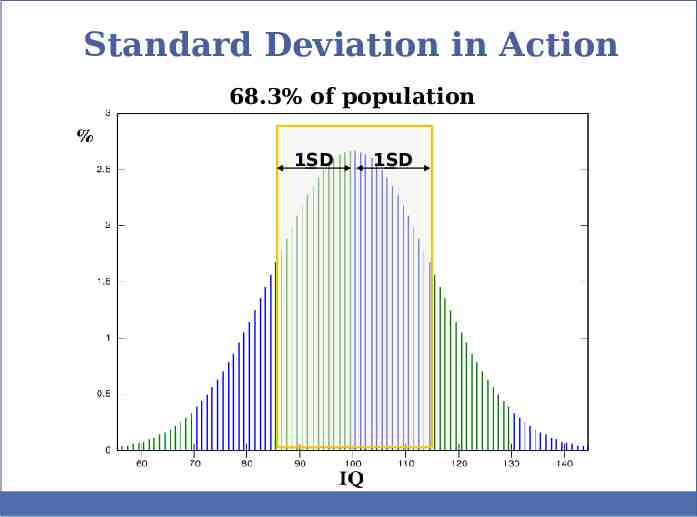
Standard Deviation in Action 68.3% of population 1SD 1SD
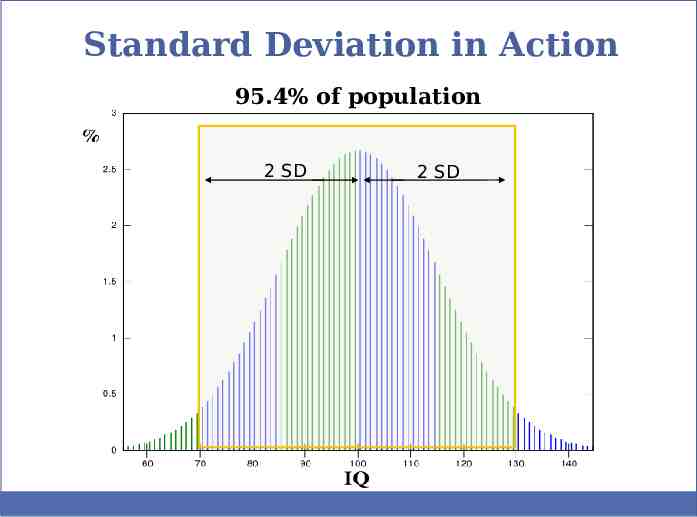
Standard Deviation in Action 95.4% of population 2 SD 2 SD
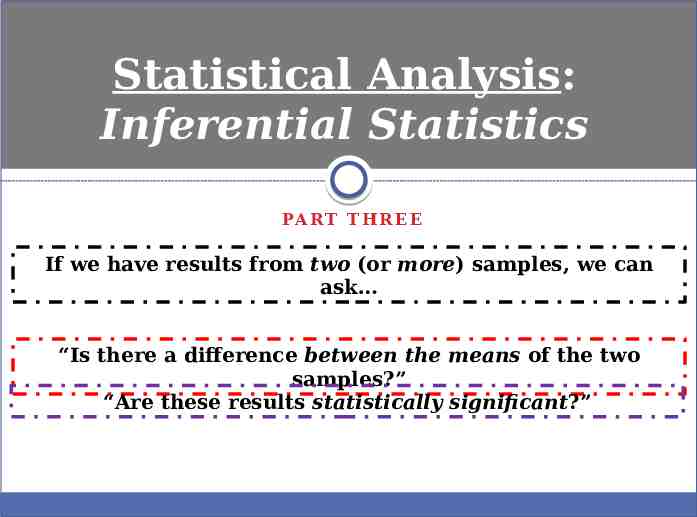
Statistical Analysis: Inferential Statistics PA R T T H R E E If we have results from two (or more) samples, we can ask “Is there a difference between the means of the two samples?” “Are these results statistically significant?”
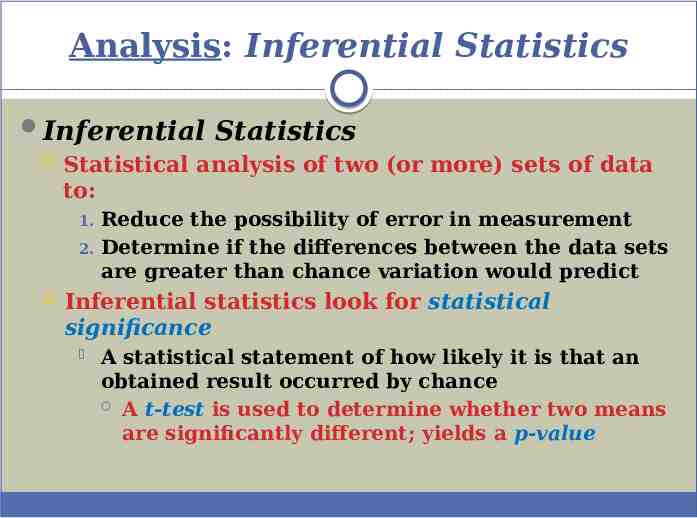
Analysis: Inferential Statistics Inferential Statistics Statistical analysis of two (or more) sets of data to: 1. 2. Reduce the possibility of error in measurement Determine if the differences between the data sets are greater than chance variation would predict Inferential statistics look for statistical significance A statistical statement of how likely it is that an obtained result occurred by chance A t-test is used to determine whether two means are significantly different; yields a p-value
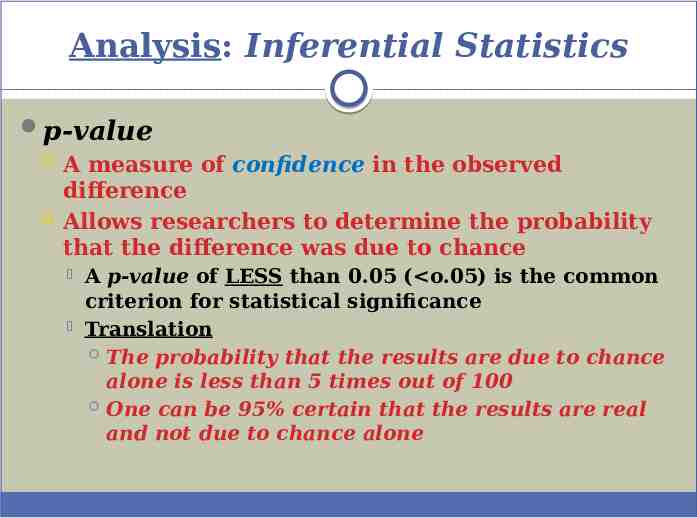
Analysis: Inferential Statistics p-value A measure of confidence in the observed difference Allows researchers to determine the probability that the difference was due to chance A p-value of LESS than 0.05 ( o.05) is the common criterion for statistical significance Translation The probability that the results are due to chance alone is less than 5 times out of 100 One can be 95% certain that the results are real and not due to chance alone
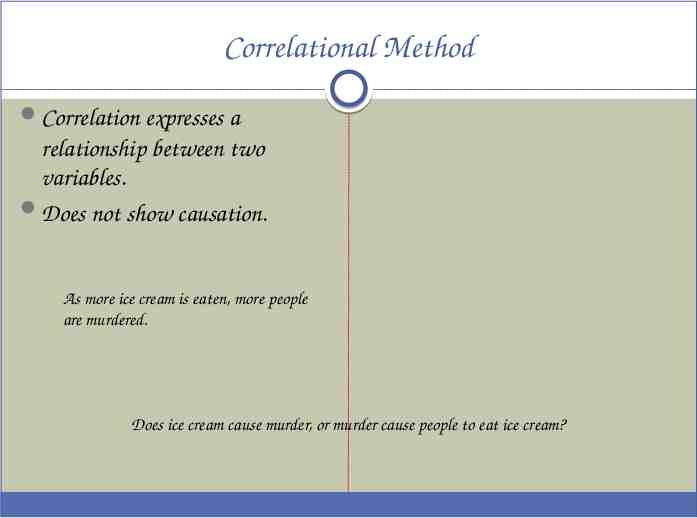
Correlational Method Correlation expresses a relationship between two variables. Does not show causation. As more ice cream is eaten, more people are murdered. Does ice cream cause murder, or murder cause people to eat ice cream?
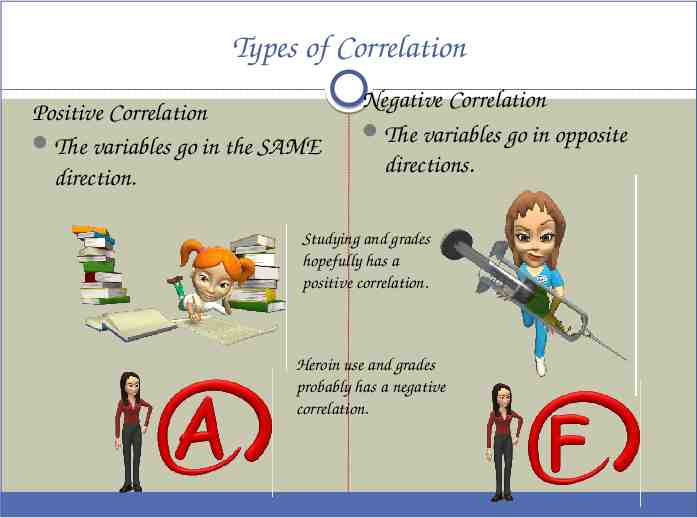
Types of Correlation Positive Correlation The variables go in the SAME direction. Negative Correlation The variables go in opposite directions. Studying and grades hopefully has a positive correlation. Heroin use and grades probably has a negative correlation.