HUB Lens: Powered by Artemis


18 Slides5.07 MB
HUB Lens: Powered by Artemis
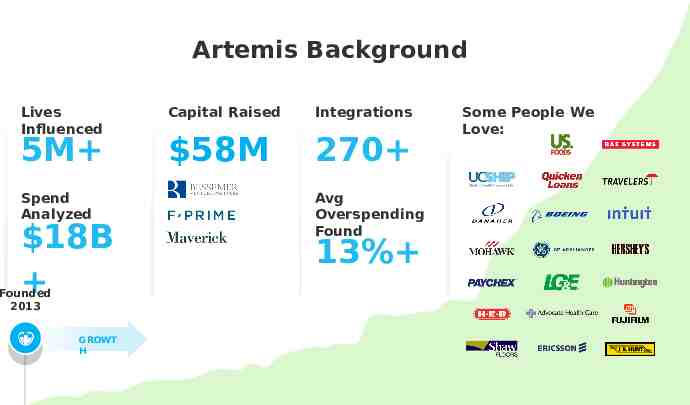
Artemis Background Lives Influenced 5M Spend Analyzed 18B Founded 2013 GROWT H Capital Raised Integrations 58M 270 Avg Overspending Found 13% Some People We Love:
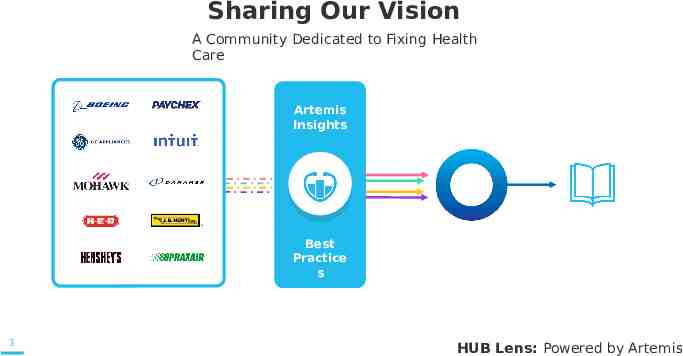
Sharing Our Vision A Community Dedicated to Fixing Health Care Artemis Insights Best Practice s 3 HUB Lens: Powered by Artemis
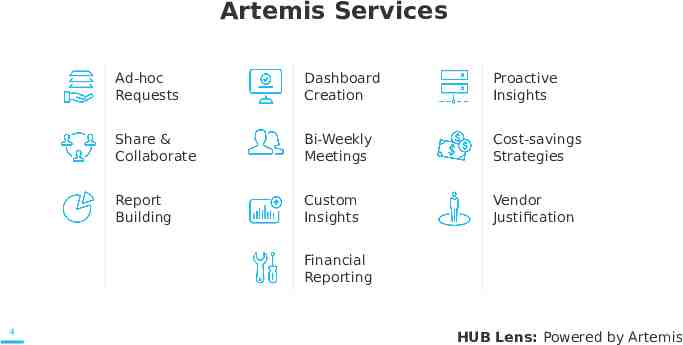
Artemis Services Ad-hoc Requests Dashboard Creation Proactive Insights Share & Collaborate Bi-Weekly Meetings Cost-savings Strategies Report Building Custom Insights Vendor Justification Financial Reporting 4 HUB Lens: Powered by Artemis
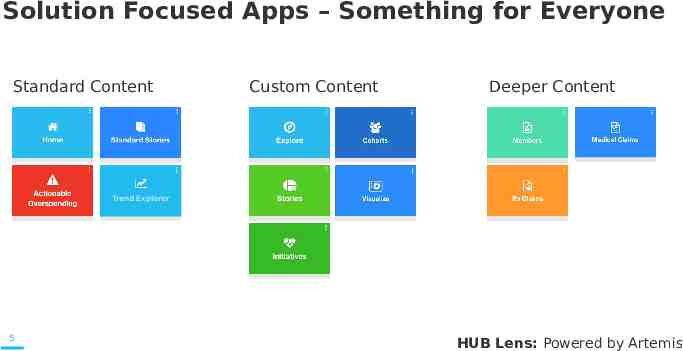
Solution Focused Apps – Something for Everyone Standard Content Custom Content Deeper Content Trend Explorer 5 HUB Lens: Powered by Artemis
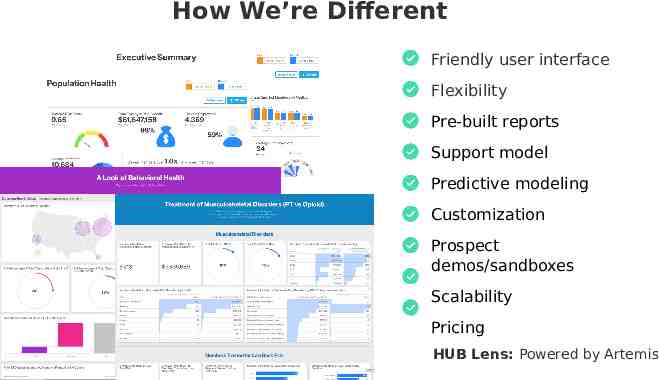
How We’re Different Friendly user interface Flexibility Pre-built reports Support model Predictive modeling Customization Prospect demos/sandboxes Scalability Pricing HUB Lens: Powered by Artemis
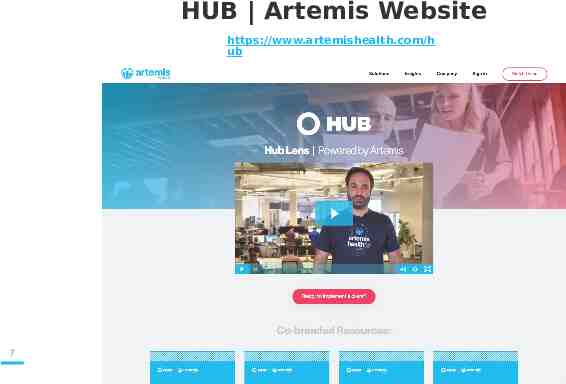
HUB Artemis Website https://www.artemishealth.com/h ub 7
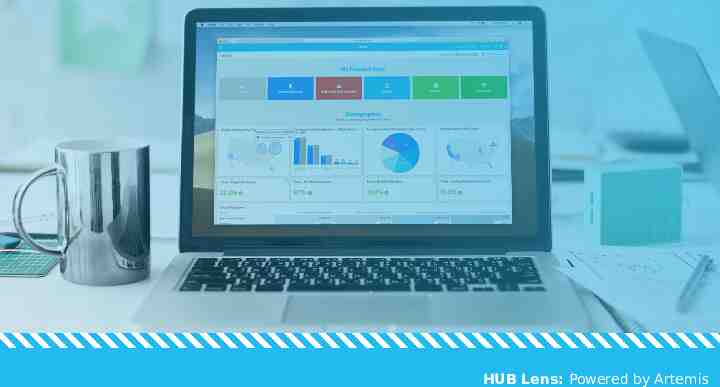
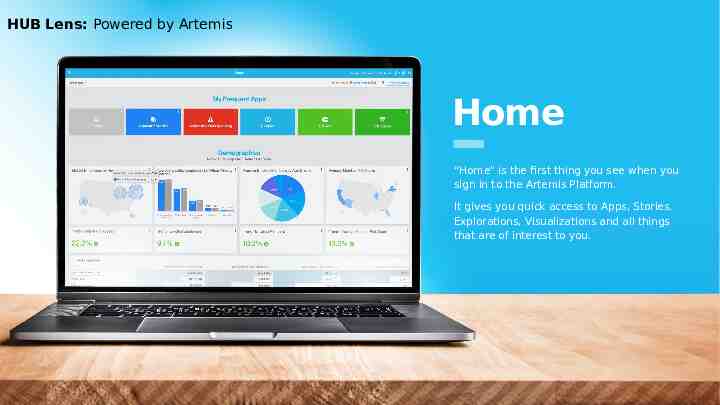
HUB Lens: Powered by Artemis Home “Home" is the first thing you see when you sign in to the Artemis Platform. It gives you quick access to Apps, Stories, Explorations, Visualizations and all things that are of interest to you.
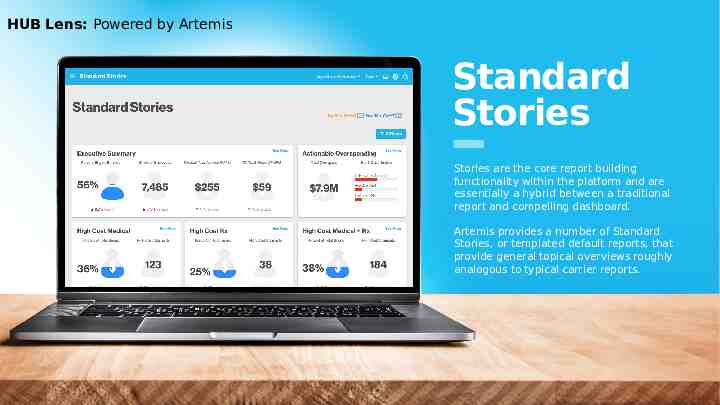
HUB Lens: Powered by Artemis Standard Stories Stories are the core report building functionality within the platform and are essentially a hybrid between a traditional report and compelling dashboard. Artemis provides a number of Standard Stories, or templated default reports, that provide general topical overviews roughly analogous to typical carrier reports.
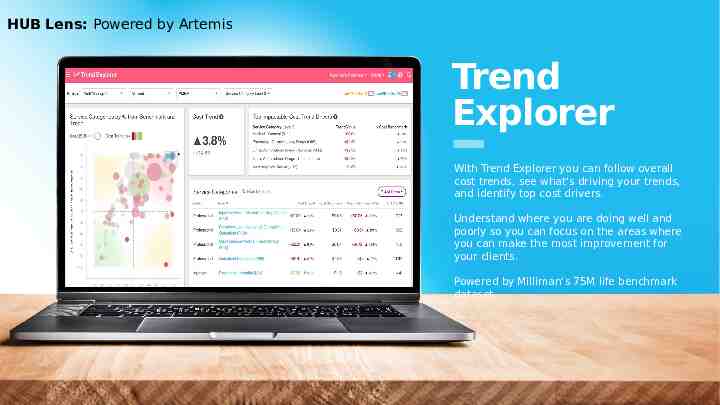
HUB Lens: Powered by Artemis Trend Explorer With Trend Explorer you can follow overall cost trends, see what’s driving your trends, and identify top cost drivers. Understand where you are doing well and poorly so you can focus on the areas where you can make the most improvement for your clients. Powered by Milliman’s 75M life benchmark dataset.
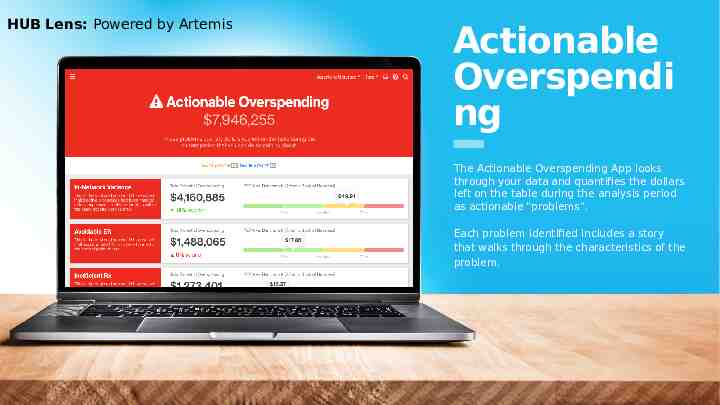
HUB Lens: Powered by Artemis Actionable Overspendi ng The Actionable Overspending App looks through your data and quantifies the dollars left on the table during the analysis period as actionable "problems". Each problem identified includes a story that walks through the characteristics of the problem.
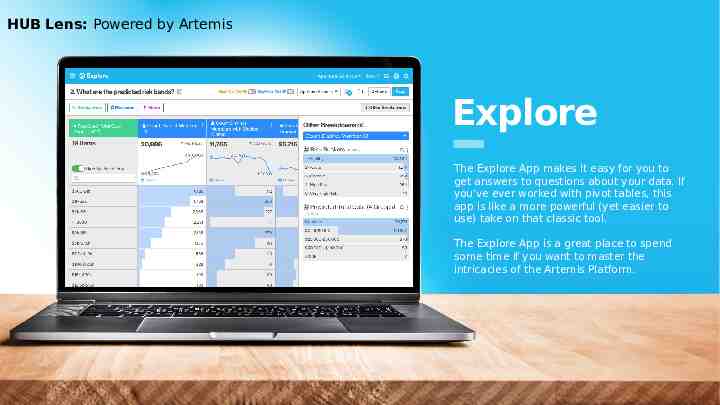
HUB Lens: Powered by Artemis Explore The Explore App makes it easy for you to get answers to questions about your data. If you've ever worked with pivot tables, this app is like a more powerful (yet easier to use) take on that classic tool. The Explore App is a great place to spend some time if you want to master the intricacies of the Artemis Platform.
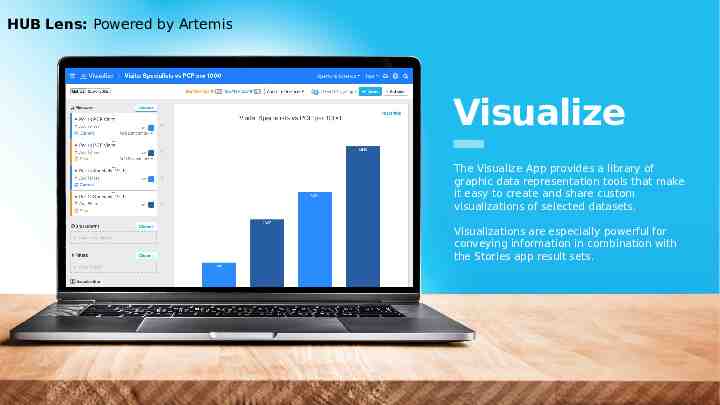
HUB Lens: Powered by Artemis Visualize The Visualize App provides a library of graphic data representation tools that make it easy to create and share custom visualizations of selected datasets. Visualizations are especially powerful for conveying information in combination with the Stories app result sets.
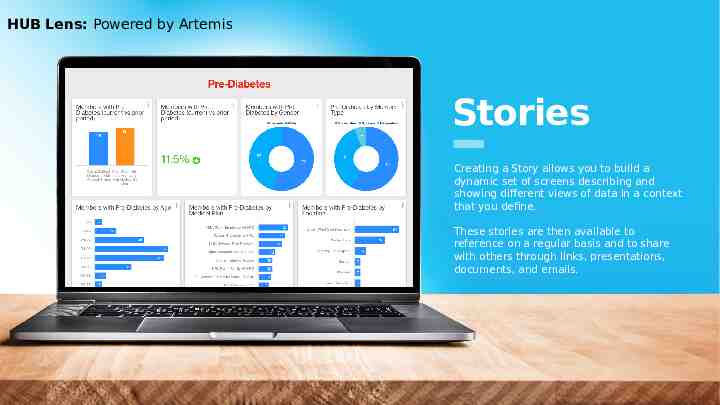
HUB Lens: Powered by Artemis Stories Creating a Story allows you to build a dynamic set of screens describing and showing different views of data in a context that you define. These stories are then available to reference on a regular basis and to share with others through links, presentations, documents, and emails.
HUB Lens: Powered by Artemis Initiatives The Initiatives App lets you measure the impact of new programs or design changes you make to existing benefit programs. Several methodologies are available for quantifying and visualizing impact using matched pairs cohort analysis.
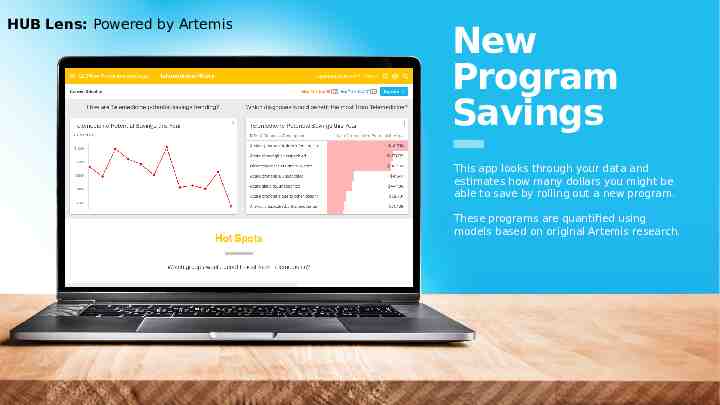
HUB Lens: Powered by Artemis New Program Savings This app looks through your data and estimates how many dollars you might be able to save by rolling out a new program. These programs are quantified using models based on original Artemis research.
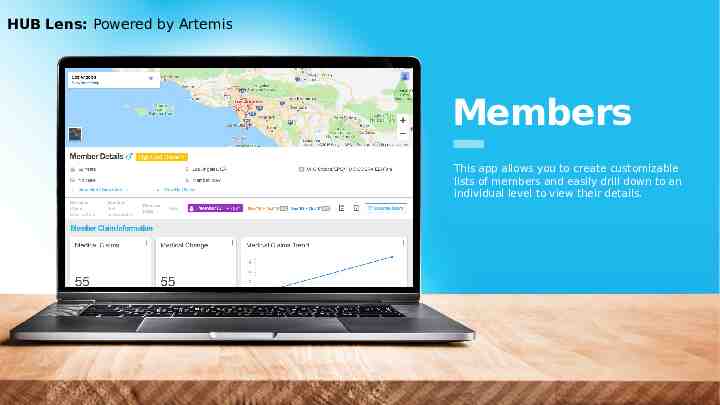
HUB Lens: Powered by Artemis Members This app allows you to create customizable lists of members and easily drill down to an individual level to view their details.
Thank you.