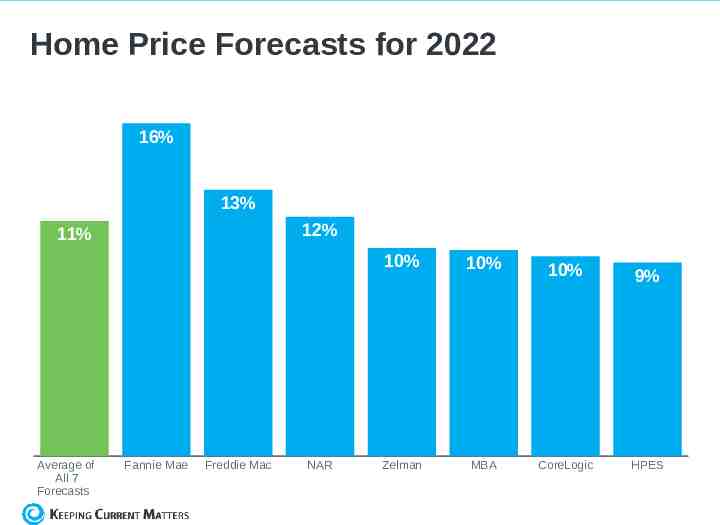
Home Price Forecasts for 2022 16% 13% 12% 11% Average of All

9 Slides206.64 KB
Home Price Forecasts for 2022 16% 13% 12% 11% Average of All 7 Forecasts Fannie Mae Freddie Mac NAR 10% 10% Zelman MBA 10% CoreLogic 9% HPES
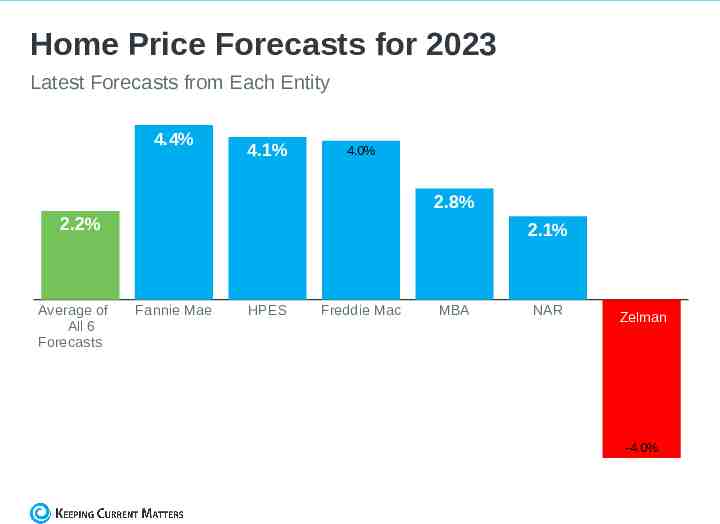
Home Price Forecasts for 2023 Latest Forecasts from Each Entity 4.4% 4.1% 4.0% 2.8% 2.2% Average of All 6 Forecasts 2.1% Fannie Mae HPES Freddie Mac MBA NAR Zelman Zelman -4.0%
The WHY behind home prices
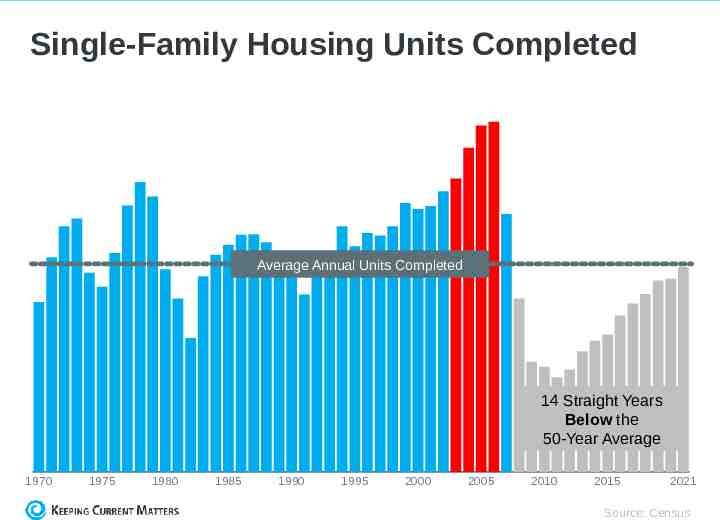
Single-Family Housing Units Completed Average Annual Units Completed 14 Straight Years Below the 50-Year Average 1970 1975 1980 1985 1990 1995 2000 2005 2010 2015 2021 Source: Census
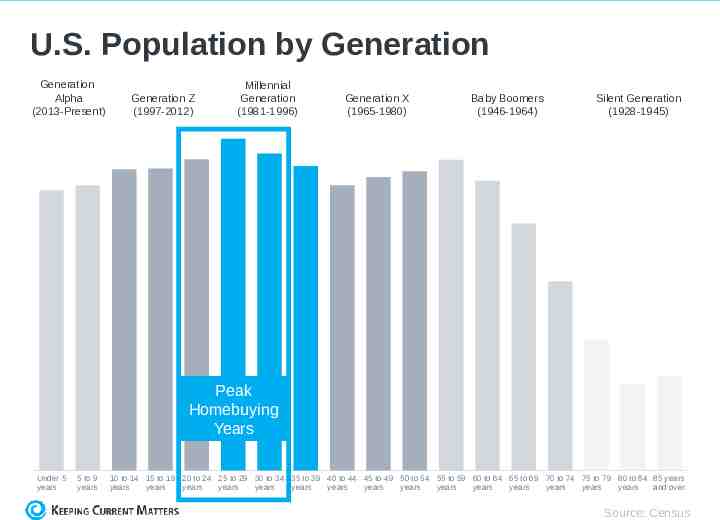
U.S. Population by Generation Generation Alpha (2013-Present) Generation Z (1997-2012) Millennial Generation (1981-1996) Generation X (1965-1980) Baby Boomers (1946-1964) Silent Generation (1928-1945) Peak Homebuying Years Under 5 years 5 to 9 years 10 to 14 15 to 19 20 to 24 25 to 29 30 to 34 35 to 39 40 to 44 45 to 49 50 to 54 55 to 59 60 to 64 65 to 69 70 to 74 75 to 79 80 to 84 85 years years years years years years years years years years years years years years years years and over Source: Census
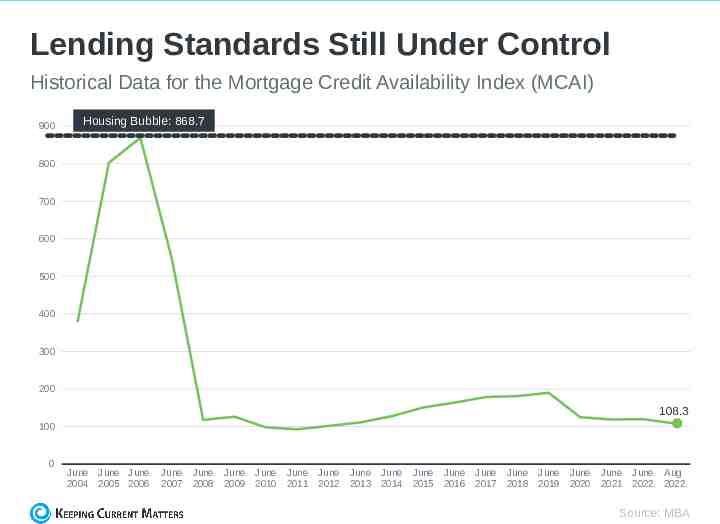
Lending Standards Still Under Control Historical Data for the Mortgage Credit Availability Index (MCAI) 900 Housing Bubble: 868.7 800 700 600 500 400 300 200 108.3 100 0 June 2004 June June 2005 2006 June 2007 June 2008 June 2009 June 2010 June 2011 June 2012 June 2013 June 2014 June 2015 June 2016 June 2017 June 2018 June 2019 June 2020 June 2021 June 2022 Aug 2022 Source: MBA
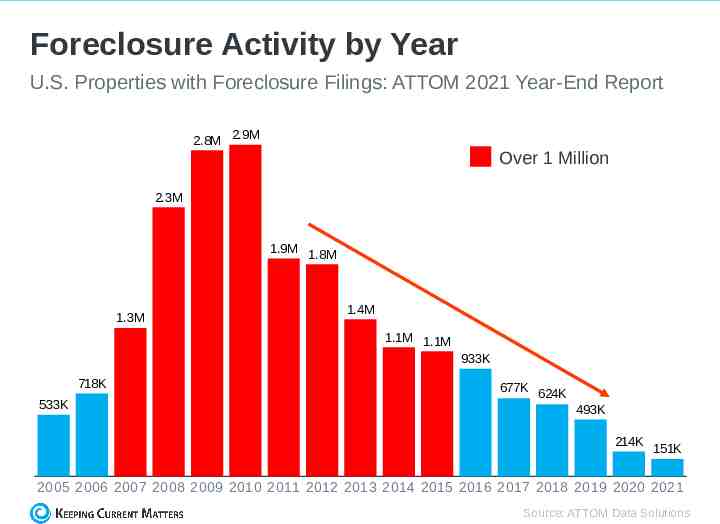
Foreclosure Activity by Year U.S. Properties with Foreclosure Filings: ATTOM 2021 Year-End Report 2.8M 2.9M Over 1 Million 2.3M 1.9M 1.8M 1.3M 1.4M 1.1M 1.1M 933K 718K 533K 677K 624K 493K 214K 151K 2005 2006 2007 2008 2009 2010 2011 2012 2013 2014 2015 2016 2017 2018 2019 2020 2021 Source: ATTOM Data Solutions
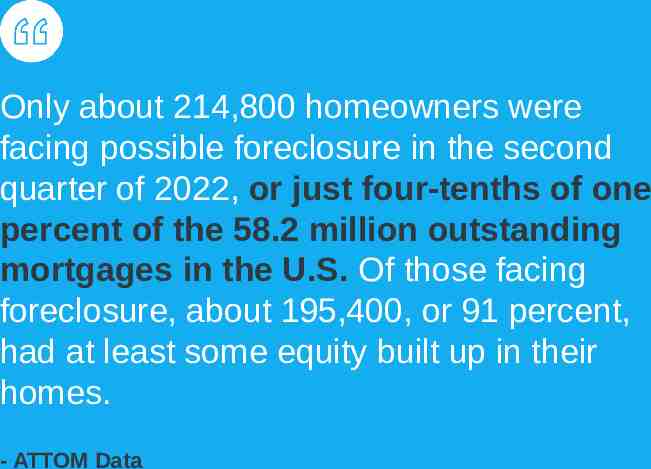
Only about 214,800 homeowners were facing possible foreclosure in the second quarter of 2022, or just four-tenths of one percent of the 58.2 million outstanding mortgages in the U.S. Of those facing foreclosure, about 195,400, or 91 percent, had at least some equity built up in their homes. - ATTOM Data
U.S. households own 41 trillion in owneroccupied real estate, just over 12 trillion in debt, and the remaining 29 trillion in equity. The national "LTV" in Q2 2022 was 29.5%, the lowest since 1983 Homeowners had an average of 320,000 in inflation-adjusted equity in their homes in Q2 2022, an all-time high. - Odeta Kushi, Deputy Chief Economist, First American