Generation X Americans born from 1965 to 1976
31 Slides456.50 KB
Generation X Americans born from 1965 to 1976
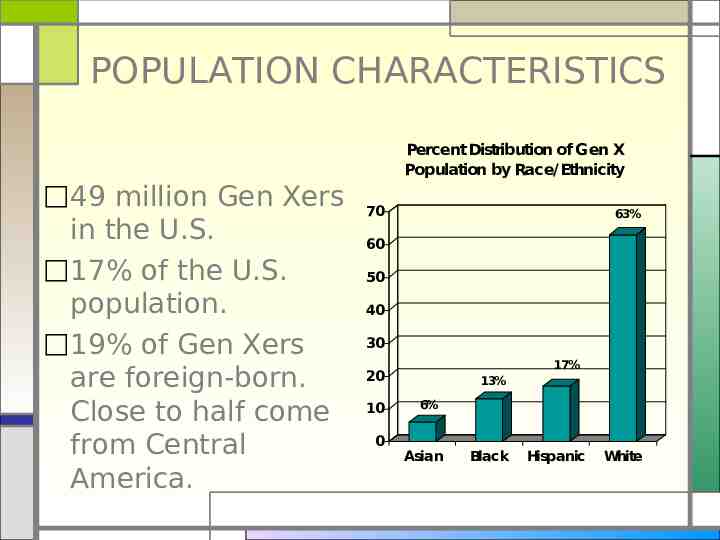
POPULATION CHARACTERISTICS 49 million Gen Xers in the U.S. 17% of the U.S. population. 19% of Gen Xers are foreign-born. Close to half come from Central America. Percent Distribution of Gen X Population by Race/ Ethnicity 70 63% 60 50 40 30 17% 20 10 0 13% 6% Asian Black Hispanic White
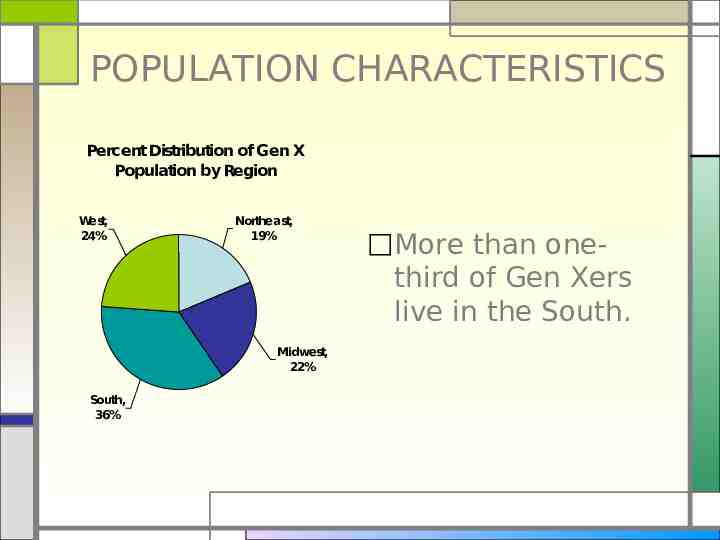
POPULATION CHARACTERISTICS Percent Distribution of Gen X Population by Region West, 24% Northeast, 19% Midwest, 22% South, 36% More than onethird of Gen Xers live in the South.
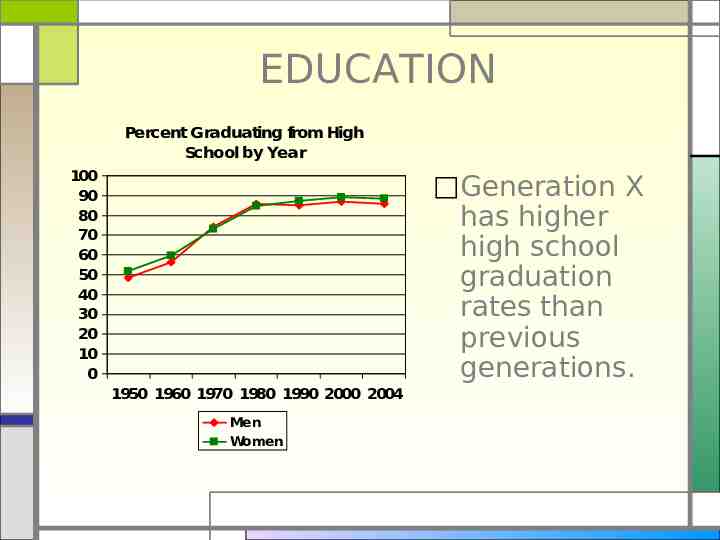
EDUCATION Percent Graduating from High School by Year 100 90 80 70 60 50 40 30 20 10 0 Generation X has higher high school graduation rates than previous generations. 1950 1960 1970 1980 1990 2000 2004 Men Women
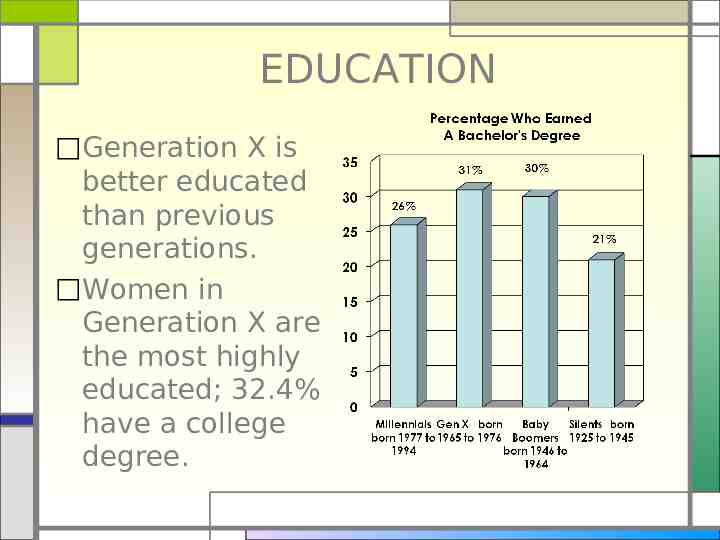
EDUCATION Generation X is better educated than previous generations. Women in Generation X are the most highly educated; 32.4% have a college degree.
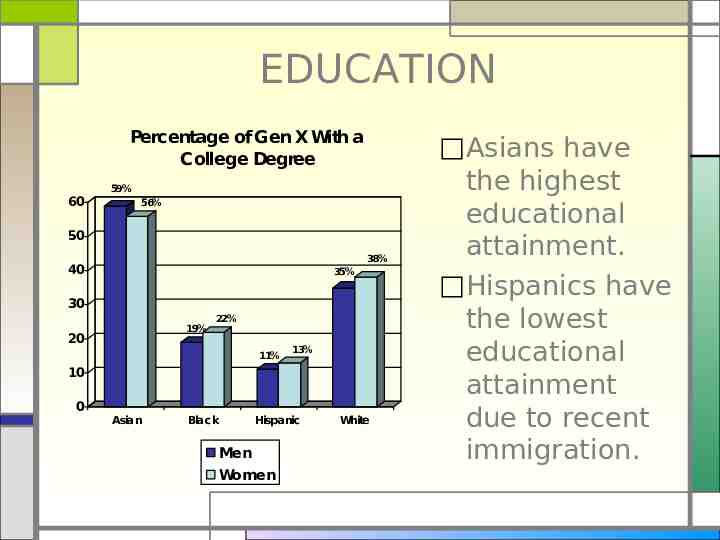
EDUCATION Percentage of Gen X With a College Degree 59% 60 56% 50 38% 40 35% 30 19% 20 22% 11% 13% 10 0 Asian Black Hispanic Men Women White Asians have the highest educational attainment. Hispanics have the lowest educational attainment due to recent immigration.
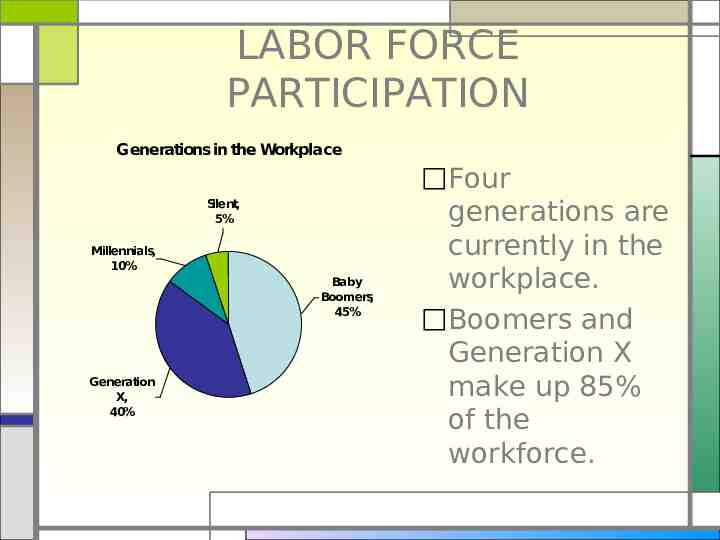
LABOR FORCE PARTICIPATION Generations in the Workplace Silent, 5% Millennials, 10% Baby Boomers, 45% Generation X, 40% Four generations are currently in the workplace. Boomers and Generation X make up 85% of the workforce.
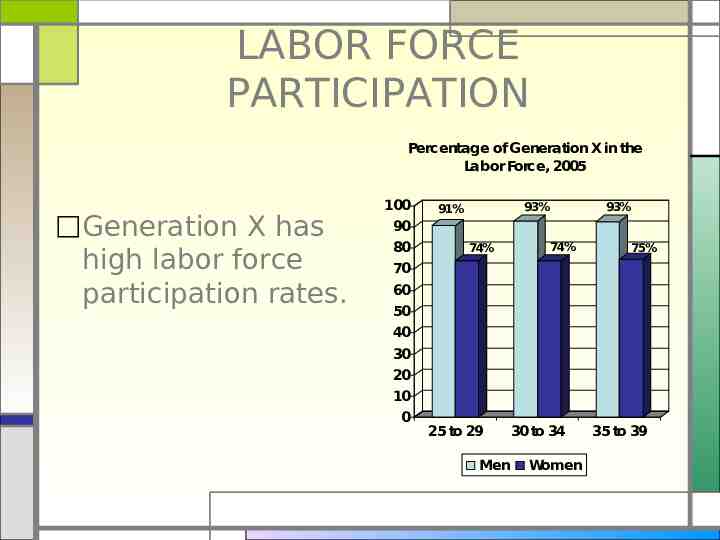
LABOR FORCE PARTICIPATION Percentage of Generation X in the Labor Force, 2005 Generation X has high labor force participation rates. 100 90 80 70 93% 91% 93% 74% 74% 75% 60 50 40 30 20 10 0 25 to 29 30 to 34 Men Women 35 to 39
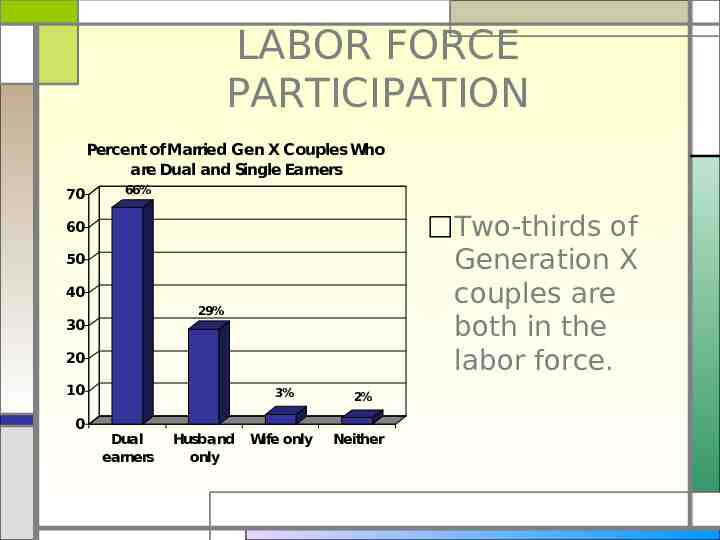
LABOR FORCE PARTICIPATION Percent of Married Gen X Couples Who are Dual and Single Earners 70 66% Two-thirds of Generation X couples are both in the labor force. 60 50 40 29% 30 20 10 0 3% Dual earners Husband only Wife only 2% Neither
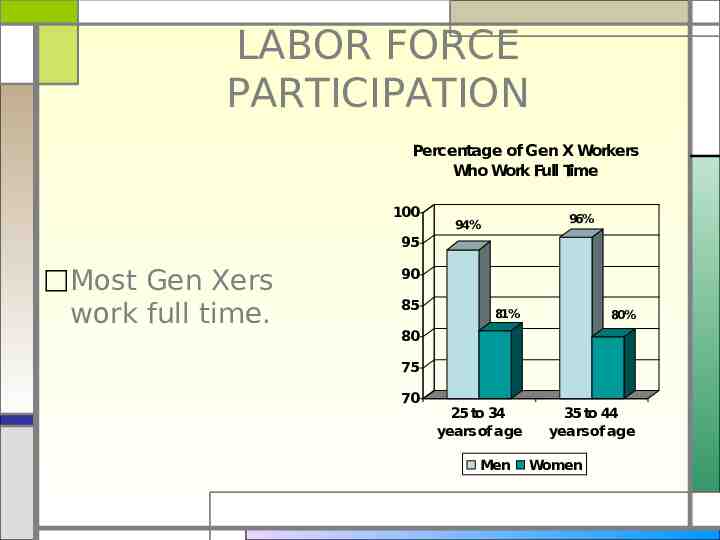
LABOR FORCE PARTICIPATION Percentage of Gen X Workers Who Work Full Time 100 96% 94% 95 Most Gen Xers work full time. 90 85 81% 80% 25 to 34 years of age 35 to 44 years of age 80 75 70 Men Women
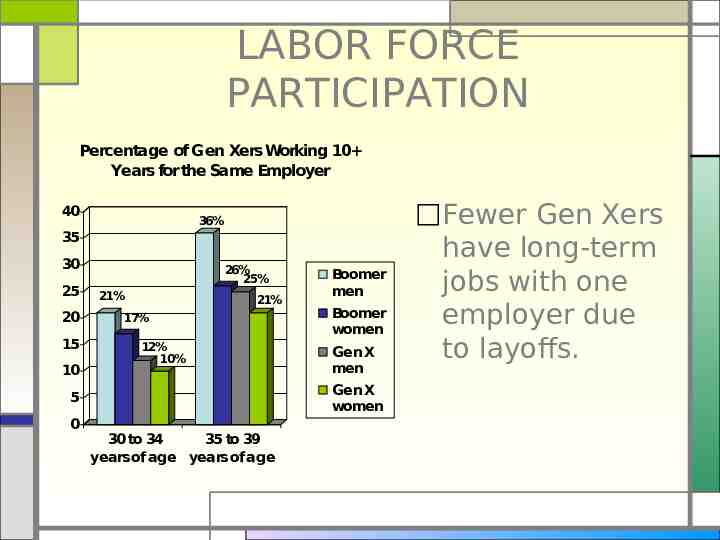
LABOR FORCE PARTICIPATION Percentage of Gen Xers Working 10 Years for the Same Employer 40 36% 35 30 25 20 15 10 26% 25% 21% 21% 17% 12% 10% Boomer women Gen X men Gen X women 5 0 Boomer men 30 to 34 35 to 39 years of age years of age Fewer Gen Xers have long-term jobs with one employer due to layoffs.
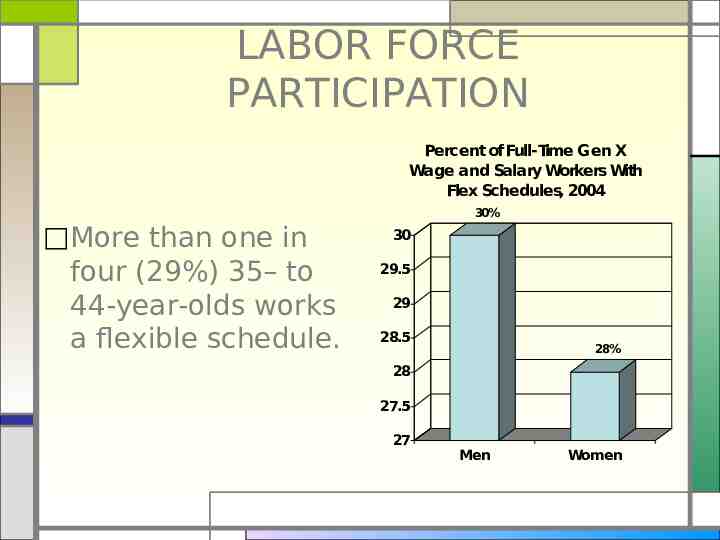
LABOR FORCE PARTICIPATION Percent of Full-Time Gen X Wage and Salary Workers With Flex Schedules, 2004 More than one in four (29%) 35– to 44-year-olds works a flexible schedule. 30% 30 29.5 29 28.5 28% 28 27.5 27 Men Women
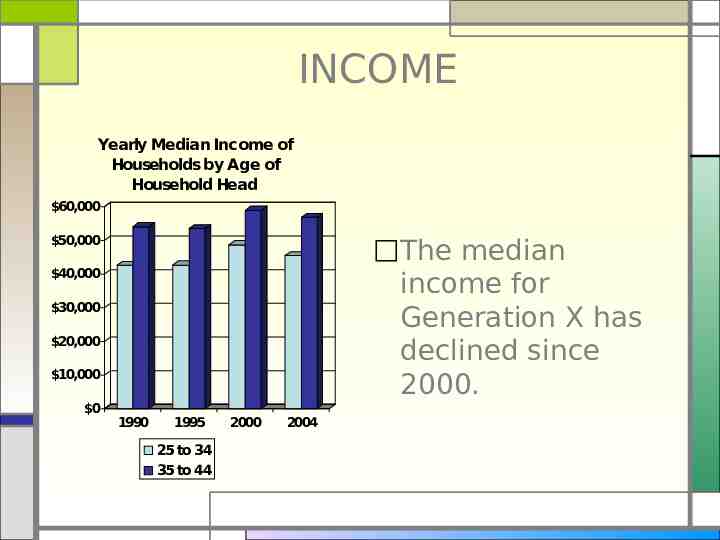
INCOME Yearly Median Income of Households by Age of Household Head 60,000 The median income for Generation X has declined since 2000. 50,000 40,000 30,000 20,000 10,000 0 1990 1995 25 to 34 35 to 44 2000 2004
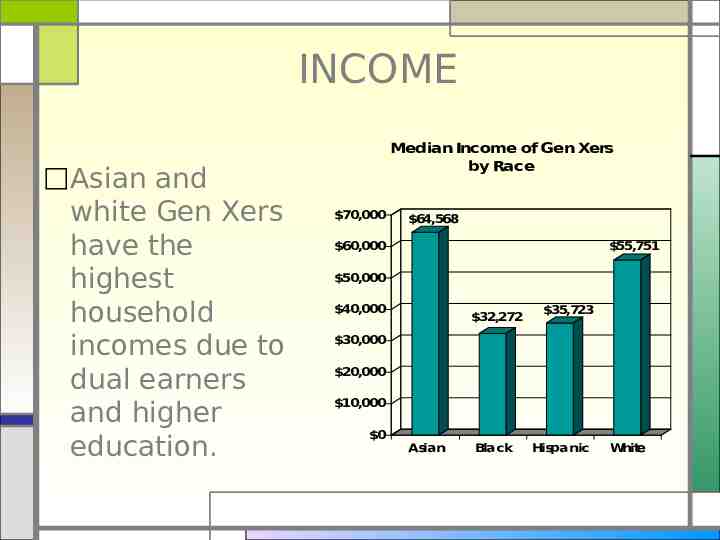
INCOME Asian and white Gen Xers have the highest household incomes due to dual earners and higher education. Median Income of Gen Xers by Race 70,000 64,568 60,000 55,751 50,000 40,000 32,272 35,723 30,000 20,000 10,000 0 Asian Black Hispanic White
HOME OWNERSHIP 56.8% of Gen Xers between the ages of 30 and 34 own their own home. 66.6% of Gen Xers between the ages of 35 and 39 own their own home.
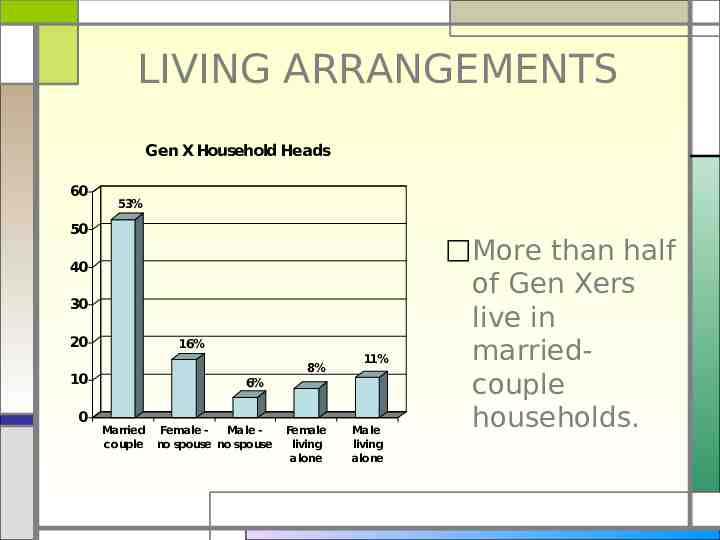
LIVING ARRANGEMENTS Gen X Household Heads 60 53% 50 40 30 20 16% 8% 10 0 11% 6% Married couple Female Male no spouse no spouse Female living alone Male living alone More than half of Gen Xers live in marriedcouple households.
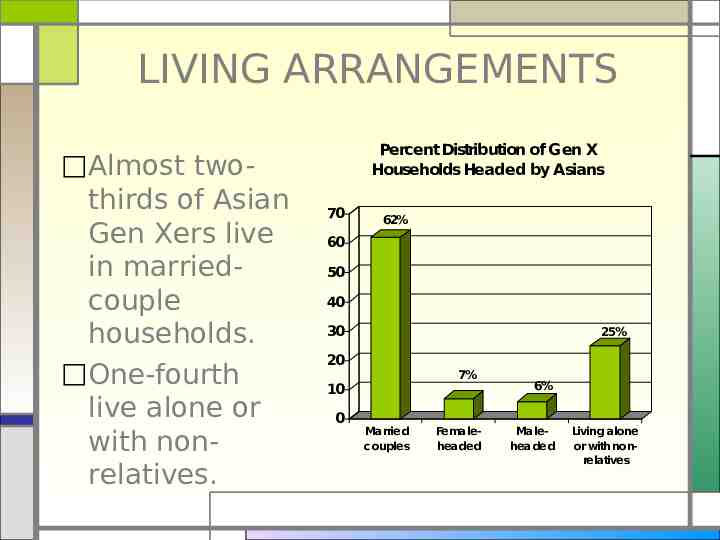
LIVING ARRANGEMENTS Almost twothirds of Asian Gen Xers live in marriedcouple households. One-fourth live alone or with nonrelatives. Percent Distribution of Gen X Households Headed by Asians 70 62% 60 50 40 30 25% 20 7% 10 0 Married couples Femaleheaded 6% Maleheaded Living alone or with nonrelatives
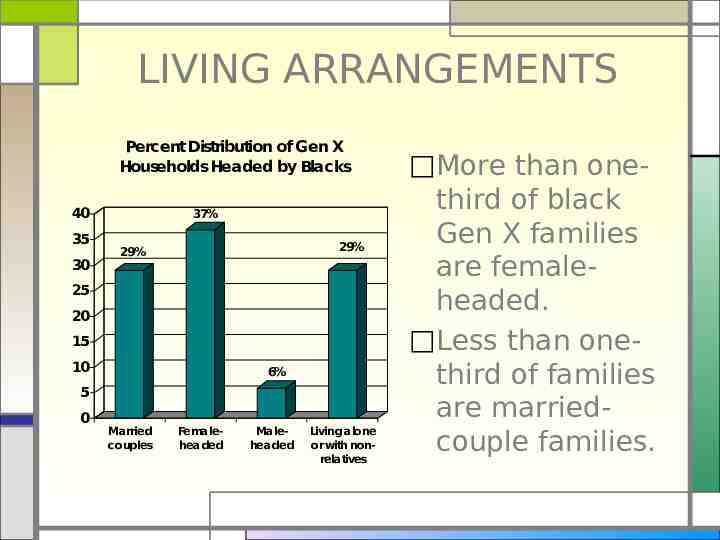
LIVING ARRANGEMENTS Percent Distribution of Gen X Households Headed by Blacks 40 35 30 37% 29% 29% 25 20 15 10 6% 5 0 Married couples Femaleheaded Maleheaded Living alone or with nonrelatives More than onethird of black Gen X families are femaleheaded. Less than onethird of families are marriedcouple families.
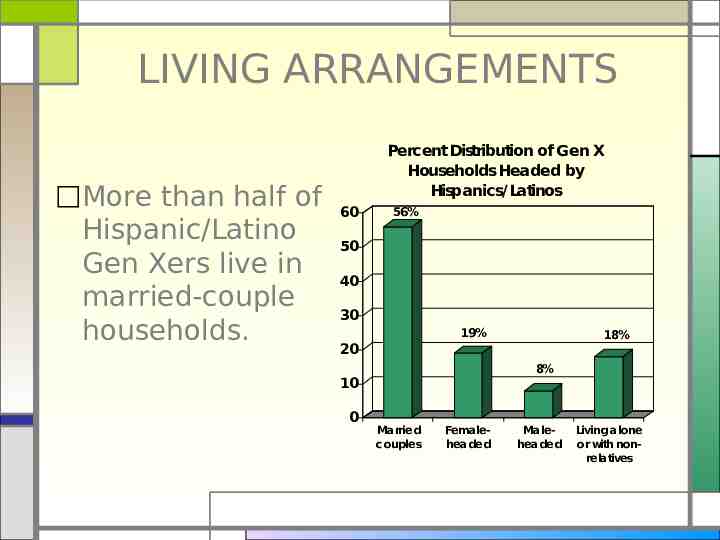
LIVING ARRANGEMENTS More than half of Hispanic/Latino Gen Xers live in married-couple households. Percent Distribution of Gen X Households Headed by Hispanics/ Latinos 60 56% 50 40 30 19% 18% 20 8% 10 0 Married couples Femaleheaded Maleheaded Living alone or with nonrelatives
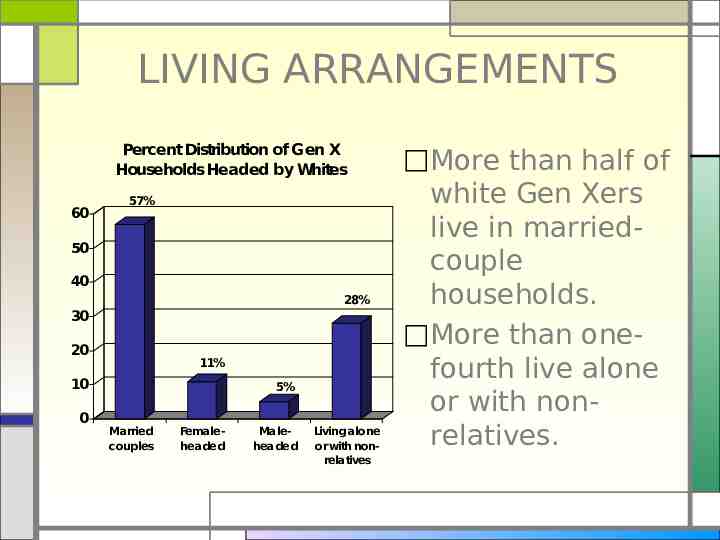
LIVING ARRANGEMENTS Percent Distribution of Gen X Households Headed by Whites 60 57% 50 40 28% 30 20 11% 10 0 5% Married couples Femaleheaded Maleheaded Living alone or with nonrelatives More than half of white Gen Xers live in marriedcouple households. More than onefourth live alone or with nonrelatives.
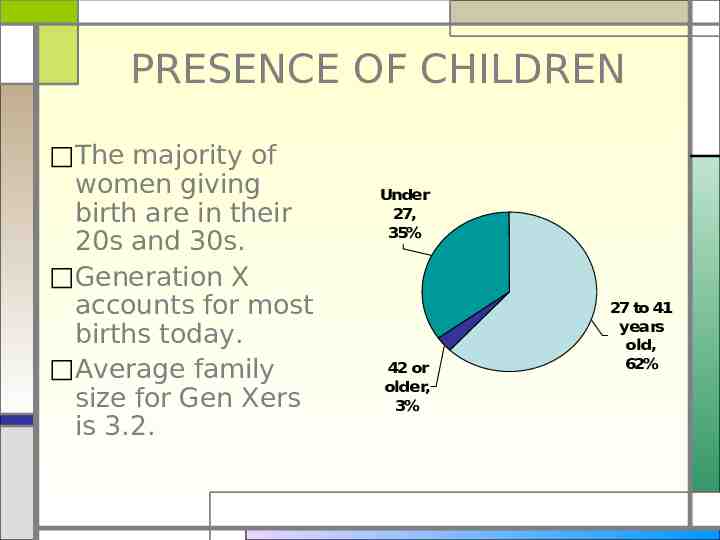
PRESENCE OF CHILDREN The majority of women giving birth are in their 20s and 30s. Generation X accounts for most births today. Average family size for Gen Xers is 3.2. Under 27, 35% 42 or older, 3% 27 to 41 years old, 62%
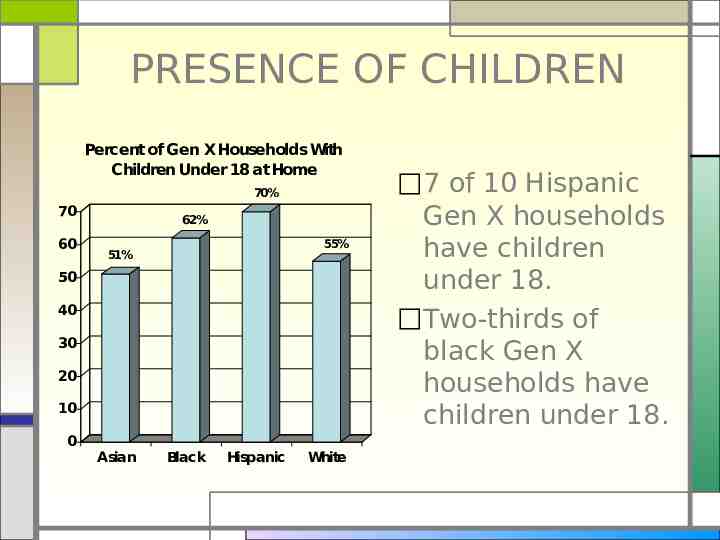
PRESENCE OF CHILDREN Percent of Gen X Households With Children Under 18 at Home 70% 70 60 62% 55% 51% 50 40 30 20 10 0 Asian Black Hispanic White 7 of 10 Hispanic Gen X households have children under 18. Two-thirds of black Gen X households have children under 18.
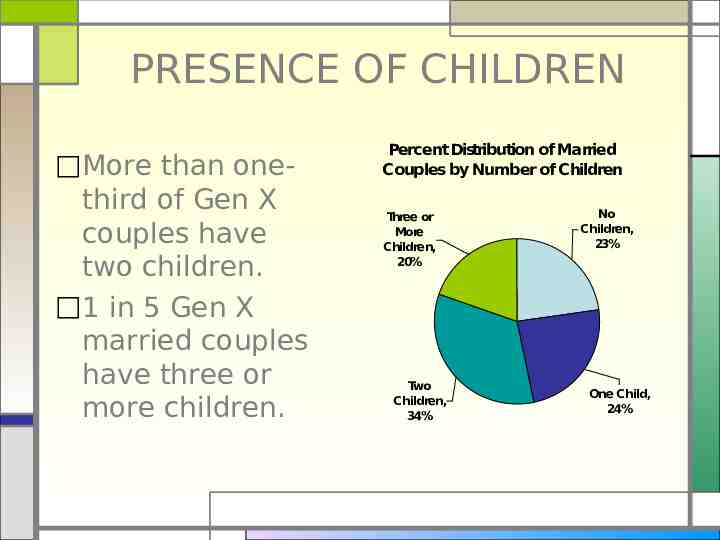
PRESENCE OF CHILDREN More than onethird of Gen X couples have two children. 1 in 5 Gen X married couples have three or more children. Percent Distribution of Married Couples by Number of Children Three or More Children, 20% Two Children, 34% No Children, 23% One Child, 24%
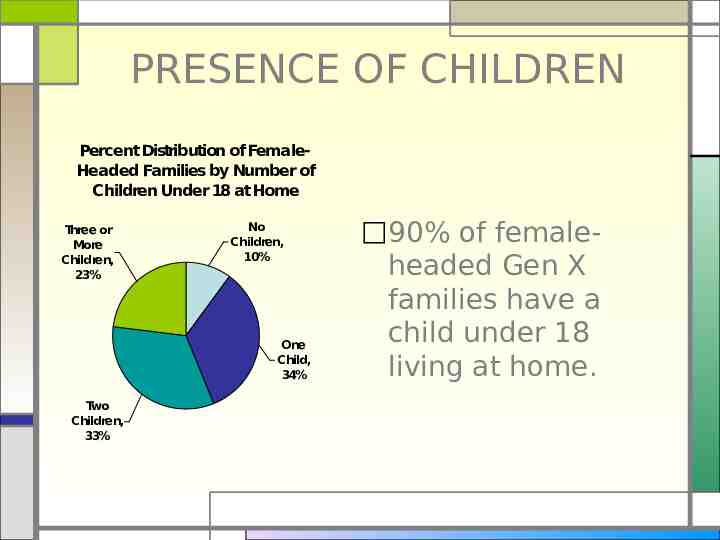
PRESENCE OF CHILDREN Percent Distribution of FemaleHeaded Families by Number of Children Under 18 at Home Three or More Children, 23% No Children, 10% One Child, 34% Two Children, 33% 90% of femaleheaded Gen X families have a child under 18 living at home.
VOLUNTEERING 34.5% of Gen Xers volunteered their time in 2005: 28.8% of men volunteered 39.9% of women volunteered Types of organizations Gen Xers volunteered for include: Education or youth service Religious Social or community service
VOLUNTEERING Types of volunteer work most commonly performed by Gen Xers: Fund-raising or selling something to raise money Collecting, preparing, or serving food Tutoring or teaching Transportation/general labor Mentoring youth
SELLING TO GEN X PARENTS Life has not been stable. Gen Xers were the children of divorce and dual incomes, and were latchkey kids who grew up by themselves. Selling point: Convince them that your organization is reliable and will simplify rather than complicate their lives. Just below the Baby Boom CCc: Generation X; Modern Donor, 2005
SELLING TO GEN X PARENTS More family time, less contentment. Instead of trying to fit family time around work, they are more likely to try to fit work around family time. They would generally like to spend more time with their kids. Selling point: “Quantity time” with their kids as well as “quality time.” 2003 Generation X study by Reach Advisors – Marketing Strategy Group
SELLING TO GEN X PARENTS The “soccer mom” is history. Moms have a high level of education, marry later, and have children later. They are very diverse in their wants and needs. Many are stay-at-home moms. Selling point: Show the variety of moms in your advertising. If you are only onedimensional, you are dead. 2003 Generation X study by Reach Advisors – Marketing Strategy Group
SELLING TO GEN X PARENTS Dads do more at home. Dads work to be involved in the daily lives of their children and are more likely to play a significant role in their activities. Selling point: Show dads how these kid’s activities can help them be more involved. 2003 Generation X study by Reach Advisors – Marketing Strategy Group
SELLING TO GEN X PARENTS What’s in it for me? Because of the way this generation has been raised and its job patterns, Gen Xers look for what is in it for them. They want to see a direct return on their investment of time and money. Selling point: ROI in terms of time and money March 2006, An Opportunity and a Challenge, Successful Meetings