Chapter 12: Physics of Ultrasound Slide set of 54 slides based on the


54 Slides1.00 MB
Chapter 12: Physics of Ultrasound Slide set of 54 slides based on the Chapter authored by J.C. Lacefield of the IAEA publication (ISBN 978-92-0-131010-1): Diagnostic Radiology Physics: A Handbook for Teachers and Students Objective: To familiarize students with Physics or Ultrasound, commonly used in diagnostic imaging modality Slide set prepared by E.Okuno (S. Paulo, Brazil, Institute of Physics of S. Paulo University) IAEA International Atomic Energy Agency
Chapter 12. TABLE OF CONTENTS 12.1. Introduction 12.2. Ultrasonic Plane Waves 12.3. Ultrasonic Properties of Biological Tissue 12.4. Ultrasonic Transduction 12.5. Doppler Physics 12.6. Biological Effects of Ultrasound IAEA Diagnostic Radiolog2y Physics: a Handbook for Teachers and Students – chapter 12,2
12.1. INTRODUCTION Ultrasound is the most commonly used diagnostic imaging modality, accounting for approximately 25% of all imaging examinations performed worldwide nowadays Ultrasound is an acoustic wave with frequencies greater than the maximum frequency audible to humans, which is 20 kHz IAEA Diagnostic Radiology Physics: a Handbook for Teachers and Students – chapter 12,3
12.1. INTRODUCTION Diagnostic imaging is generally performed using ultrasound in the frequency range from 2 to 15 MHz The choice of frequency is dictated by a trade-off between spatial resolution and penetration depth, since higher frequency waves can be focused more tightly but are attenuated more rapidly by tissue The information in an ultrasonic image is influenced by the physical processes underlying propagation, reflection and attenuation of ultrasound waves in tissue IAEA Diagnostic Radiology Physics: a Handbook for Teachers and Students – chapter 12,4
12.1. INTRODUCTION Attractive characteristics: relatively low cost portability of an ultrasound scanner the non-ionizing nature of ultrasound waves the ability to produce real-time images of blood flow and moving structures such as the beating heart the intrinsic contrast among soft tissue structures that is achieved without the need for an injected contrast agent IAEA Diagnostic Radiology Physics: a Handbook for Teachers and Students – chapter 12,5
12.1. INTRODUCTION Ultrasound has a wide range of medical applications: cardiac and vascular imaging imaging of the abdominal organs in utero imaging of the developing fetus Ongoing technological improvements continue to expand the use of ultrasound for many applications: cancer imaging musculoskeletal imaging ophthalmology others IAEA Diagnostic Radiology Physics: a Handbook for Teachers and Students – chapter 12,6
12.2. ULTRASONIC PLANE WAVES An acoustic wave is a traveling pressure disturbance that produces alternating compressions rarefactions (expansions) of the propagation medium The compressions and rarefactions displace incremental volumes of the medium and the wave propagates via transfer of momentum among incremental volumes Each incremental volume of the medium undergoes small oscillations about its original position but does not travel with the pressure disturbance IAEA Diagnostic Radiology Physics: a Handbook for Teachers and Students – chapter 12,7
2.2. ULTRASONIC PLANE WAVES 12.2.1. One-Dimensional Ultrasonic Waves A pressure plane wave, p (x,t), propagating along one spatial dimension, x, through a homogeneous, nonattenuating fluid medium can be formulated starting from Euler’s equation and the equation of continuity : 1 p x, t u x, t 0 t x p x, t o u x, t 0 x t ro is the undisturbed mass density of the medium k is the compressibility of the medium (i.e., the fractional change in volume per unit pressure in units of Pa 1) u(x,t) is the particle velocity produced by the wave IAEA Diagnostic Radiology Physics: a Handbook for Teachers and Students – chapter 12,8
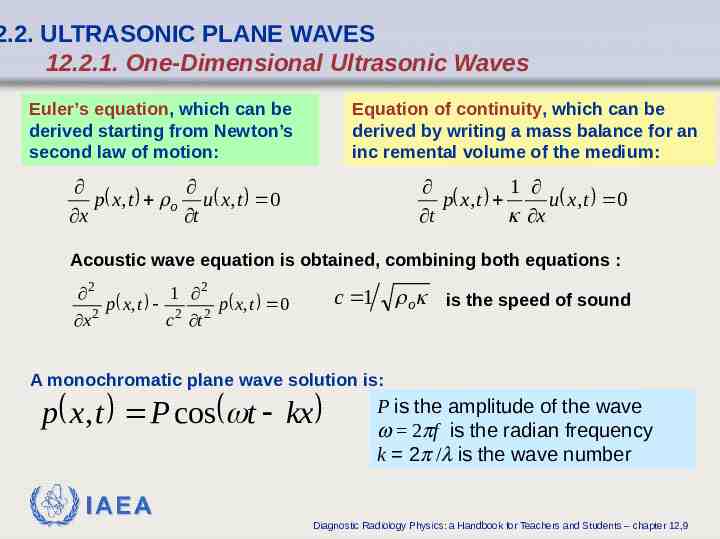
2.2. ULTRASONIC PLANE WAVES 12.2.1. One-Dimensional Ultrasonic Waves Euler’s equation, which can be derived starting from Newton’s second law of motion: Equation of continuity, which can be derived by writing a mass balance for an inc remental volume of the medium: 1 p x, t u x, t 0 t x p x , t o u x , t 0 x t Acoustic wave equation is obtained, combining both equations : 2 1 2 p x, t 2 2 p x, t 0 2 x c t c 1 o is the speed of sound A monochromatic plane wave solution is: p x, t P cos t kx P is the amplitude of the wave w 2pf is the radian frequency k 2p /l is the wave number IAEA Diagnostic Radiology Physics: a Handbook for Teachers and Students – chapter 12,9
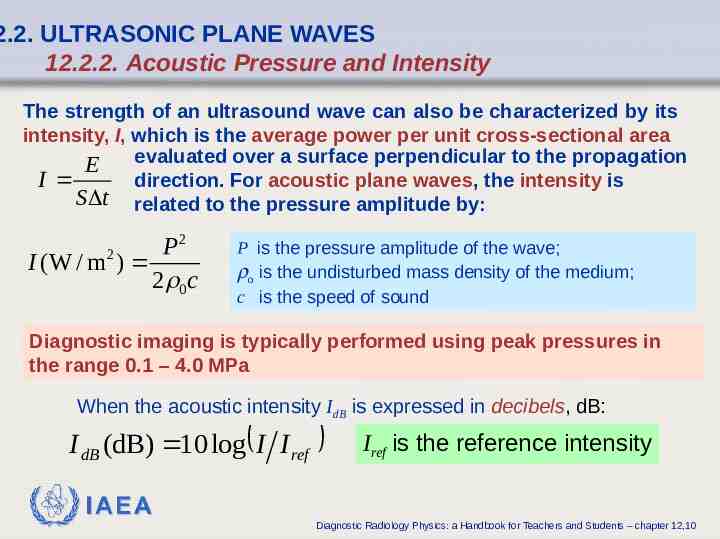
2.2. ULTRASONIC PLANE WAVES 12.2.2. Acoustic Pressure and Intensity The strength of an ultrasound wave can also be characterized by its intensity, I, which is the average power per unit cross-sectional area evaluated over a surface perpendicular to the propagation E I direction. For acoustic plane waves, the intensity is S t related to the pressure amplitude by: 2 P I (W / m2 ) 2 0c P is the pressure amplitude of the wave; ro is the undisturbed mass density of the medium; c is the speed of sound Diagnostic imaging is typically performed using peak pressures in the range 0.1 – 4.0 MPa When the acoustic intensity IdB is expressed in decibels, dB: I dB (dB) 10 log I I ref Iref is the reference intensity IAEA Diagnostic Radiology Physics: a Handbook for Teachers and Students – chapter 12,10
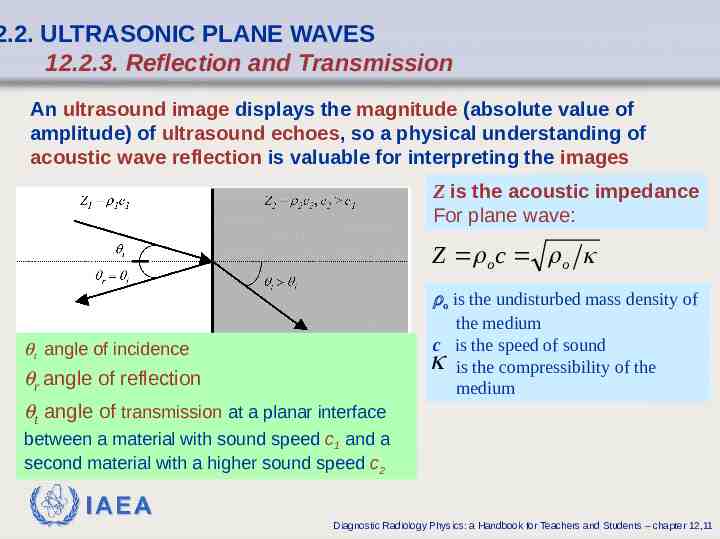
2.2. ULTRASONIC PLANE WAVES 12.2.3. Reflection and Transmission An ultrasound image displays the magnitude (absolute value of amplitude) of ultrasound echoes, so a physical understanding of acoustic wave reflection is valuable for interpreting the images Z is the acoustic impedance For plane wave: Z o c o ro is the undisturbed mass density of the medium c is the speed of sound is the compressibility of the medium qi angle of incidence qr angle of reflection qt angle of transmission at a planar interface between a material with sound speed c1 and a second material with a higher sound speed c2 IAEA Diagnostic Radiology Physics: a Handbook for Teachers and Students – chapter 12,11
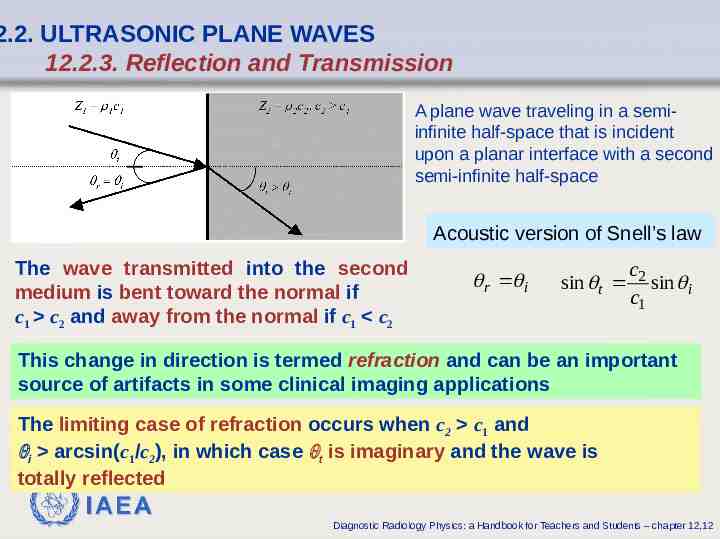
2.2. ULTRASONIC PLANE WAVES 12.2.3. Reflection and Transmission A plane wave traveling in a semiinfinite half-space that is incident upon a planar interface with a second semi-infinite half-space Acoustic version of Snell’s law The wave transmitted into the second medium is bent toward the normal if c1 c2 and away from the normal if c1 c2 r i sin t c2 sin i c1 This change in direction is termed refraction and can be an important source of artifacts in some clinical imaging applications The limiting case of refraction occurs when c2 c1 and qi arcsin(c1/c2), in which case qt is imaginary and the wave is totally reflected IAEA Diagnostic Radiology Physics: a Handbook for Teachers and Students – chapter 12,12
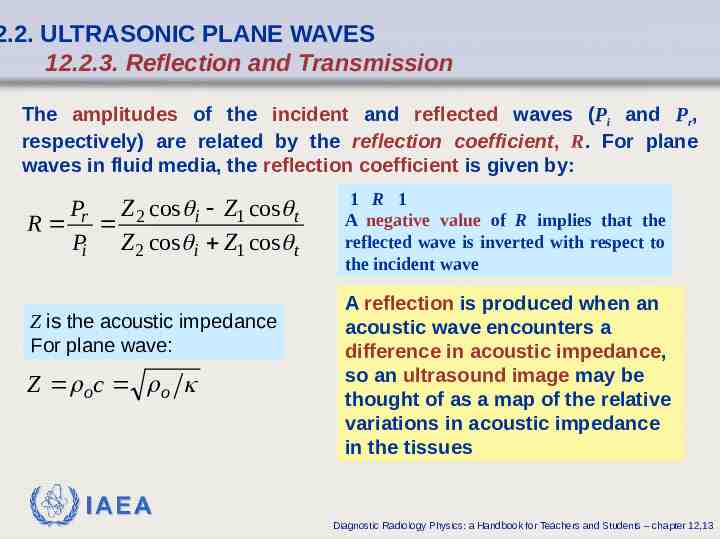
2.2. ULTRASONIC PLANE WAVES 12.2.3. Reflection and Transmission The amplitudes of the incident and reflected waves (Pi and Pr, respectively) are related by the reflection coefficient, R. For plane waves in fluid media, the reflection coefficient is given by: P Z cos i Z1 cos t R r 2 Pi Z 2 cos i Z1 cos t Z is the acoustic impedance For plane wave: Z oc o 1 R 1 A negative value of R implies that the reflected wave is inverted with respect to the incident wave A reflection is produced when an acoustic wave encounters a difference in acoustic impedance, so an ultrasound image may be thought of as a map of the relative variations in acoustic impedance in the tissues IAEA Diagnostic Radiology Physics: a Handbook for Teachers and Students – chapter 12,13
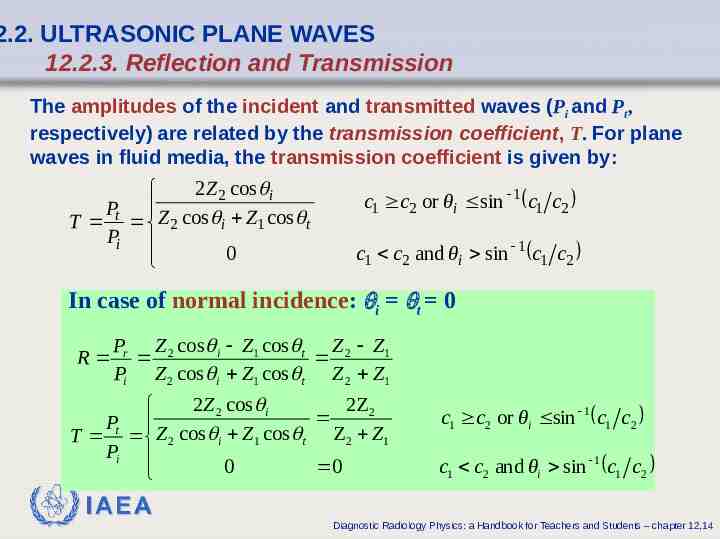
2.2. ULTRASONIC PLANE WAVES 12.2.3. Reflection and Transmission The amplitudes of the incident and transmitted waves (Pi and Pt, respectively) are related by the transmission coefficient, T. For plane waves in fluid media, the transmission coefficient is given by: 2Z 2 cos i P T t Z 2 cos i Z1 cos t Pi 0 c1 c2 or θi sin 1 c1 c2 c1 c2 and θi sin 1 c1 c2 In case of normal incidence: qi qt 0 Pr Z 2 cos i Z1 cos t Z 2 Z1 R Pi Z 2 cos i Z1 cos t Z 2 Z1 2Z 2 cos i 2Z 2 Pt Z cos Z cos Z 2 Z1 T 2 i 1 t Pi 0 0 c1 c2 or θi sin 1 c1 c2 c1 c2 and θi sin 1 c1 c2 IAEA Diagnostic Radiology Physics: a Handbook for Teachers and Students – chapter 12,14
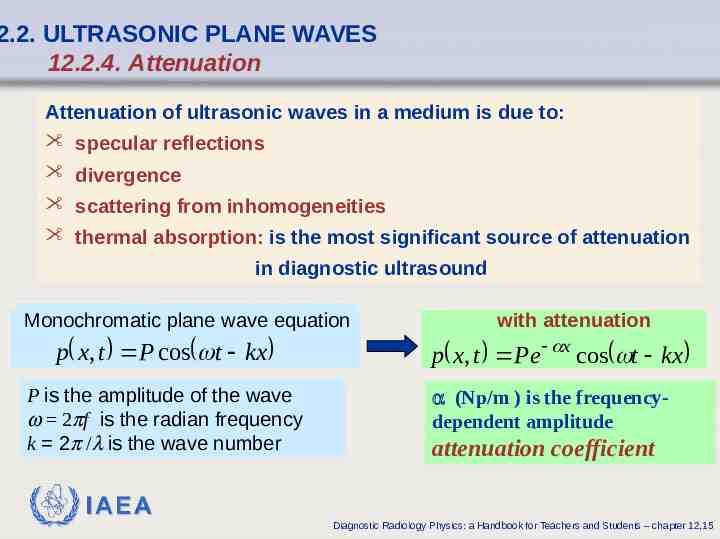
2.2. ULTRASONIC PLANE WAVES 12.2.4. Attenuation Attenuation of ultrasonic waves in a medium is due to: specular reflections divergence scattering from inhomogeneities thermal absorption: is the most significant source of attenuation in diagnostic ultrasound Monochromatic plane wave equation p x, t P cos t kx P is the amplitude of the wave w 2pf is the radian frequency k 2p /l is the wave number with attenuation p x, t Pe x cos t kx a (Np/m ) is the frequencydependent amplitude attenuation coefficient IAEA Diagnostic Radiology Physics: a Handbook for Teachers and Students – chapter 12,15
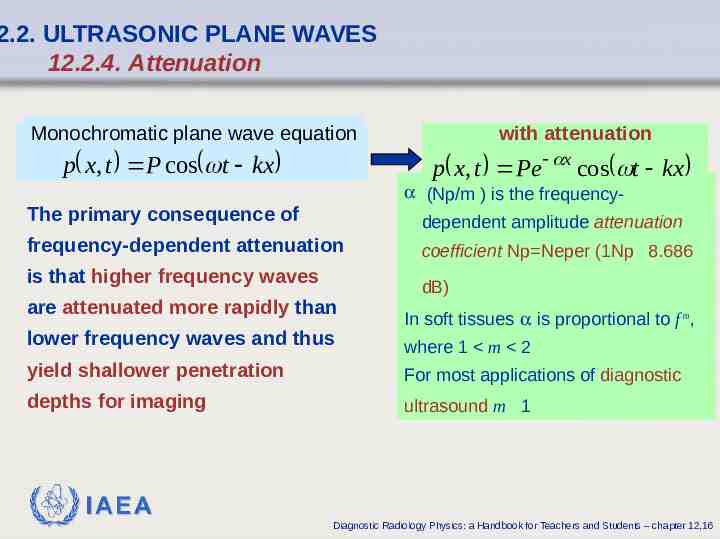
2.2. ULTRASONIC PLANE WAVES 12.2.4. Attenuation Monochromatic plane wave equation with attenuation p x, t Pe x cos t kx p x, t P cos t kx a (Np/m ) is the frequency- The primary consequence of dependent amplitude attenuation frequency-dependent attenuation is that higher frequency waves are attenuated more rapidly than lower frequency waves and thus coefficient Np Neper (1Np 8.686 dB) In soft tissues a is proportional to f m, where 1 m 2 yield shallower penetration For most applications of diagnostic depths for imaging ultrasound m 1 IAEA Diagnostic Radiology Physics: a Handbook for Teachers and Students – chapter 12,16
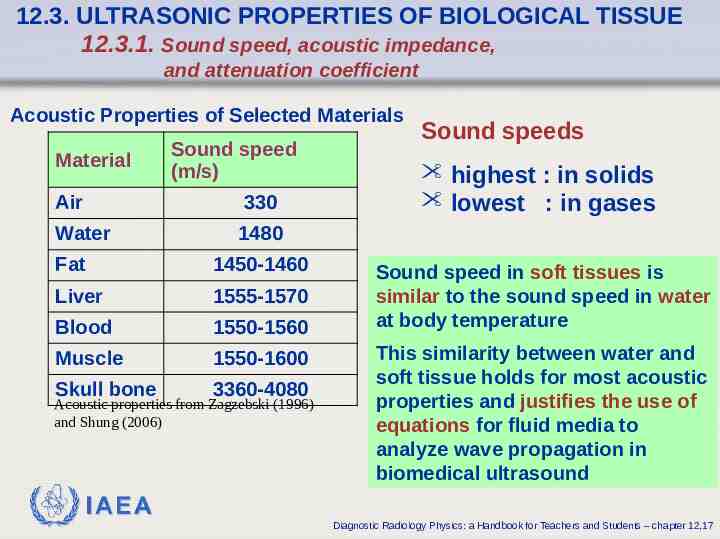
12.3. ULTRASONIC PROPERTIES OF BIOLOGICAL TISSUE 12.3.1. Sound speed, acoustic impedance, and attenuation coefficient Acoustic Properties of Selected Materials Material Sound speed (m/s) Air 330 Water 1480 Fat 1450-1460 Liver 1555-1570 Blood 1550-1560 Muscle 1550-1600 Skull bone 3360-4080 Acoustic properties from Zagzebski (1996) and Shung (2006) Sound speeds highest : in solids lowest : in gases Sound speed in soft tissues is similar to the sound speed in water at body temperature This similarity between water and soft tissue holds for most acoustic properties and justifies the use of equations for fluid media to analyze wave propagation in biomedical ultrasound IAEA Diagnostic Radiology Physics: a Handbook for Teachers and Students – chapter 12,17
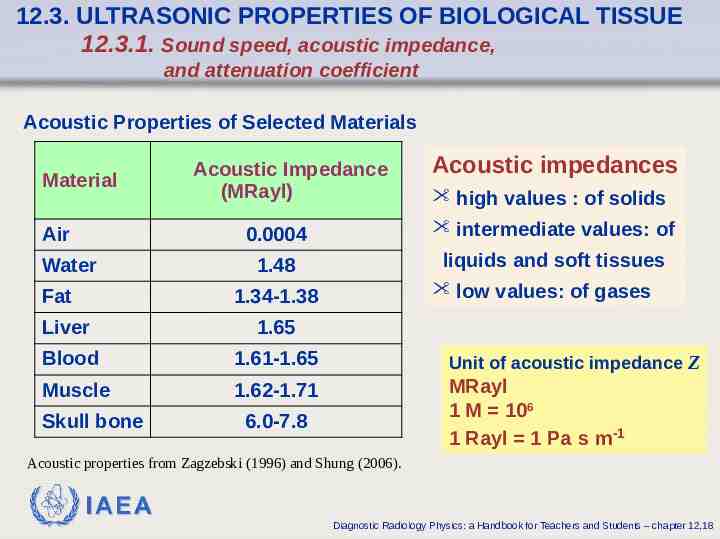
12.3. ULTRASONIC PROPERTIES OF BIOLOGICAL TISSUE 12.3.1. Sound speed, acoustic impedance, and attenuation coefficient Acoustic Properties of Selected Materials Material Air Water Fat Acoustic Impedance (MRayl) Acoustic impedances high values : of solids 0.0004 intermediate values: of 1.48 liquids and soft tissues low values: of gases 1.34-1.38 Liver 1.65 Blood 1.61-1.65 Unit of acoustic impedance Z Muscle 1.62-1.71 MRayl 1 M 106 1 Rayl 1 Pa s m-1 Skull bone 6.0-7.8 Acoustic properties from Zagzebski (1996) and Shung (2006). IAEA Diagnostic Radiology Physics: a Handbook for Teachers and Students – chapter 12,18
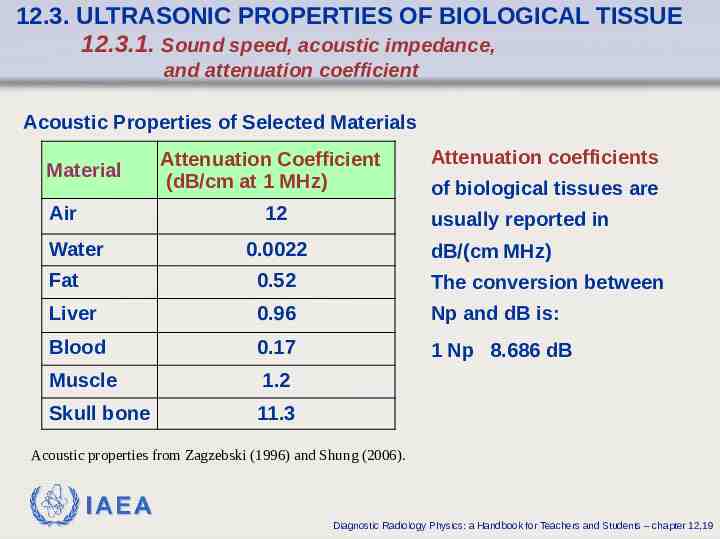
12.3. ULTRASONIC PROPERTIES OF BIOLOGICAL TISSUE 12.3.1. Sound speed, acoustic impedance, and attenuation coefficient Acoustic Properties of Selected Materials Material Air Attenuation Coefficient (dB/cm at 1 MHz) 12 Water Attenuation coefficients of biological tissues are usually reported in 0.0022 dB/(cm MHz) Fat 0.52 The conversion between Liver 0.96 Np and dB is: Blood 0.17 1 Np 8.686 dB Muscle 1.2 Skull bone 11.3 Acoustic properties from Zagzebski (1996) and Shung (2006). IAEA Diagnostic Radiology Physics: a Handbook for Teachers and Students – chapter 12,19
12.3. ULTRASONIC PROPERTIES OF BIOLOGICAL TISSUE 12.3.2. Scattering Similar to the mechanism of specular (mirror-like) reflection, scattering occurs when an ultrasonic wave encounters a variation in the acoustic impedance of the medium Scattering occurs when the wave encounters features with dimensions similar to or smaller than the wavelength Scattered echoes are omnidirectional and are significantly weaker than specular reflections Constructive and destructive interference of echoes scattered backward from cellular-scale tissue features to the transducer are the source of the speckle texture that dominates the internal appearance of organs in ultrasound images IAEA Diagnostic Radiology Physics: a Handbook for Teachers and Students – chapter 12,20
12.3. ULTRASONIC PROPERTIES OF BIOLOGICAL TISSUE 12.3.3. Nonlinear Propagation Nonlinearity arises in acoustic propagation because the pressure wave alters the density of the medium and the sound speed depends on density according to c 1 This effect is negligible at low acoustic intensities However, near the focus of beams used for diagnostic imaging the density variations produced by the wave become significant such that the compressive phase of the wave propagates at a higher velocity than the rarefactional phase of the wave IAEA Diagnostic Radiology Physics: a Handbook for Teachers and Students – chapter 12,21
12.3. ULTRASONIC PROPERTIES OF BIOLOGICAL TISSUE 12.3.3. Nonlinear Propagation The nonlinearity will distort an initially sinusoidal wave into a sawtooth pattern as the compressive segments of the wave catch up to the rarefactional segments ahead of them A transformation from a sinusoidal to a sawtooth wave introduces harmonics into the wave’s frequency spectrum. This phenomenon is the physical basis of the tissue harmonic imaging mode IAEA Diagnostic Radiology Physics: a Handbook for Teachers and Students – chapter 12,22
12.4. ULTRASONIC TRANSDUCTION 12.4.1. Piezoelectric Devices Ultrasonic (piezoelectric) transducers are devices that convert electrical energy into ultrasound and vice-versa They were made possible by the discovery of piezoelectricity in quartz by Pierre and Jacques Curie in 1880 Piezoelectricity is a reversible property of certain crystalline materials by which: a vibration applied to opposite faces of the crystal produces an alternating net electrical charge across the crystal whereas an alternating voltage applied across the crystal causes it to vibrate in thickness IAEA Diagnostic Radiology Physics: a Handbook for Teachers and Students – chapter 12,23
12.4. ULTRASONIC TRANSDUCTION 12.4.1. Piezoelectric Devices The microscopic mechanism of piezoelectricity can be understood by envisioning the material as a collection of randomly oriented electric dipoles An applied force deforms the crystal, resulting in a rearrangement of the dipoles that induces a net charge across the crystal Conversely, a voltage difference applied across the crystal will change the arrangement of the dipoles, thereby producing a bulk deformation of the crystal IAEA Diagnostic Radiology Physics: a Handbook for Teachers and Students – chapter 12,24
12.4. ULTRASONIC TRANSDUCTION 12.4.1. Piezoelectric Devices Transducers used for diagnostic imaging have conventionally been fabricated using the ferroelectric ceramic lead zirconate titanante, which is commonly referred to by the acronym PZT from the first letters of lead (Pb), zirconium (Zr), and titanium (Ti) PZT provides a relatively high electrical-to-mechanical coupling efficiency at low cost Many modern transducers are composites of PZT and a nonpiezoelectric polymer. The composite materials have a lower acoustic impedance than conventional PZT, which improves acoustic coupling into the tissue and increases the transducer’s bandwidth IAEA Diagnostic Radiology Physics: a Handbook for Teachers and Students – chapter 12,25
12.4. ULTRASONIC TRANSDUCTION 12.4.1. Piezoelectric Devices The bandwidth and sensitivity of the transducer are improved by sandwiching the piezoelectric crystal between a backing layer and a matching layer: backing layer is to absorb ultrasound radiated from the back face of the crystal and dampen reverberations within the crystal matching layer, which is bonded to the front face of the crystal, serves to reduce the reflection coefficient between the transducer and the tissue, thereby increasing the transducer’s sensitivity to weak echoes IAEA Diagnostic Radiology Physics: a Handbook for Teachers and Students – chapter 12,26
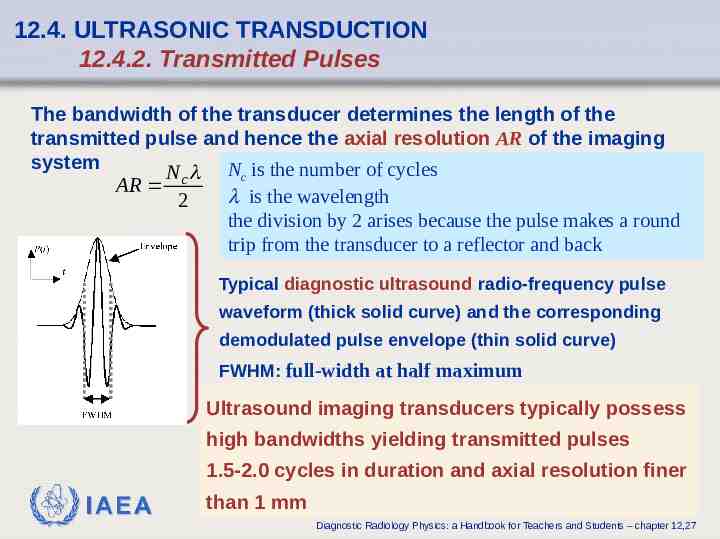
12.4. ULTRASONIC TRANSDUCTION 12.4.2. Transmitted Pulses The bandwidth of the transducer determines the length of the transmitted pulse and hence the axial resolution AR of the imaging system N Nc is the number of cycles AR c l is the wavelength 2 the division by 2 arises because the pulse makes a round trip from the transducer to a reflector and back Typical diagnostic ultrasound radio-frequency pulse waveform (thick solid curve) and the corresponding demodulated pulse envelope (thin solid curve) FWHM: full-width at half maximum Ultrasound imaging transducers typically possess high bandwidths yielding transmitted pulses 1.5-2.0 cycles in duration and axial resolution finer IAEA than 1 mm Diagnostic Radiology Physics: a Handbook for Teachers and Students – chapter 12,27
12.4. ULTRASONIC TRANSDUCTION 12.4.3. Radiation and Diffraction The beam pattern produced by an ultrasound transducer can be analyzed in a plane parallel to the face of the aperture using scalar diffraction theory based on Huygens-Fresnel principle: an aperture can be decomposed into a collection of point sources such that the field produced by the aperture is a superposition of spherical wavelets radiated from each point source IAEA Diagnostic Radiology Physics: a Handbook for Teachers and Students – chapter 12,28
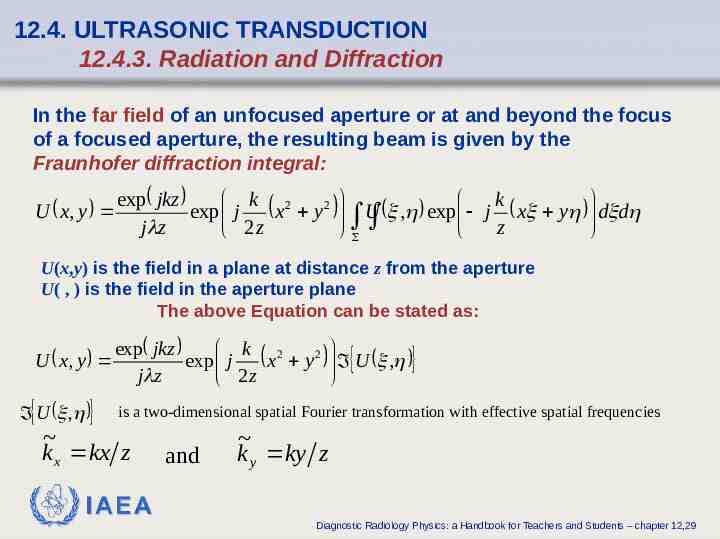
2 12.4. ULTRASONIC TRANSDUCTION 12.4.3. Radiation and Diffraction In the far field of an unfocused aperture or at and beyond the focus of a focused aperture, the resulting beam is given by the Fraunhofer diffraction integral: U x, y exp jkz k k 2 exp j x y 2 U , exp j x y d d j z z 2z U(x,y) is the field in a plane at distance z from the aperture U( , ) is the field in the aperture plane The above Equation can be stated as: U x, y U , exp jkz k 2 exp j x y2 j z 2z U , is a two-dimensional spatial Fourier transformation with effective spatial frequencies k x kx z and k y ky z IAEA Diagnostic Radiology Physics: a Handbook for Teachers and Students – chapter 12,29
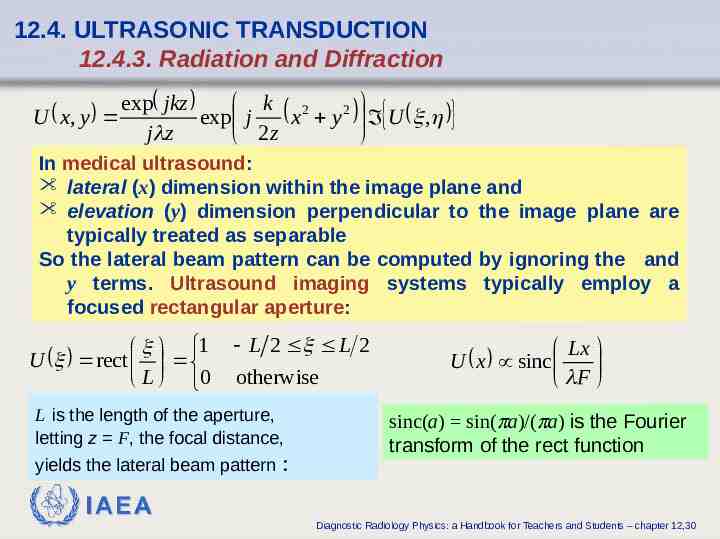
12.4. ULTRASONIC TRANSDUCTION 12.4.3. Radiation and Diffraction U x, y exp jkz k 2 exp j x y2 j z 2z U , In medical ultrasound: lateral (x) dimension within the image plane and elevation (y) dimension perpendicular to the image plane are typically treated as separable So the lateral beam pattern can be computed by ignoring the and y terms. Ultrasound imaging systems typically employ a focused rectangular aperture: 1 U rect L 0 L 2 L 2 otherwise L is the length of the aperture, letting z F, the focal distance, yields the lateral beam pattern : Lx U x sinc F sinc(a) sin(pa)/(pa) is the Fourier transform of the rect function IAEA Diagnostic Radiology Physics: a Handbook for Teachers and Students – chapter 12,30
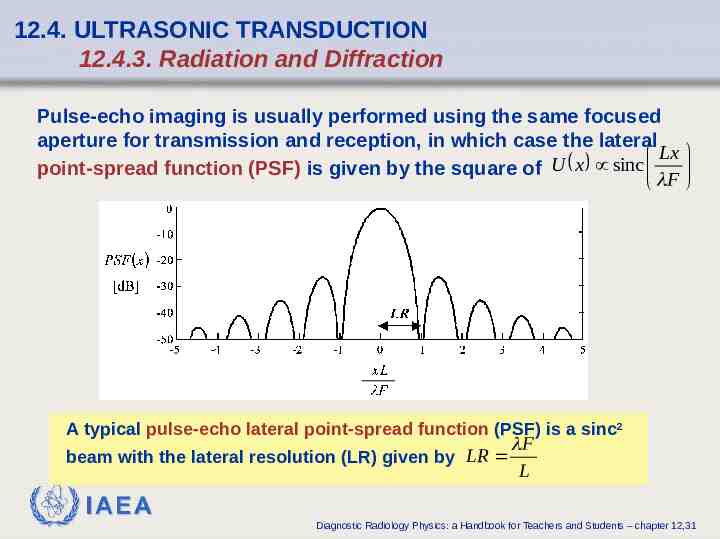
12.4. ULTRASONIC TRANSDUCTION 12.4.3. Radiation and Diffraction Pulse-echo imaging is usually performed using the same focused aperture for transmission and reception, in which case the lateral Lx U x sinc point-spread function (PSF) is given by the square of F A typical pulse-echo lateral point-spread function (PSF) is a sinc2 beam with the lateral resolution (LR) given by LR F L IAEA Diagnostic Radiology Physics: a Handbook for Teachers and Students – chapter 12,31
12.4. ULTRASONIC TRANSDUCTION 12.4.3. Radiation and Diffraction The Rayleigh resolution criterion defines the resolution as the distance from the peak of the beam to the first zero of the beam F The lateral resolution, LR L sinc function 0 in is obtained, setting the Lx U x sinc F F/L is called the f-number of the transducer. The f-number of an ultrasound imaging system is typically between 2 and at most 6, so the lateral resolution is generally in the 1-2 mm range IAEA Diagnostic Radiology Physics: a Handbook for Teachers and Students – chapter 12,32
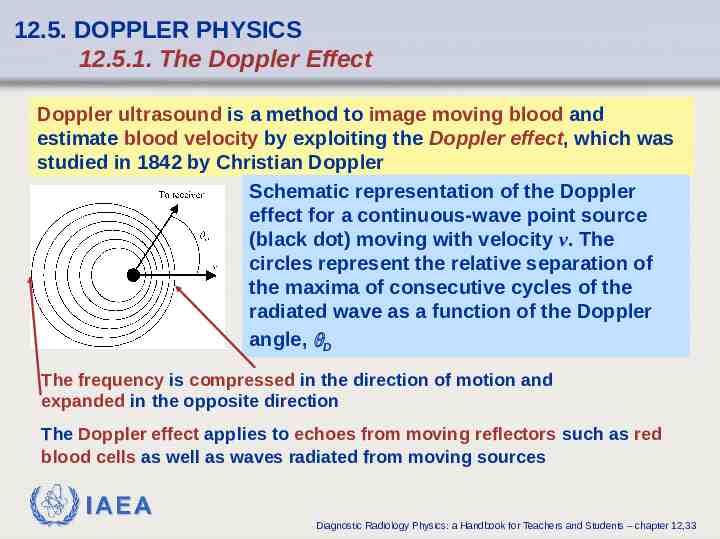
12.5. DOPPLER PHYSICS 12.5.1. The Doppler Effect Doppler ultrasound is a method to image moving blood and estimate blood velocity by exploiting the Doppler effect, which was studied in 1842 by Christian Doppler Schematic representation of the Doppler effect for a continuous-wave point source (black dot) moving with velocity v. The circles represent the relative separation of the maxima of consecutive cycles of the radiated wave as a function of the Doppler angle, qD The frequency is compressed in the direction of motion and expanded in the opposite direction The Doppler effect applies to echoes from moving reflectors such as red blood cells as well as waves radiated from moving sources IAEA Diagnostic Radiology Physics: a Handbook for Teachers and Students – chapter 12,33
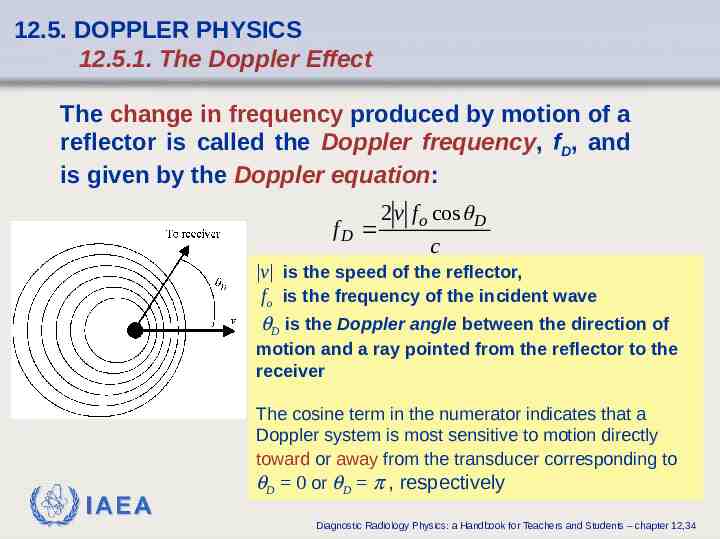
12.5. DOPPLER PHYSICS 12.5.1. The Doppler Effect The change in frequency produced by motion of a reflector is called the Doppler frequency, fD, and is given by the Doppler equation: fD 2 v f o cos D c v is the speed of the reflector, fo is the frequency of the incident wave qD is the Doppler angle between the direction of motion and a ray pointed from the reflector to the receiver IAEA The cosine term in the numerator indicates that a Doppler system is most sensitive to motion directly toward or away from the transducer corresponding to qD 0 or qD p , respectively Diagnostic Radiology Physics: a Handbook for Teachers and Students – chapter 12,34
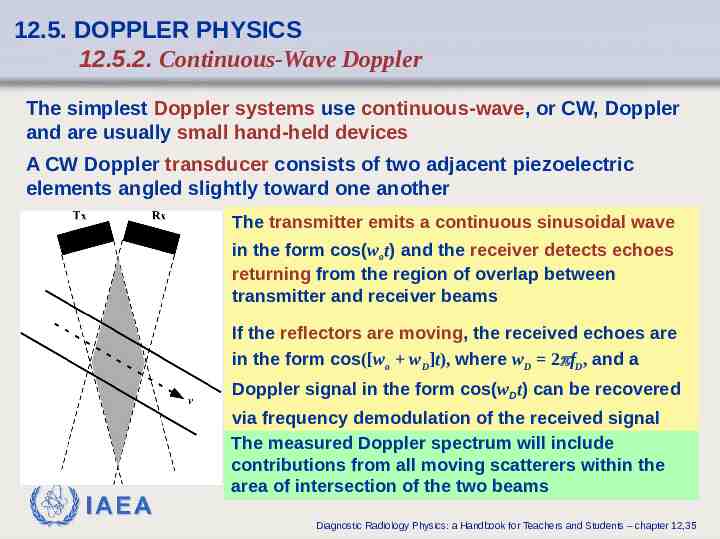
12.5. DOPPLER PHYSICS 12.5.2. Continuous-Wave Doppler The simplest Doppler systems use continuous-wave, or CW, Doppler and are usually small hand-held devices A CW Doppler transducer consists of two adjacent piezoelectric elements angled slightly toward one another The transmitter emits a continuous sinusoidal wave in the form cos(wot) and the receiver detects echoes returning from the region of overlap between transmitter and receiver beams If the reflectors are moving, the received echoes are in the form cos([wo wD]t), where wD 2pfD, and a Doppler signal in the form cos(wDt) can be recovered IAEA via frequency demodulation of the received signal The measured Doppler spectrum will include contributions from all moving scatterers within the area of intersection of the two beams Diagnostic Radiology Physics: a Handbook for Teachers and Students – chapter 12,35
12.5. DOPPLER PHYSICS 12.5.2. Continuous-Wave Doppler The maximum blood flow velocity under normal conditions is about 1 m/s at the entrance to the aorta 2 v f o cos D The Doppler equation f D c indicates that: MHz transmit frequencies used for diagnostic ultrasound will produce Doppler frequencies of at most a few kHz, which is within the range of audible frequencies The simplest CW Doppler devices just direct the demodulated Doppler signal to a speaker for the physician to interpret audibly IAEA Diagnostic Radiology Physics: a Handbook for Teachers and Students – chapter 12,36
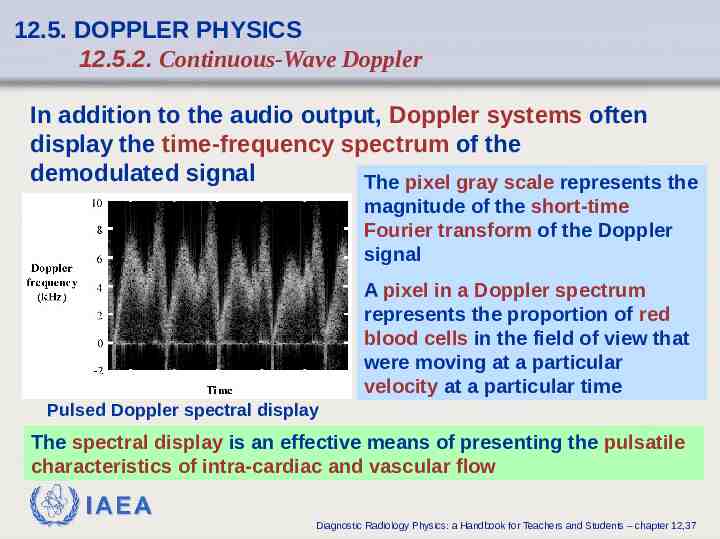
12.5. DOPPLER PHYSICS 12.5.2. Continuous-Wave Doppler In addition to the audio output, Doppler systems often display the time-frequency spectrum of the demodulated signal The pixel gray scale represents the magnitude of the short-time Fourier transform of the Doppler signal A pixel in a Doppler spectrum represents the proportion of red blood cells in the field of view that were moving at a particular velocity at a particular time Pulsed Doppler spectral display The spectral display is an effective means of presenting the pulsatile characteristics of intra-cardiac and vascular flow IAEA Diagnostic Radiology Physics: a Handbook for Teachers and Students – chapter 12,37
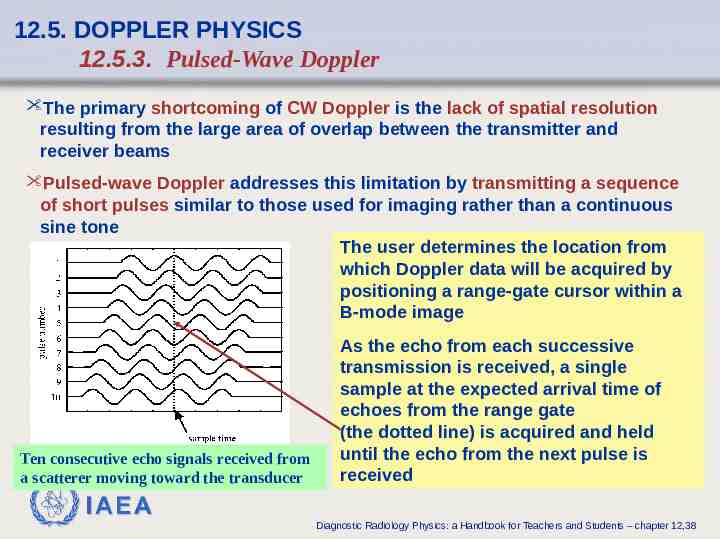
12.5. DOPPLER PHYSICS 12.5.3. Pulsed-Wave Doppler The primary shortcoming of CW Doppler is the lack of spatial resolution resulting from the large area of overlap between the transmitter and receiver beams Pulsed-wave Doppler addresses this limitation by transmitting a sequence of short pulses similar to those used for imaging rather than a continuous sine tone The user determines the location from which Doppler data will be acquired by positioning a range-gate cursor within a B-mode image Ten consecutive echo signals received from a scatterer moving toward the transducer As the echo from each successive transmission is received, a single sample at the expected arrival time of echoes from the range gate (the dotted line) is acquired and held until the echo from the next pulse is received IAEA Diagnostic Radiology Physics: a Handbook for Teachers and Students – chapter 12,38
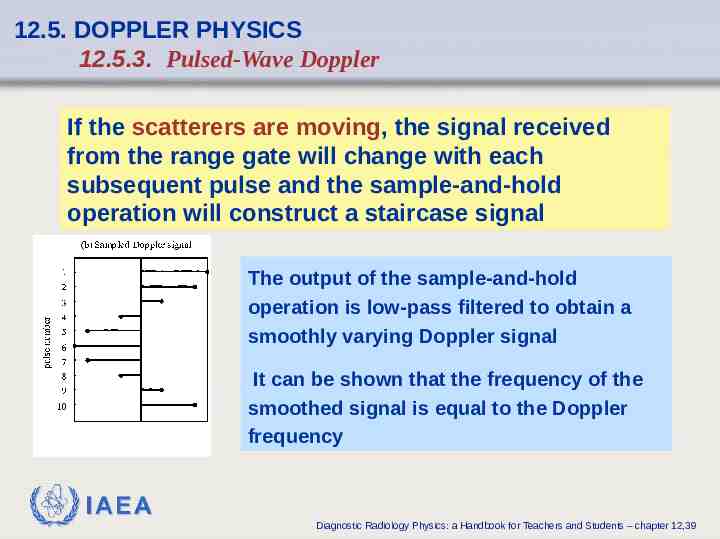
12.5. DOPPLER PHYSICS 12.5.3. Pulsed-Wave Doppler If the scatterers are moving, the signal received from the range gate will change with each subsequent pulse and the sample-and-hold operation will construct a staircase signal The output of the sample-and-hold operation is low-pass filtered to obtain a smoothly varying Doppler signal It can be shown that the frequency of the smoothed signal is equal to the Doppler frequency IAEA Diagnostic Radiology Physics: a Handbook for Teachers and Students – chapter 12,39
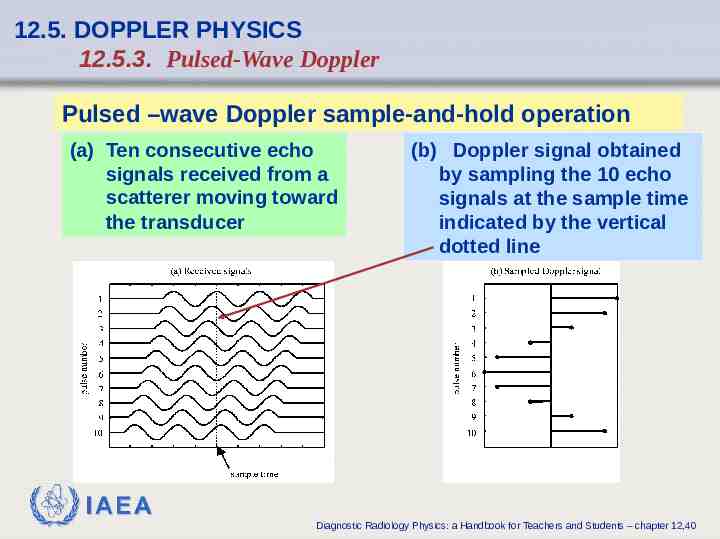
12.5. DOPPLER PHYSICS 12.5.3. Pulsed-Wave Doppler Pulsed –wave Doppler sample-and-hold operation (a) Ten consecutive echo signals received from a scatterer moving toward the transducer (b) Doppler signal obtained by sampling the 10 echo signals at the sample time indicated by the vertical dotted line IAEA Diagnostic Radiology Physics: a Handbook for Teachers and Students – chapter 12,40
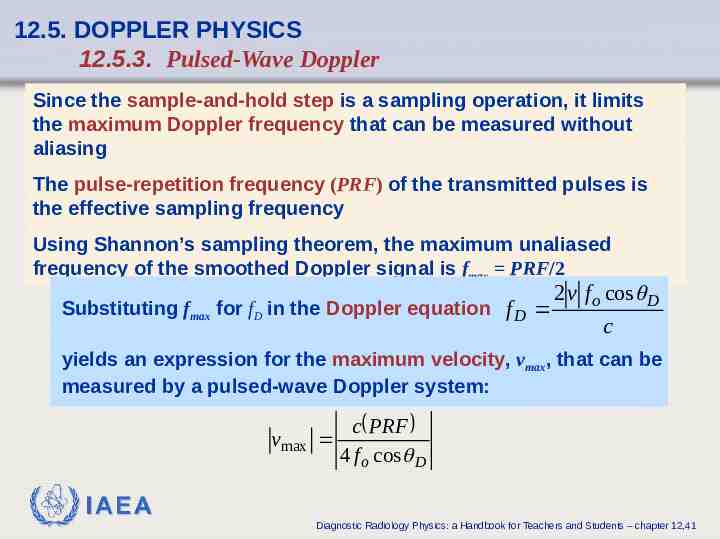
12.5. DOPPLER PHYSICS 12.5.3. Pulsed-Wave Doppler Since the sample-and-hold step is a sampling operation, it limits the maximum Doppler frequency that can be measured without aliasing The pulse-repetition frequency (PRF) of the transmitted pulses is the effective sampling frequency Using Shannon’s sampling theorem, the maximum unaliased frequency of the smoothed Doppler signal is fmax PRF/2 Substituting fmax for fD in the Doppler equation f D 2 v f o cos D c yields an expression for the maximum velocity, vmax, that can be measured by a pulsed-wave Doppler system: vmax c PRF 4 f o cos D IAEA Diagnostic Radiology Physics: a Handbook for Teachers and Students – chapter 12,41
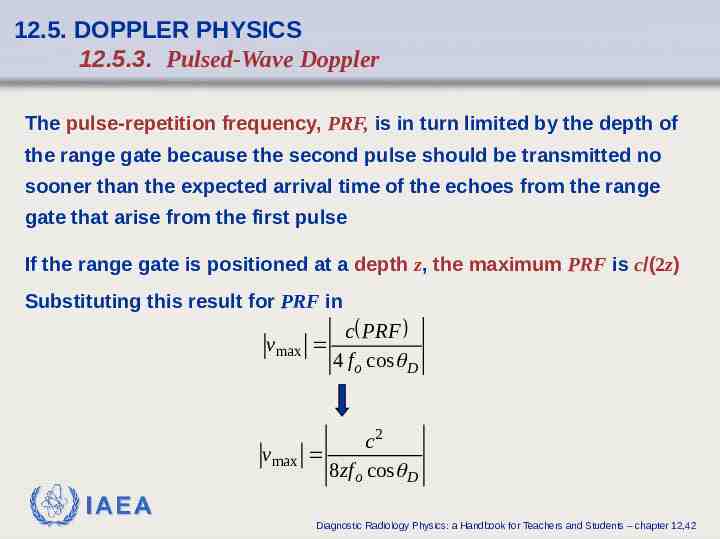
12.5. DOPPLER PHYSICS 12.5.3. Pulsed-Wave Doppler The pulse-repetition frequency, PRF, is in turn limited by the depth of the range gate because the second pulse should be transmitted no sooner than the expected arrival time of the echoes from the range gate that arise from the first pulse If the range gate is positioned at a depth z, the maximum PRF is c/(2z) Substituting this result for PRF in vmax vmax c PRF 4 f o cos D c2 8 zf o cos D IAEA Diagnostic Radiology Physics: a Handbook for Teachers and Students – chapter 12,42
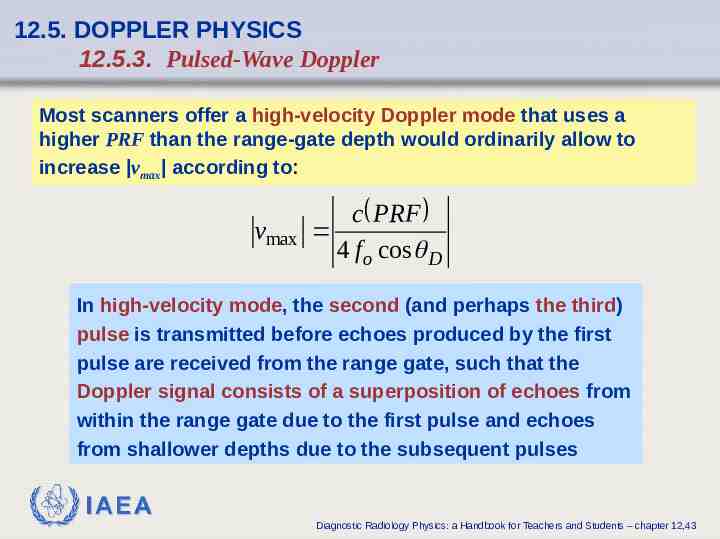
12.5. DOPPLER PHYSICS 12.5.3. Pulsed-Wave Doppler Most scanners offer a high-velocity Doppler mode that uses a higher PRF than the range-gate depth would ordinarily allow to increase vmax according to: vmax c PRF 4 f o cos D In high-velocity mode, the second (and perhaps the third) pulse is transmitted before echoes produced by the first pulse are received from the range gate, such that the Doppler signal consists of a superposition of echoes from within the range gate due to the first pulse and echoes from shallower depths due to the subsequent pulses IAEA Diagnostic Radiology Physics: a Handbook for Teachers and Students – chapter 12,43
12.6. BIOLOGICAL EFFECTS OF ULTRASOUND 12.6.1. Bioeffects Mechanisms The two most important mechanisms for biological effects of ultrasound are: thermal absorption cavitation Ultrasound is generally assumed to be the safest medical imaging modality, but when a high-intensity ultrasound pulse is transmitted through tissue: a substantial amount of energy can be transferred from the pulse to the tissue, thereby increasing the risk of adverse effects to the patient these biological effects can be used beneficially by therapeutic ultrasound devices but are undesirable during diagnostic imaging IAEA Diagnostic Radiology Physics: a Handbook for Teachers and Students – chapter 12,44
12.6. BIOLOGICAL EFFECTS OF ULTRASOUND 12.6.1. Bioeffects Mechanisms Thermal absorption: tissue heating is caused by absorption, the primary mechanism of attenuation The local temperature rise produced by a single pulse at the intensities used for diagnostic imaging is small In B-mode imaging, where the beam is continuously steered through the tissue, blood flow typically dissipates the heat deposited by one pulse before the same volume of tissue is insonified again, but in techniques such as pulsed Doppler where several pulses are transmitted to the same focal point in close succession, local heating can occur at the focus In therapeutic ultrasound, thermal absorption is exploited for hyperthermia treatment of cancerous tumours by transmitting high-intensity pulses that produce more rapid heating than the pulses used for diagnostic imaging IAEA Diagnostic Radiology Physics: a Handbook for Teachers and Students – chapter 12,45
12.6. BIOLOGICAL EFFECTS OF ULTRASOUND 12.6.1. Bioeffects Mechanisms Cavitation: oscillation in the volume of a gas bubble in response to pressure fluctuations produced by an incident ultrasound wave Cavitation is most likely to occur in vivo when microbubble contrast agents are employed or if the lungs are exposed to ultrasound, but most tissues contain small volumes of gas that can coalesce to form cavitation nuclei when exposed to ultrasound Low-intensity ultrasound typically produces harmless stable cavitation in which gas bubbles are not disrupted Higher intensity ultrasound can produce inertial cavitation, in which the rarefractional phase of the pressure wave expands the bubble to greater than its maximum stable volume, resulting in a sudden collapse of the bubble The sudden collapse produces local heating on the order to 1,000 – 10,000 C IAEA Diagnostic Radiology Physics: a Handbook for Teachers and Students – chapter 12,46
12.6. BIOLOGICAL EFFECTS OF ULTRASOUND 12.6.2. Acoustic output metrics Ultrasound exposure has traditionally been quantified by measuring the spatial peak, temporal average intensity, ISPTA, which is the transmitted signal measured at the point with greatest intensity within the radiated field (usually the focus of the transducer) and averaged over a period equal to several pulse repetition intervals The temporal averaging step in the determination of ISPTA results in a greater measured exposure for modalities such as pulsed Doppler where the same focal point is insonified repeatedly in rapid succession ISPTA reflects the fact that repeated insonation increases the risk of thermal bioeffects because heat may accumulate more quickly than it can be dissipated by blood flow IAEA Diagnostic Radiology Physics: a Handbook for Teachers and Students – chapter 12,47
12.6. BIOLOGICAL EFFECTS OF ULTRASOUND 12.6.2. Acoustic output metrics Thermal index, TI, and the mechanical index, MI Additional exposure parameters that more accurately reflect the risks of producing thermal and mechanical bioeffects Most scanners manufactured since 1992 display real-time estimates of the TI and MI The thermal index, TI, is the ratio of the acoustic power output by the scanner to the estimated acoustic power needed to raise the temperature of the tissue being imaged by 1 C Different tissue thermal models, and hence different calculations of the TI, are used for soft tissue, skeletal bone, and cranial bone The tissue thermal model also accounts for the pulse repetition frequency such that a higher TI will be computed for scanning modes such as pulsed Doppler IAEA Diagnostic Radiology Physics: a Handbook for Teachers and Students – chapter 12,48
12.6. BIOLOGICAL EFFECTS OF ULTRASOUND 12.6.2. Acoustic output metrics The mechanical index, MI, is interpreted as a measure of the relative risk of inducing cavitation and is based on an empirically derived formula: MI max p f max(p ) is the peak rarefactional pressure after correction for attenuation The use of max(p ) in the numerator of the formula reflects the fact that inertial cavitation is triggered by overexpansion of a gas bubble and the f -1/2 reflects the experimental observation that inertial cavitation is more likely at lower frequencies IAEA Diagnostic Radiology Physics: a Handbook for Teachers and Students – chapter 12,49
12.6. BIOLOGICAL EFFECTS OF ULTRASOUND 12.6.2. Acoustic output metrics Diagnostic ultrasound scanners manufactured since 1992 and sold in the United States are limited to: a maximum temporal average intensity, ISPTA, of 720 mW/cm2 and a maximum mechanical index, MI, of 1.9 The American temporal average intensity, ISPTA mechanical index, MI, limits are the de facto output limits for most of the world, due to the relatively large size of the American medical device market IAEA Diagnostic Radiology Physics: a Handbook for Teachers and Students – chapter 12,50
12.6. BIOLOGICAL EFFECTS OF ULTRASOUND 12.6.3. Patient safety consideration There is no specific upper limit on thermal index, TI, but ultrasound operators are encouraged to apply the “as low as reasonably achievable” (ALARA) principle to the TI A TI 2 is generally considered safe exposure for adults Short exposures at higher TI can also be used safely; a rule of thumb for scanning adults at TI 2 is to limit the exposure time, te, according to: TI 6 log10 te t is measured in minutes e 0.6 Fetal imaging merits additional caution, especially for scanning at high TI In the United States, fetal exposure times at TI 2 – 6 are restricted to much shorter durations than are suggested by above equation Fetal exposure at TI 4 is limited to 4 minutes maximum IAEA Diagnostic Radiology Physics: a Handbook for Teachers and Students – chapter 12,51
12.6. BIOLOGICAL EFFECTS OF ULTRASOUND 12.6.3. Patient safety consideration Another circumstance in which additional vigilance is recommended because the presence of excess gas increases the risk of inertial cavitation is the presence of a significant volume of gas bubbles, as would occur when imaging structures near the lungs or in exams using microbubble contrast agents Contrast agents should be avoided in fetal imaging and used with caution in echocardiography of patients with pulmonary hypertension or other unstable cardiopulmonary conditions When contrast agents are used, inertial cavitation can generally be avoided by maintaining an MI 0.3, but low-MI scanning is not always feasible because some contrast-enhanced imaging protocols obtain diagnostic information by intentionally disrupting the microbubbles at MI 1 IAEA Diagnostic Radiology Physics: a Handbook for Teachers and Students – chapter 12,52
BIBLIOGRAPHY BIOEFFECTS COMMITTEE OF THE AIUM, American Institute of Ultrasound in Medicine Consensus Report on Potential Bioeffects of Diagnostic Ultrasound: Executive Summary, J. Ultrasound Med. 27:503515 (2008) BLACKSTOCK, D.T., Fundamentals of Physical Acoustics, Wiley, New York (2000) COBBOLD, R.S.C., Foundations of Biomedical Ultrasound, Oxford University Press, New York (2007) EVANS, D.H., McDICKEN, W.N., Doppler Ultrasound: Physics, Instrumentation and Signal Processing, Wiley, New York (2000) HILL, C.R., BAMBER, J.C., TER HARR G., (Eds), Physical Principles of Medical Ultrasonics, 2nd edn, Wiley, West Sussex, UK (2004) JENSEN, J.A., Estimation of Blood Velocities Using Ultrasound: A Signal Processing Approach, Cambridge, UK: Cambridge University Press (1996) IAEA Diagnostic Radiology Physics: a Handbook for Teachers and Students – chapter 12,53
BIBLIOGRAPHY KINSLER, L.E., FREY, A.R., COPPENS, A.B., SANDERS, J.V., Fundamentals of Acoustics, 4th edn, Wiley, New York (2000) KREMKAU, F.W., Diagnostic Ultrasound: Principles and Instruments, 7th edn, Saunders/ Elsevier, St. Louis, MO (2006) PIERCE, A.D., Acoustics: An Introduction to its Physical Principles and Applications, Acoustical Society of America, Woodbury, NY (1989) SHUNG, K.K., Diagnostic Ultrasound: Imaging and Blood Flow Measurements, CRC Press, Boca Raton, FL (2006) SZABO, T.L., Diagnostic Ultrasound Imaging: Inside Out, Elsevier Academic Press, Boston (2004) ZAGZEBSKI, J.A., Essentials of Ultrasound Physics, Mosby, St. Louis, MO (1996) IAEA Diagnostic Radiology Physics: a Handbook for Teachers and Students – chapter 12,54