Figure 1 The share of large firms (200 or more workers)


7 Slides195.51 KB
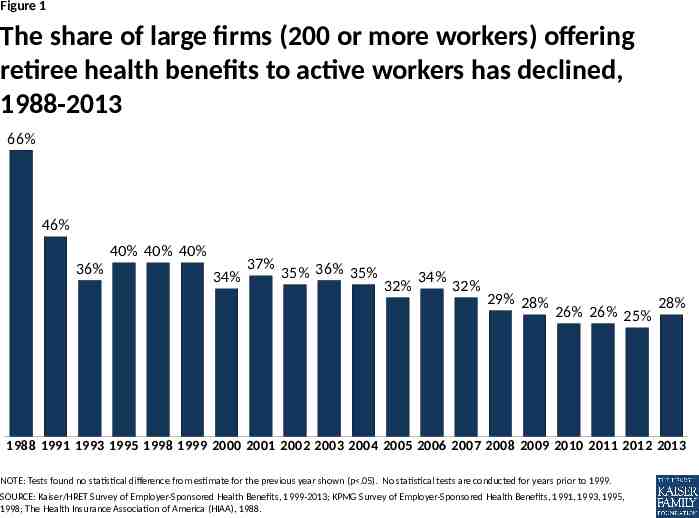
Figure 1 The share of large firms (200 or more workers) offering retiree health benefits to active workers has declined, 1988-2013 66% 46% 40% 40% 40% 36% 34% 37% 35% 36% 35% 32% 34% 32% 29% 28% 26% 26% 25% 28% 1988 1991 1993 1995 1998 1999 2000 2001 2002 2003 2004 2005 2006 2007 2008 2009 2010 2011 2012 2013 NOTE: Tests found no statistical difference from estimate for the previous year shown (p .05). No statistical tests are conducted for years prior to 1999. SOURCE: Kaiser/HRET Survey of Employer-Sponsored Health Benefits, 1999-2013; KPMG Survey of Employer-Sponsored Health Benefits, 1991, 1993, 1995, 1998; The Health Insurance Association of America (HIAA), 1988.
Figure 2 Larger firms are more likely to offer retiree health benefits to active workers than smaller firms, 2013 48% 34% 26% 5% 3 - 199 workers 200 - 999 workers SOURCE: Kaiser/HRET Survey of Employer-Sponsored Health Benefits, 2013. 1,000 - 4,999 workers 5,000 or more workers
Figure 3 Forty-five percent of all retirees ages 55 to 64 have retiree health coverage, 2012 No health insurance 15% Tricare 5% Medicaid 10% Employment based health benefits 45% Medicare 15% Individually Purchased 11% Total retirees, ages 55 to 64, 2012 5.3 Million NOTE: Numbers do not sum to 100 percent due to rounding. SOURCE: Kaiser Family Foundation analysis of the 2012 Current Population Survey.
Figure 4 Nearly one in three Medicare Beneficiaries has a retiree health plan that supplements Medicare No Supplemental Other Coverage Public/ 14% Private 1% Retiree Health Coverage 31% Medigap 15% Medicaid 16% Medicare Advantage 19% EmployerSponsored Insurance 4% Total Medicare Beneficiaries, 2010 48.4 Million NOTES: Supplemental coverage was assigned in the following order: 1) Employer-Sponsored Insurance and Retiree Health Coverage, 2) Medicare Advantage, 3) Medicaid, 4) Medigap, 5) Other public/private coverage, 6) No supplemental coverage. Individuals with more than one source of coverage were assigned to the category that appears highest in the ordering. SOURCE: Kaiser Family Foundation analysis of the CMS Medicare Current Beneficiary Survey Cost and Use File, 2010.
Figure 5 Beneficiaries with retiree health coverage are disproportionately white, in better health, and have higher incomes than other Medicare beneficiaries Race/Ethnicity Health Status Excellent 18% Excellent 14% White 86% 73% Very good More than 40,000 23% Very good White Income 26% 30,000 – 40,000 Good 20,000 – 30,000 34% 15% 30% 29% Fair 10,000 – 20,000 Good 40,000 11% 8% 20,000 – 30,000 30,000 – 18% 40,000 10,000 – 20,000 41% 29% Black 11% Hispanic 11% Black 6% Hispanic 4% Other 5% Other 4% Beneficiaries All other with RHB beneficiaries Fair 13% Poor 5% 21% Poor 10% Beneficiaries All other with RHB beneficiaries 28% 10,000 5% Less than 10,000 22% Beneficiaries All other with RHB beneficiaries NOTES: RHB is retiree health benefits. SOURCE: Kaiser Family Foundation analysis of the CMS Medicare Current Beneficiary Survey Cost and Use File, 2010.
Figure 6 The number of retirees in Medicare Advantage group plans is rising, 2008-2013 2.5 2.3 2.1 1.8 1.7 0.1 0.1 0.1 0.3 0.4 0.1 0.6 1.9 0.7 0.1 0.1 1.0 1.0 0.2 0.1 0.1 0.1 1.2 1.3 0.7 0.3 1.0 1.0 1.1 Other PFFS plans Regional PPOs Local PPOs HMOs Series6 1.1 NOTE: PFFS is Private Fee-for-Service plans, PPOs are preferred provider organizations, and HMOs are Health Maintenance Organizations. Other includes MSAs, cost plans and demonstrations. Includes Special Needs Plans as well as other Medicare Advantage plans. Numbers may not sum to total due to rounding. SOURCE: MPR/Kaiser Family Foundation analysis of CMS Medicare Advantage enrollment files, 2008-2013.
Figure 7 The number of retirees in employer-sponsored retiree drug plans has declined, and is expected to continue declining, 2006-2022 Number of beneficiaries with retiree drug subsidies, in millions Historical 7.2 7.1 6.8 6.7 6.8 Projected 6.2 5.6 3.2 2.1 1.5 0.8 0.8 0.9 0.9 0.9 0.9 1.0 2006 2007 2008 2009 2010 2011 2012 2013 2014 2015 2016 2017 2018 2019 2020 2021 2022 SOURCE: Centers for Medicare and Medicaid Services, 2013 Annual Report of the Boards of Trustees of the Federal Hospital Insurance and Federal Supplementary Medical insurance Trust Funds, May 2013.