Federal Credit and Insurance Programs: Housing By John M. Quigley


41 Slides150.50 KB
Federal Credit and Insurance Programs: Housing By John M. Quigley University of California Berkeley Federal Reserve Bank of St. Louis October 20-21-2005
Federal Housing Policy Direct: Renter Assistance Supply Demand Public Housing Tax Credit Payments Shelter Allowances Indirect: Homeowner Assistance Tax Expenditures Credit, Guarantees, Insurance
Homeowner Assistance Guarantees and Insurance Federal Housing Administration Veterans Administration Department of Veterans’ Affairs Farm Service Administration Department of Housing and Urban Development Department of Agriculture Credit Ginnie Mae Fannie Mae Department of Housing and Urban Development Private Firm, Federally Chartered Freddie Mac Private Firm, Federally Chartered
Guarantees and Insurance 1920s: Small Mortgage Market 1929: No Mortgage Market Short Term, Non –Amortizing Mortgages, Contract Purchase Credit Contraction, Foreclosure 1934: FHA Mortgage Insurance against Default
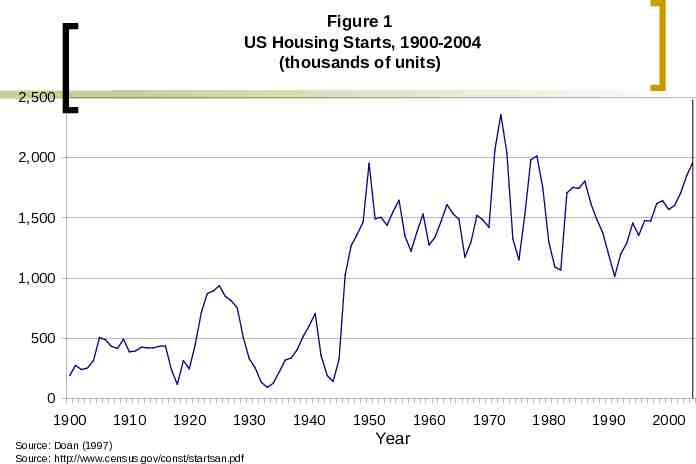
Figure 1 US Housing Starts, 1900-2004 (thousands of units) 2,500 2,000 1,500 1,000 500 0 1900 1910 1920 1930 Source: Doan (1997) Source: http://www.census.gov/const/startsan.pdf 1940 1950 Year 1960 1970 1980 1990 2000
FHA builds the mortgage market Guarantees and Insurance Low Interest Rates 20 Year Term Self Amortizing Standardization Appraisals Credit History Financial Capacity Key Insurance Device Mutual Mortgage Insurance Fund “actuarially sound” Small Transfers Widely Available
VA Home Loans 1944 GI Bill Temporary “readjustment” is transformed to a permanent program Low interest rates, no down payments Key Guarantee Device Federally subsidized guarantee for 60 percent of the face value of a veteran’s mortgage
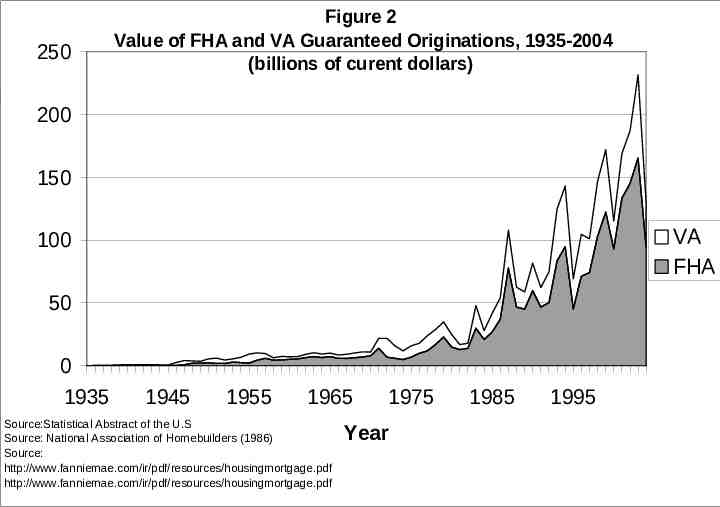
250 Figure 2 Value of FHA and VA Guaranteed Originations, 1935-2004 (billions of curent dollars) 200 150 VA FHA 100 50 0 1935 1945 1955 1965 Source:Statistical Abstract of the U.S Source: National Association of Homebuilders (1986) Source: http://www.fanniemae.com/ir/pdf/resources/housingmortgage.pdf http://www.fanniemae.com/ir/pdf/resources/housingmortgage.pdf 1975 Year 1985 1995
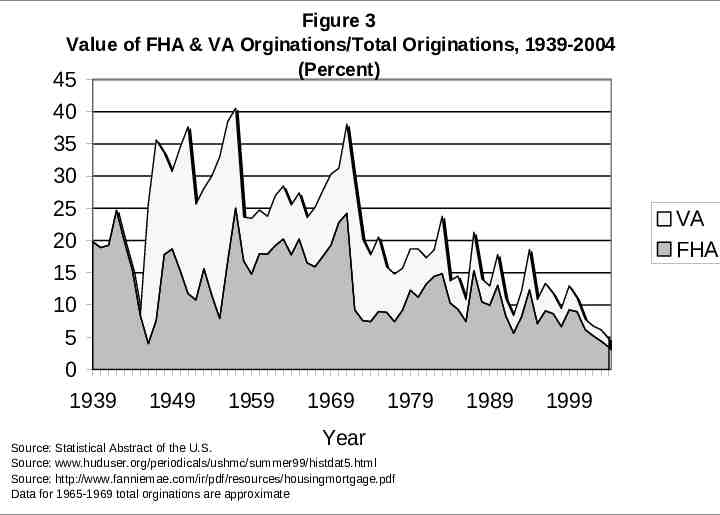
Figure 3 Value of FHA & VA Orginations/Total Originations, 1939-2004 (Percent) 45 40 35 30 25 20 15 10 5 0 1939 VA FHA 1949 1959 1969 Year 1979 Source: Statistical Abstract of the U.S. Source: www.huduser.org/periodicals/ushmc/summer99/histdat5.html Source: http://www.fanniemae.com/ir/pdf/resources/housingmortgage.pdf Data for 1965-1969 total orginations are approximate 1989 1999
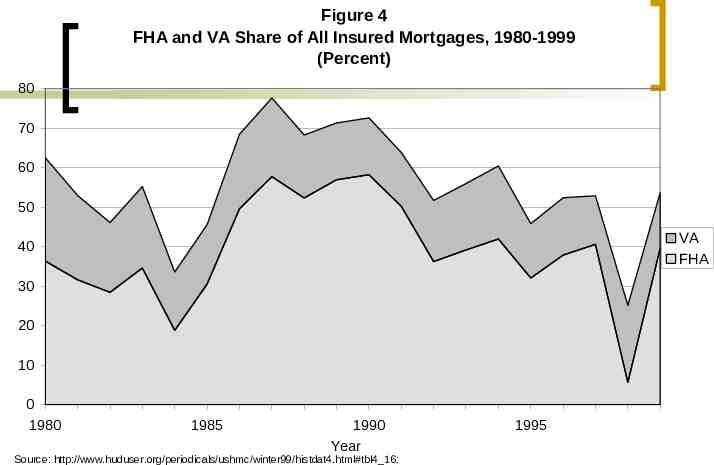
Figure 4 FHA and VA Share of All Insured Mortgages, 1980-1999 (Percent) 80 70 60 50 VA FHA 40 30 20 10 0 1980 1985 1990 Year Source: http://www.huduser.org/periodicals/ushmc/winter99/histdat4.html#tbl4 16: 1995
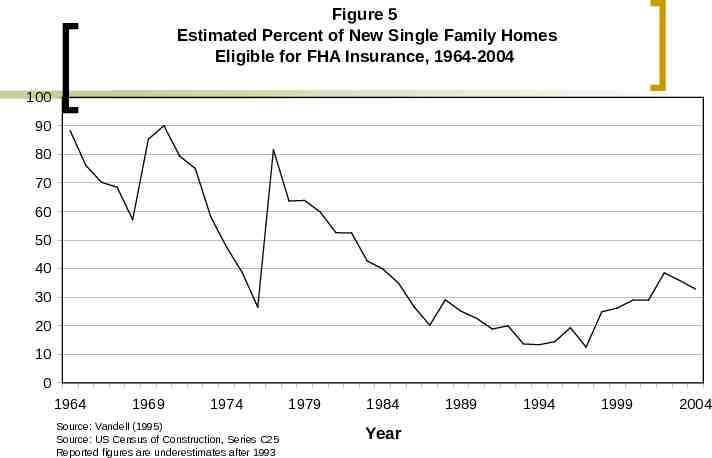
Figure 5 Estimated Percent of New Single Family Homes Eligible for FHA Insurance, 1964-2004 100 90 80 70 60 50 40 30 20 10 0 1964 1969 1974 Source: Vandell (1995) Source: US Census of Construction, Series C25 Reported figures are underestimates after 1993 1979 1984 Year 1989 1994 1999 2004
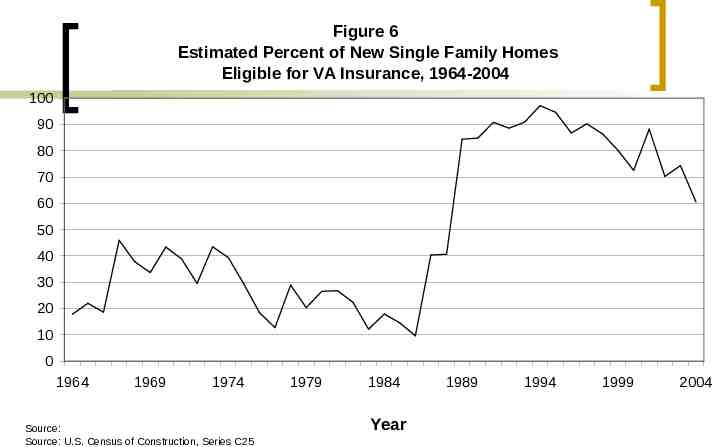
Figure 6 Estimated Percent of New Single Family Homes Eligible for VA Insurance, 1964-2004 100 90 80 70 60 50 40 30 20 10 0 1964 1969 1974 Source: Source: U.S. Census of Construction, Series C25 1979 1984 Year 1989 1994 1999 2004
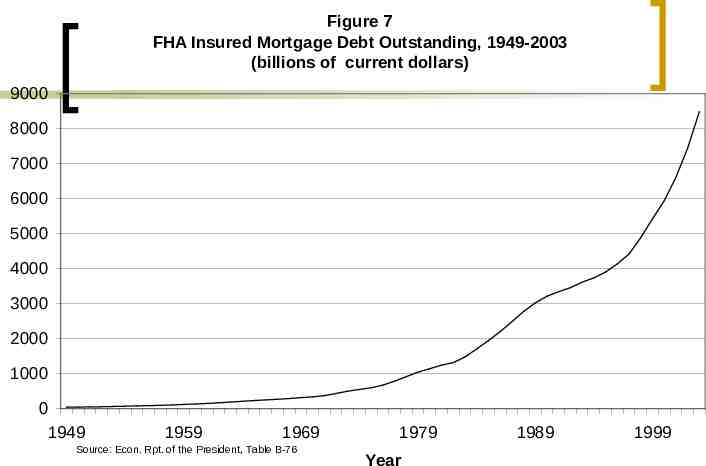
Figure 7 FHA Insured Mortgage Debt Outstanding, 1949-2003 (billions of current dollars) 9000 8000 7000 6000 5000 4000 3000 2000 1000 0 1949 1959 1969 Source: Econ. Rpt. of the President, Table B-76 1979 Year 1989 1999
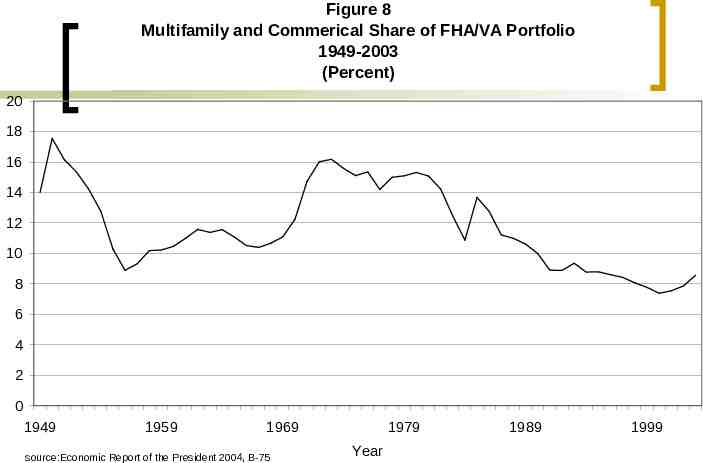
Figure 8 Multifamily and Commerical Share of FHA/VA Portfolio 1949-2003 (Percent) 20 18 16 14 12 10 8 6 4 2 0 1949 1959 1969 source:Economic Report of the President 2004, B-75 1979 Year 1989 1999
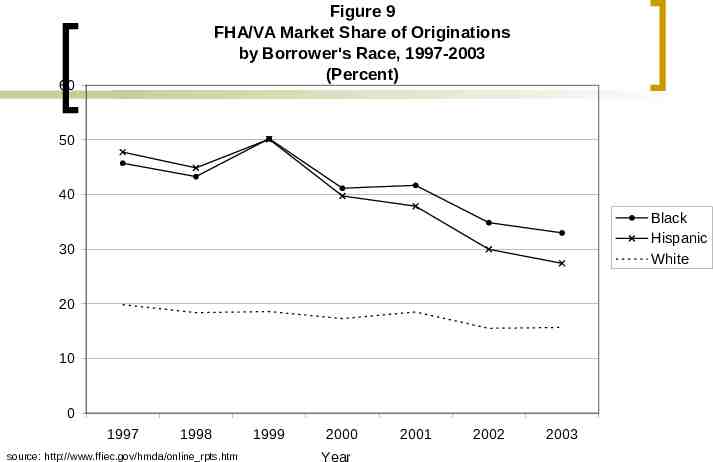
Figure 9 FHA/VA Market Share of Originations by Borrower's Race, 1997-2003 (Percent) 60 50 40 Black Hispanic White 30 20 10 0 1997 1998 source: http://www.ffiec.gov/hmda/online rpts.htm 1999 2000 Year 2001 2002 2003
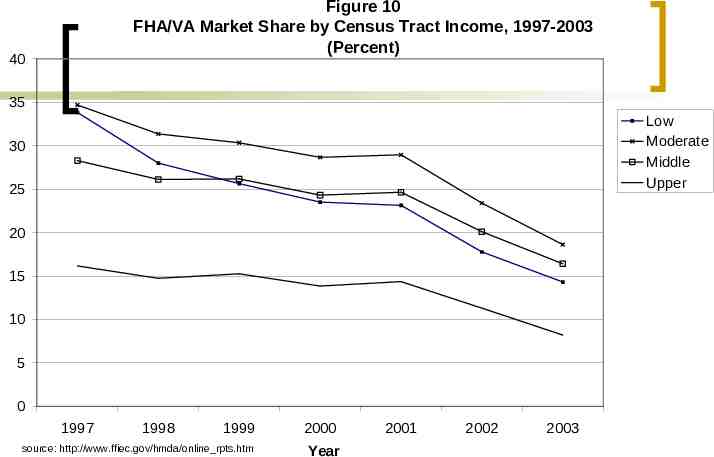
Figure 10 FHA/VA Market Share by Census Tract Income, 1997-2003 (Percent) 40 35 Low Moderate Middle Upper 30 25 20 15 10 5 0 1997 1998 1999 source: http://www.ffiec.gov/hmda/online rpts.htm 2000 Year 2001 2002 2003
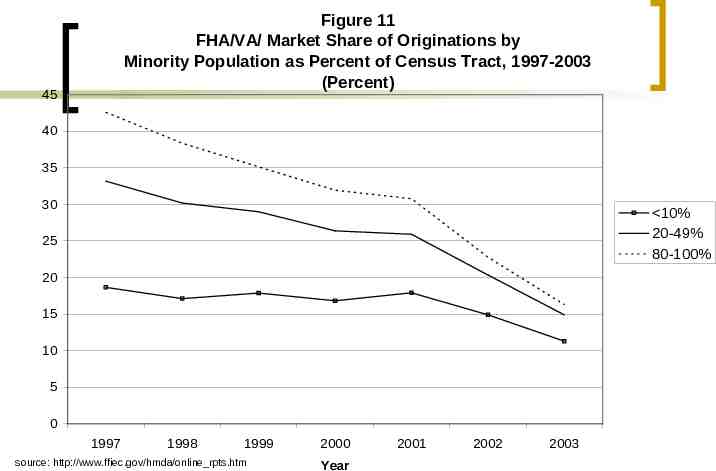
Figure 11 FHA/VA/ Market Share of Originations by Minority Population as Percent of Census Tract, 1997-2003 (Percent) 45 40 35 30 10% 20-49% 80-100% 25 20 15 10 5 0 1997 1998 1999 source: http://www.ffiec.gov/hmda/online rpts.htm 2000 Year 2001 2002 2003
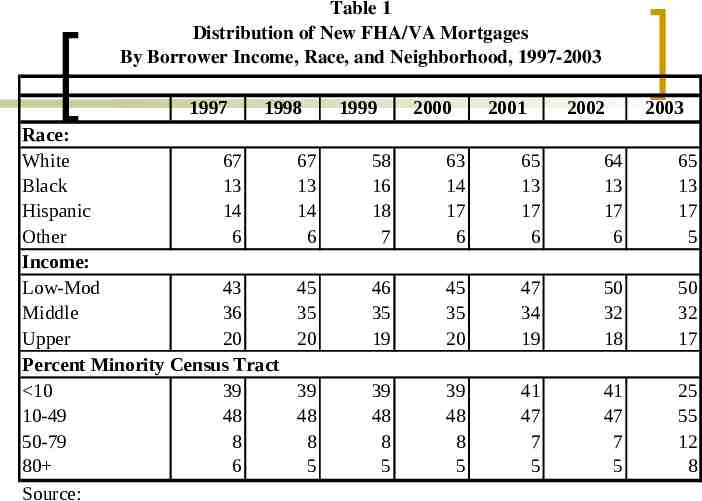
Table 1 Distribution of New FHA/VA Mortgages By Borrower Income, Race, and Neighborhood, 1997-2003 1997 1998 Race: White 67 Black 13 Hispanic 14 Other 6 Income: Low-Mod 43 Middle 36 Upper 20 Percent Minority Census Tract 10 39 10-49 48 50-79 8 80 6 Source: 1999 2000 2001 2002 2003 67 13 14 6 58 16 18 7 63 14 17 6 65 13 17 6 64 13 17 6 65 13 17 5 45 35 20 46 35 19 45 35 20 47 34 19 50 32 18 50 32 17 39 48 8 5 39 48 8 5 39 48 8 5 41 47 7 5 41 47 7 5 25 55 12 8
ECONOMIC RATIONALE 1. Racial Discrimination and Minority Access 2. “Continuing Demonstration” 3. Increased Homeownership and Housing Consumption
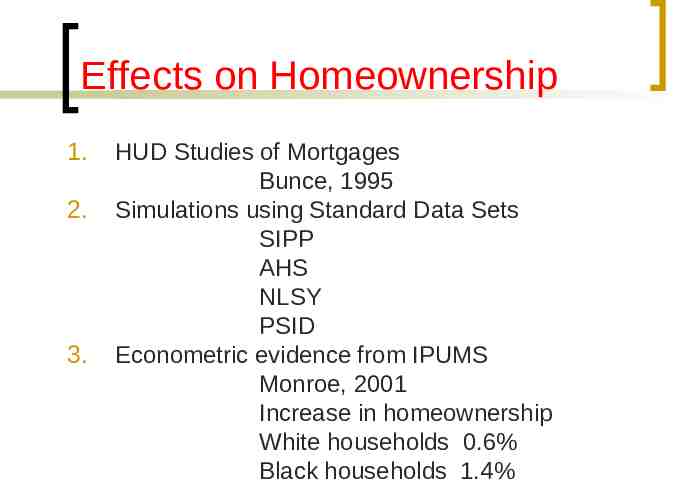
Effects on Homeownership 1. 2. 3. HUD Studies of Mortgages Bunce, 1995 Simulations using Standard Data Sets SIPP AHS NLSY PSID Econometric evidence from IPUMS Monroe, 2001 Increase in homeownership White households 0.6% Black households 1.4%
Mortgage Credit 1932: short term loans to thrifts through FHLBs 1938: Federal purchase of FHA and VA mortgages through FNMA 1968: FNMA reconstituted as GSE 1970: FHLMC formed as GSE
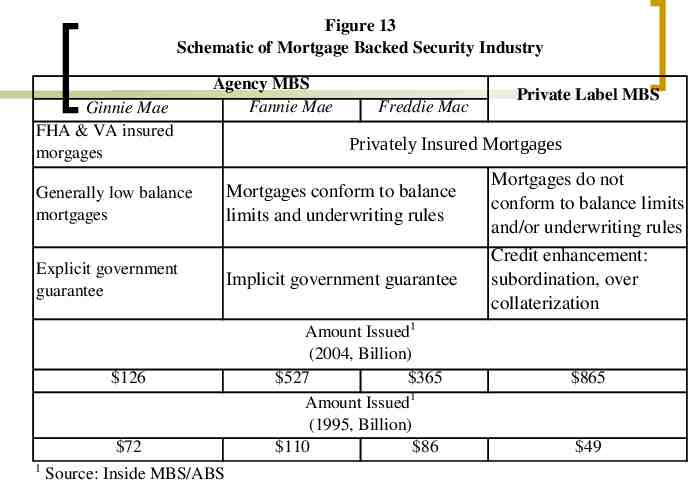
Figure 13 Schematic of Mortgage Backed Security Industry Ginnie Mae FHA & VA insured morgages Agency MBS Fannie Mae Generally low balance mortgages Explicit government guarantee 126 72 1 Source: Inside MBS/ABS Freddie Mac Private Label MBS Privately Insured Mortgages Mortgages conform to balance limits and underwriting rules Mortgages do not conform to balance limits and/or underwriting rules Implicit government guarantee Credit enhancement: subordination, over collaterization Amount Issued1 (2004, Billion) 527 365 Amount Issued1 (1995, Billion) 110 86 865 49
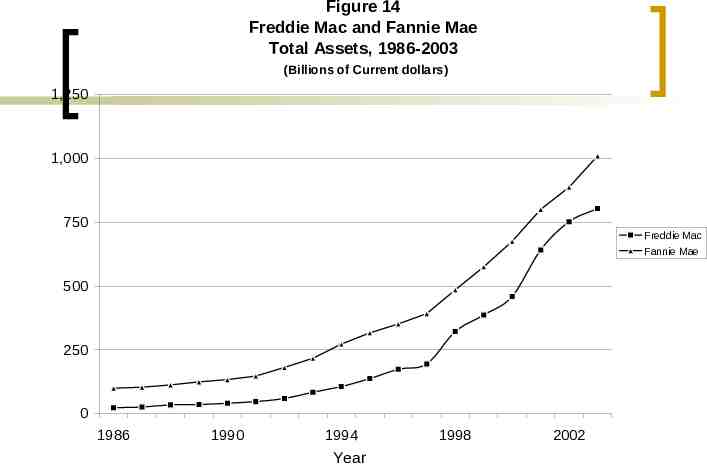
Figure 14 Freddie Mac and Fannie Mae Total Assets, 1986-2003 (Billions of Current dollars) 1,250 1,000 750 Freddie Mac Fannie Mae 500 250 0 1986 1990 1994 Year 1998 2002
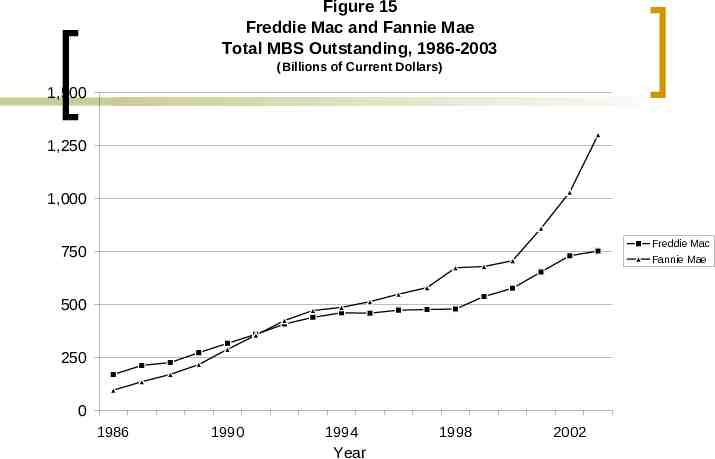
Figure 15 Freddie Mac and Fannie Mae Total MBS Outstanding, 1986-2003 (Billions of Current Dollars) 1,500 1,250 1,000 Freddie Mac Fannie Mae 750 500 250 0 1986 1990 1994 Year 1998 2002
GSE and Fundamental Change in Secondary Market 1960s: James Stewart Model 1970s: Decentralization and Specialization Origination Investment Servicing 1980s: Technology
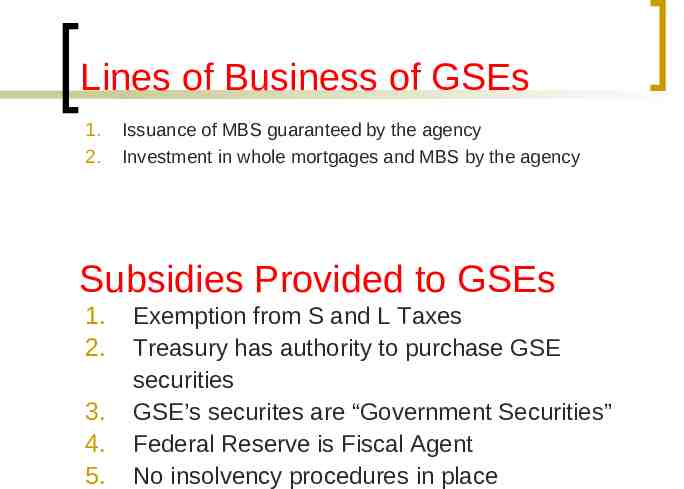
Lines of Business of GSEs 1. 2. Issuance of MBS guaranteed by the agency Investment in whole mortgages and MBS by the agency Subsidies Provided to GSEs 1. 2. 3. 4. 5. Exemption from S and L Taxes Treasury has authority to purchase GSE securities GSE’s securites are “Government Securities” Federal Reserve is Fiscal Agent No insolvency procedures in place
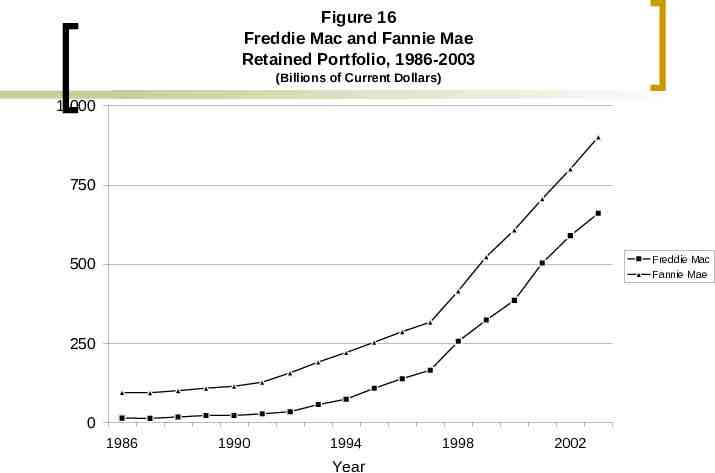
Figure 16 Freddie Mac and Fannie Mae Retained Portfolio, 1986-2003 (Billions of Current Dollars) 1,000 750 Freddie Mac Fannie Mae 500 250 0 1986 1990 1994 Year 1998 2002
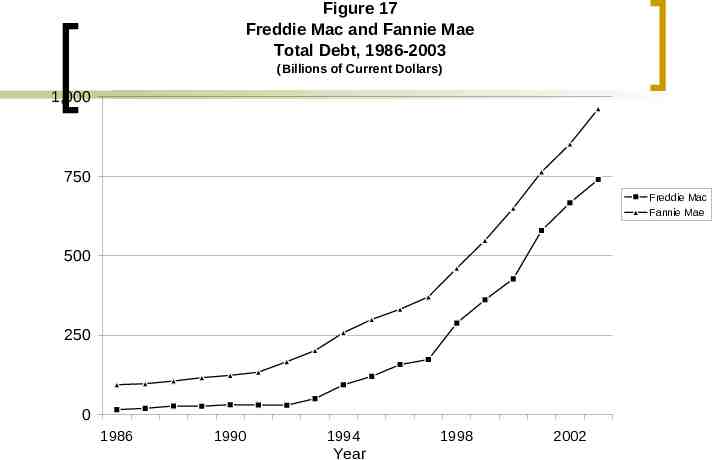
Figure 17 Freddie Mac and Fannie Mae Total Debt, 1986-2003 (Billions of Current Dollars) 1,000 750 Freddie Mac Fannie Mae 500 250 0 1986 1990 1994 Year 1998 2002
Subsidy Provided by implicit Guarantee? Yield Spread between GSE and Comparable firms benchmark? comparison with indexes? at issue?
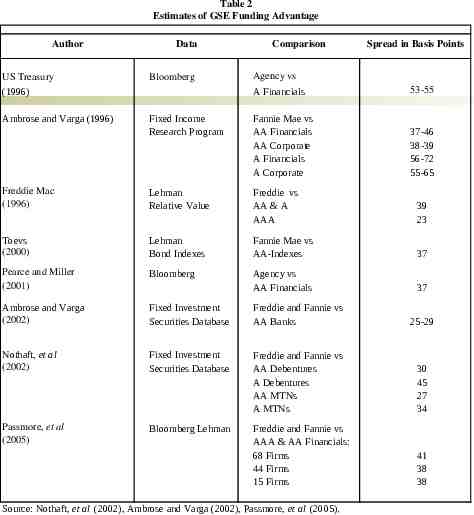
Table 2 Estimates of GSE Funding Advantage Author US Treasury Data Bloomberg (1996) Comparison Spread in Basis Points Agency vs A Financials 53-55 Fixed Income Research Program Fannie Mae vs AA Financials AA Corporate A Financials A Corporate 37-46 38-39 56-72 55-65 Freddie Mac (1996) Lehman Relative Value Freddie vs AA & A AAA 39 23 Toevs (2000) Lehman Bond Indexes Fannie Mae vs AA-Indexes 37 Pearce and Miller (2001) Bloomberg Agency vs AA Financials 37 Ambrose and Varga (2002) Fixed Investment Securities Database Freddie and Fannie vs AA Banks 25-29 Nothaft, et al (2002) Fixed Investment Securities Database Freddie and Fannie vs AA Debentures A Debentures AA MTNs A MTNs 30 45 27 34 Passmore, et al (2005) Bloomberg Lehman Freddie and Fannie vs AAA & AA Financials: 68 Firms 44 Firms 15 Firms 41 38 38 Ambrose and Varga (1996) Source: Nothaft, et al (2002), Ambrose and Varga (2002), Passmore, et al (2005).
ECONOMIC EFFECTS Housing Market Lower Mortgage Rates HUD Goals Broader Issues Stability of Mortgage and Construction Markets Investment in Other Forms of Capital?
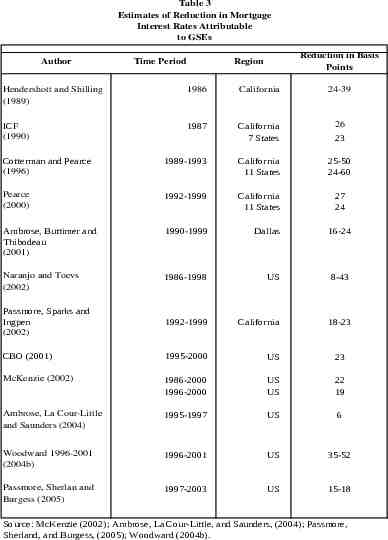
Table 3 Estimates of Reduction in Mortgage Interest Rates Attributable to GSEs Author Time Period Reduction in Basis Points Region Hendershott and Shilling (1989) 1986 California 24-39 ICF (1990) 1987 California 7 States 26 23 Cotterman and Pearce (1996) 1989-1993 California 11 States 25-50 24-60 Pearce (2000) 1992-1999 California 11 States 27 24 Ambrose, Buttimer and Thibodeau (2001) 1990-1999 Dallas 16-24 Naranjo and Toevs (2002) 1986-1998 US 8-43 Passmore, Sparks and Ingpen (2002) 1992-1999 California 18-23 CBO (2001) 1995-2000 US 23 McKenzie (2002) 1986-2000 1996-2000 US US 22 19 Ambrose, La Cour-Little and Saunders (2004) 1995-1997 US 6 Woodward 1996-2001 (2004b) 1996-2001 US 35-52 Passmore, Sherlan and Burgess (2005) 1997-2003 US 15-18 Source: McKenzie (2002); Ambrose, La Cour-Little, and Saunders, (2004); Passmore, Sherland, and Burgess, (2005); Woodward (2004b).
Figure 18 GSE "Low-Moderate Income" Housing Goal, 1996-2008 (Percent of New Loans to Households Below Area Median Income) 60 50 FNMA FHLMC Goal 40 30 1996 1998 2000 Source: HUD Office of Policy Research and Development 2002 Year 2004 2006 2008
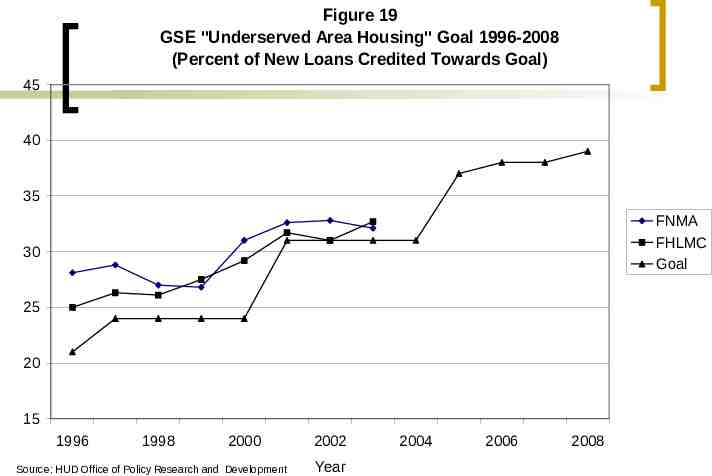
Figure 19 GSE "Underserved Area Housing" Goal 1996-2008 (Percent of New Loans Credited Towards Goal) 45 40 35 FNMA FHLMC Goal 30 25 20 15 1996 1998 2000 Source: HUD Office of Policy Research and Development 2002 Year 2004 2006 2008
Figure 20 GSE "Special Affordable" Housing Goal, 1996-2008 (Percent of New Loans Credited Towards Goal) 30 25 FNMA FHLMC Goal 20 15 10 1996 1998 2000 Source: HUD Office of Policy Research and Development 2002 Year 2004 2006 2008
Effects of Imposition of Goals Ambrose and Thibodeau, 2004 Ambrose and Pennington-Cross, 2000 Gyourko and Hu, 2002 Bostic and Gabriel, 2005
Broader Issues Aaron, 1972! Peek and Wilcox, 2003, 2004 Lehnert, et al, 2005 Perli and Sack, 2003
Why do Any of This? 1. Create Missing Markets Mortgages Tradeable Liquid Mortgage Securities Done 2. Encourage Homeownership Externalities Boehm and Scholottman, 2002 DiPasquale and Glaeser, 1999 Haurin, et al, 2002
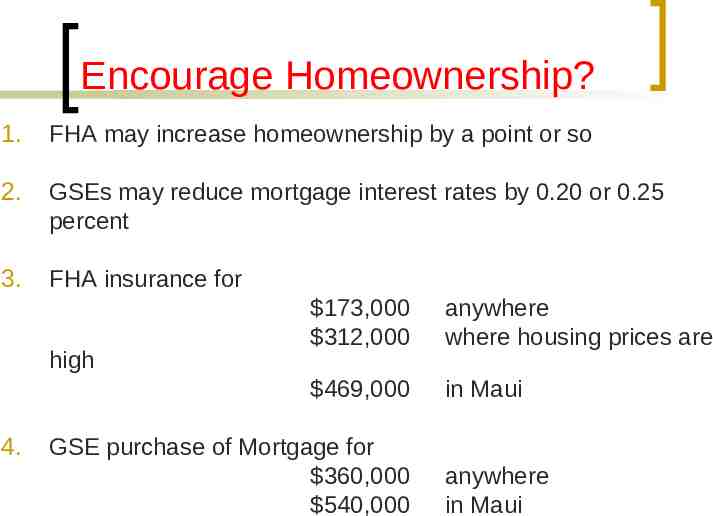
Encourage Homeownership? 1. FHA may increase homeownership by a point or so 2. GSEs may reduce mortgage interest rates by 0.20 or 0.25 percent 3. FHA insurance for high 4. 173,000 312,000 anywhere where housing prices are 469,000 in Maui GSE purchase of Mortgage for 360,000 540,000 anywhere in Maui
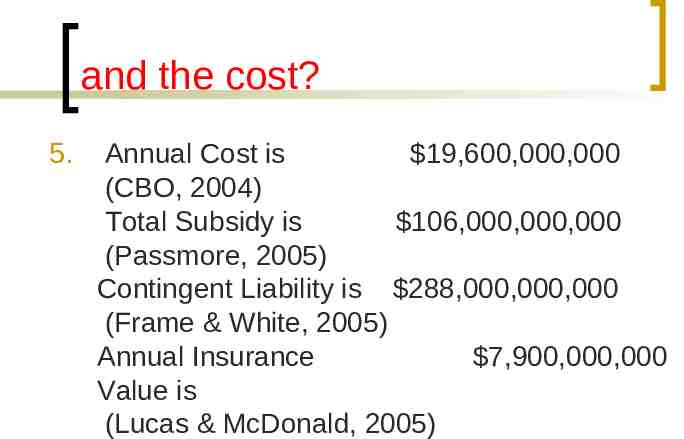
and the cost? 5. Annual Cost is 19,600,000,000 (CBO, 2004) Total Subsidy is 106,000,000,000 (Passmore, 2005) Contingent Liability is 288,000,000,000 (Frame & White, 2005) Annual Insurance 7,900,000,000 Value is (Lucas & McDonald, 2005)
What to do? 1. Target Marginal Homebuyers Freeze Limits on Size Limit to First Time Buyers Increase Target Goals 2. Eliminate Portfolio Holdings Slowly Saves Monitoring Increases Diversification 3. Charge for Free Disaster Insurance