Farm Balance Sheet AAE 320 Paul D. Mitchell
57 Slides1.04 MB
Farm Balance Sheet AAE 320 Paul D. Mitchell
Goal Overview accounting balance sheet as it pertains to agricultural operations How to read a balance sheet Methods used to prepare a balance sheet Depreciation methods
Balance Sheet Systematic listing of everything owned and owed by a business/individual Gives statement of owner equity at a point in time Typically for end of accounting period, such as end of year for taxes Interim balance sheets often used/needed for loan applications
Balance Sheet Balance sheet: Everything must balance Asset: anything owned Liability: debt or financial obligation owed The Basic Accounting Identity must hold Assets Liabilities Owner Equity Adjust Owner Equity to make it balance Equity is what’s left, the residual
Uses of Balance Sheet Measures financial position of firm, focusing on long and short run measures Solvency: measures relative relationships among assets, liabilities and equity to assess “health” of firm (financial ratios) Liquidity: measures ability to meet current financial obligations as they come due without disrupting normal business—ability to generate cash on short-term
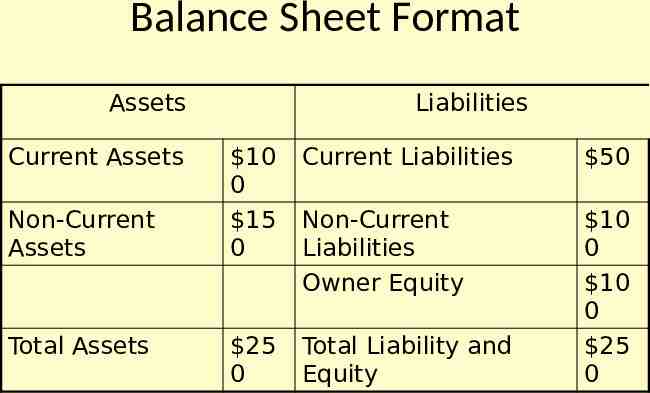
Balance Sheet Format Assets Current Assets Non-Current Assets Total Assets Liabilities 10 0 15 0 Current Liabilities 50 Non-Current Liabilities Owner Equity 25 0 Total Liability and Equity 10 0 10 0 25 0
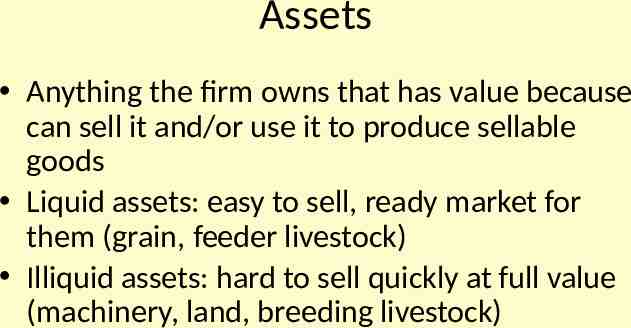
Assets Anything the firm owns that has value because can sell it and/or use it to produce sellable goods Liquid assets: easy to sell, ready market for them (grain, feeder livestock) Illiquid assets: hard to sell quickly at full value (machinery, land, breeding livestock)
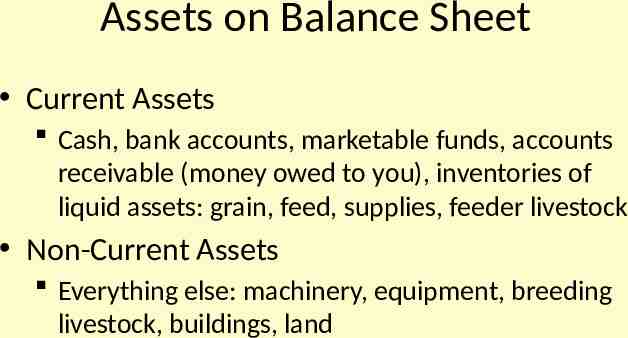
Assets on Balance Sheet Current Assets Cash, bank accounts, marketable funds, accounts receivable (money owed to you), inventories of liquid assets: grain, feed, supplies, feeder livestock Non-Current Assets Everything else: machinery, equipment, breeding livestock, buildings, land
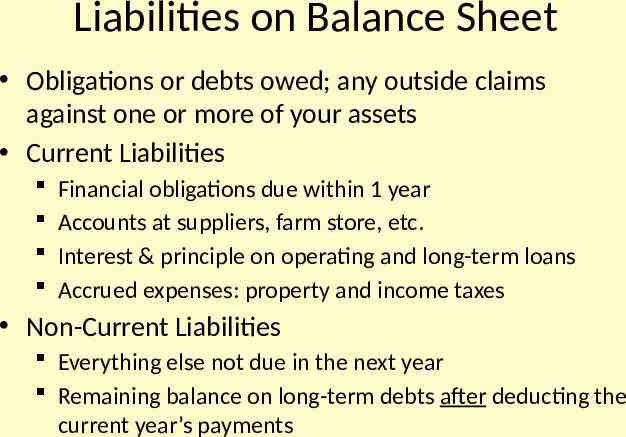
Liabilities on Balance Sheet Obligations or debts owed; any outside claims against one or more of your assets Current Liabilities Financial obligations due within 1 year Accounts at suppliers, farm store, etc. Interest & principle on operating and long-term loans Accrued expenses: property and income taxes Non-Current Liabilities Everything else not due in the next year Remaining balance on long-term debts after deducting the current year’s payments
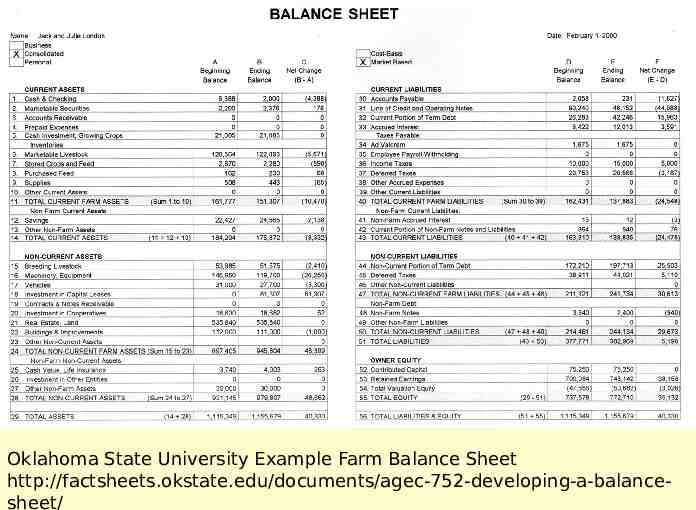
Oklahoma State University Example Farm Balance Sheet http://factsheets.okstate.edu/documents/agec-752-developing-a-balancesheet/
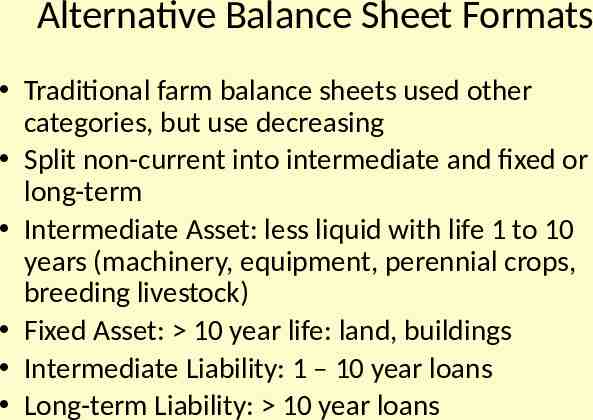
Alternative Balance Sheet Formats Traditional farm balance sheets used other categories, but use decreasing Split non-current into intermediate and fixed or long-term Intermediate Asset: less liquid with life 1 to 10 years (machinery, equipment, perennial crops, breeding livestock) Fixed Asset: 10 year life: land, buildings Intermediate Liability: 1 – 10 year loans Long-term Liability: 10 year loans
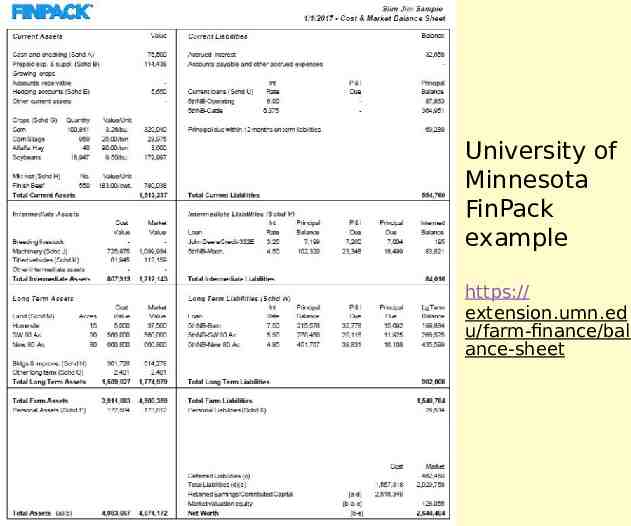
University of Minnesota FinPack example https:// extension.umn.ed u/farm-finance/bal ance-sheet
Owner Equity Net Worth Value left after assets are used to cover all liabilities, what you “own” in the farm Your current investment in the farm Equity changes for many reasons Profits/losses from production activities Sell assets for different values than on sheet Add/withdraw capital from the farm Asset value changes if use market prices for asset valuation, e.g., land value increases
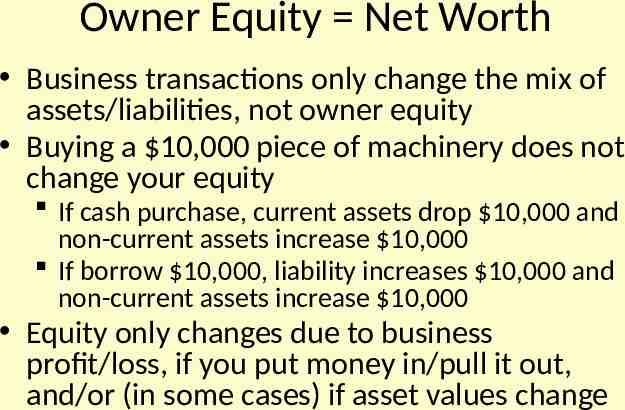
Owner Equity Net Worth Business transactions only change the mix of assets/liabilities, not owner equity Buying a 10,000 piece of machinery does not change your equity If cash purchase, current assets drop 10,000 and non-current assets increase 10,000 If borrow 10,000, liability increases 10,000 and non-current assets increase 10,000 Equity only changes due to business profit/loss, if you put money in/pull it out, and/or (in some cases) if asset values change
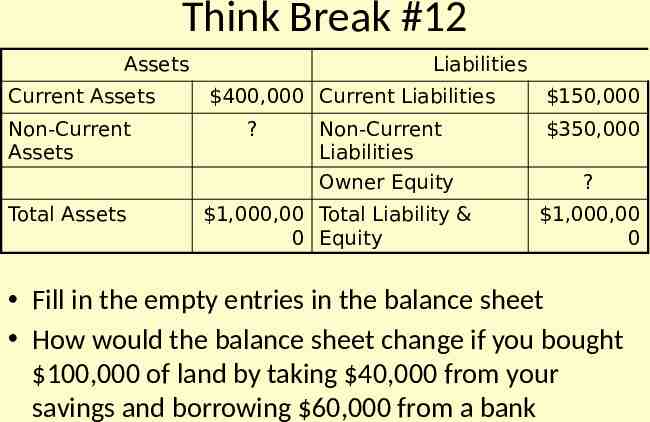
Think Break #12 Assets Current Assets Non-Current Assets Liabilities 400,000 Current Liabilities ? Non-Current Liabilities Owner Equity Total Assets 1,000,00 Total Liability & 0 Equity 150,000 350,000 ? 1,000,00 0 Fill in the empty entries in the balance sheet How would the balance sheet change if you bought 100,000 of land by taking 40,000 from your savings and borrowing 60,000 from a bank
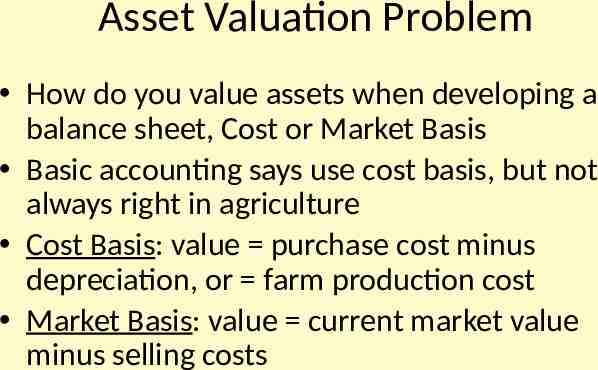
Asset Valuation Problem How do you value assets when developing a balance sheet, Cost or Market Basis Basic accounting says use cost basis, but not always right in agriculture Cost Basis: value purchase cost minus depreciation, or farm production cost Market Basis: value current market value minus selling costs
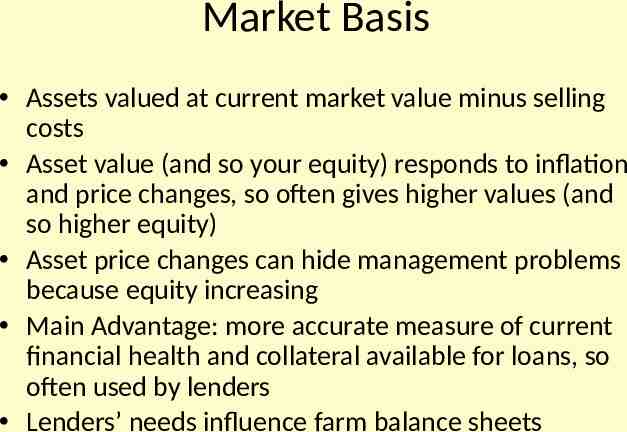
Market Basis Assets valued at current market value minus selling costs Asset value (and so your equity) responds to inflation and price changes, so often gives higher values (and so higher equity) Asset price changes can hide management problems because equity increasing Main Advantage: more accurate measure of current financial health and collateral available for loans, so often used by lenders Lenders’ needs influence farm balance sheets
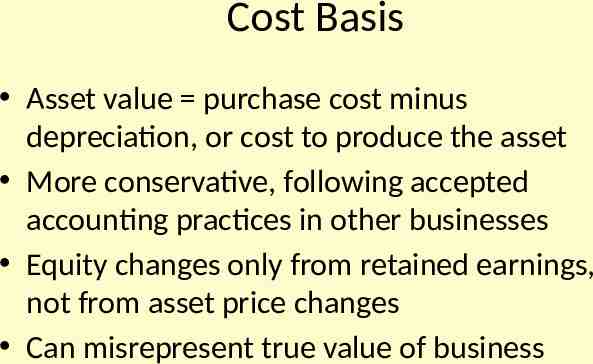
Cost Basis Asset value purchase cost minus depreciation, or cost to produce the asset More conservative, following accepted accounting practices in other businesses Equity changes only from retained earnings, not from asset price changes Can misrepresent true value of business
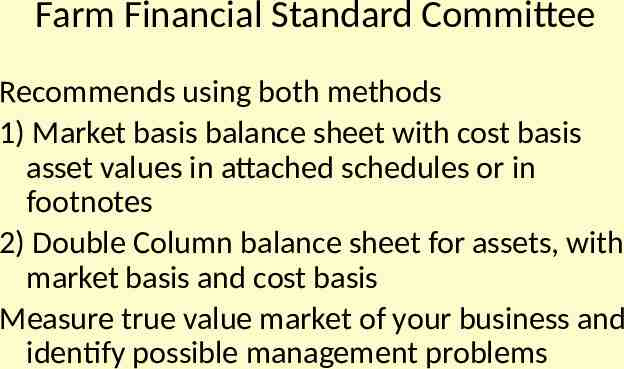
Farm Financial Standard Committee Recommends using both methods 1) Market basis balance sheet with cost basis asset values in attached schedules or in footnotes 2) Double Column balance sheet for assets, with market basis and cost basis Measure true value market of your business and identify possible management problems
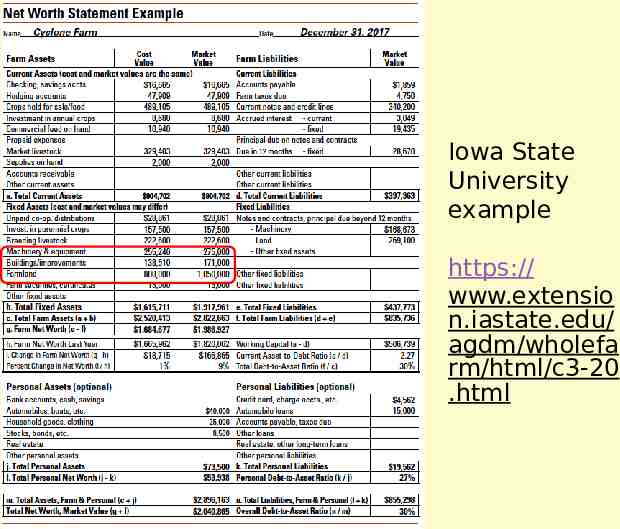
Iowa State University example https:// www.extensio n.iastate.edu/ agdm/wholefa rm/html/c3-20 .html
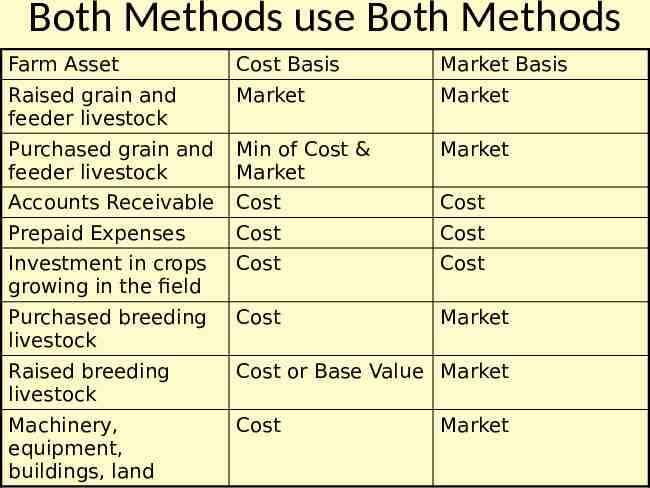
Both Methods use Both Methods Farm Asset Cost Basis Market Basis Raised grain and feeder livestock Market Market Purchased grain and feeder livestock Min of Cost & Market Market Accounts Receivable Cost Cost Prepaid Expenses Cost Cost Investment in crops growing in the field Cost Cost Purchased breeding livestock Cost Market Raised breeding livestock Cost or Base Value Market Machinery, equipment, buildings, land Cost Market
Grain/Livestock Inventories and Crops in the Fields Grain in the bin, animals on the lot ready to go, use market basis Exception: Purchased grain/livestock that has gone up in value, then use cost if a cost basis balance sheet Crops still growing in the field, use cost, since still subject to production risks “Don’t count your chickens before the eggs hatch”
Raised Breeding Livestock Cost Basis: supposed to accumulate all costs to get the animal from birth to productive age (and not include these in the income statement), then depreciate this total cost over its useful lifetime just as though purchased it at this price Alternative: a fixed base value for each age/type of animal to approximate this cost and its depreciation, won’t change with asset market prices
Depreciation Annual loss in value of a working asset due to use, wear, aging, and technical obsolescence What assets due you depreciate? Useful life 1 year Useful life can be determined (not unlimited) Machinery, equipment, buildings, fences, breeding livestock, perennial crops, irrigation wells, land improvements (wells, drainage) Land not depreciated, as has unlimited life
Depreciation: Why Matters Farmers track depreciation in asset value for three main reasons 1) Taxes: deduct depreciation as a cost of business, subtract from annual income 2) Asset “true” value or farm book value: tax depreciation not equal true losses, so track assets for accurate market basis balance sheet 3) Insurance: do you want to insure value or replacement cost? Also, some companies depreciate assets for insurance values
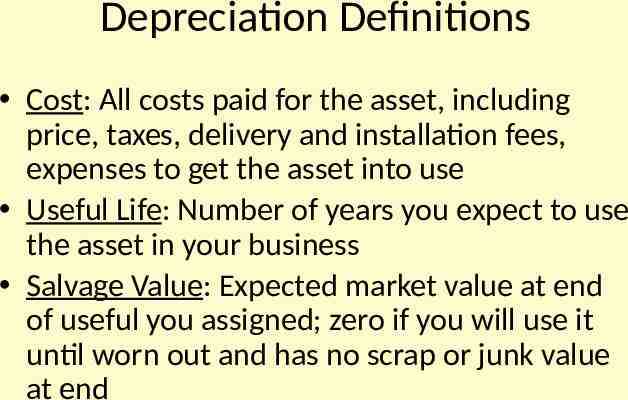
Depreciation Definitions Cost: All costs paid for the asset, including price, taxes, delivery and installation fees, expenses to get the asset into use Useful Life: Number of years you expect to use the asset in your business Salvage Value: Expected market value at end of useful you assigned; zero if you will use it until worn out and has no scrap or junk value at end
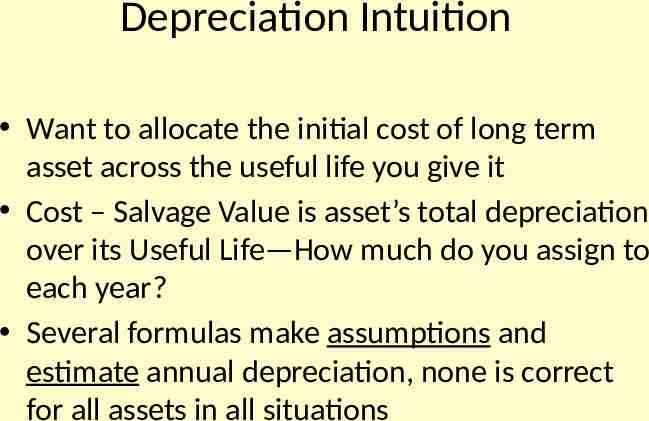
Depreciation Intuition Want to allocate the initial cost of long term asset across the useful life you give it Cost – Salvage Value is asset’s total depreciation over its Useful Life—How much do you assign to each year? Several formulas make assumptions and estimate annual depreciation, none is correct for all assets in all situations
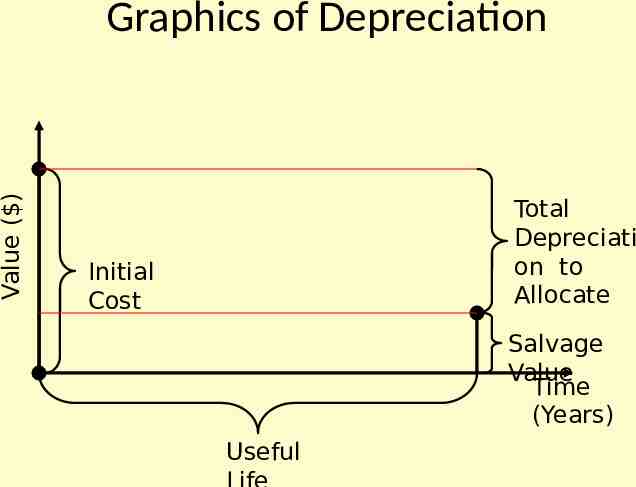
Value ( ) Graphics of Depreciation Total Depreciati on to Allocate Initial Cost Salvage Value Time (Years) Useful
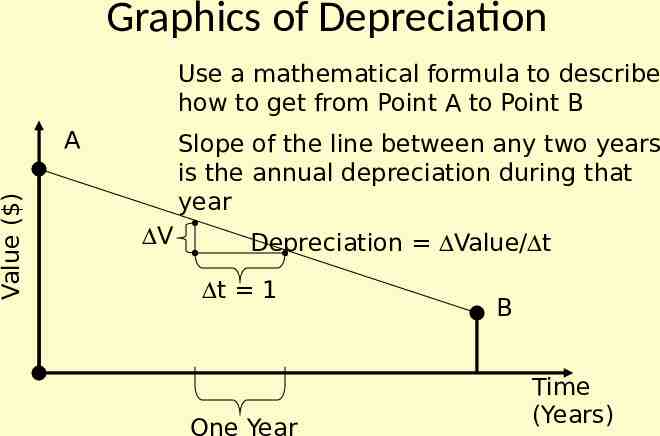
Graphics of Depreciation Use a mathematical formula to describe how to get from Point A to Point B Value ( ) A Slope of the line between any two years is the annual depreciation during that year DV Depreciation DValue/Dt Dt 1 One Year B Time (Years)
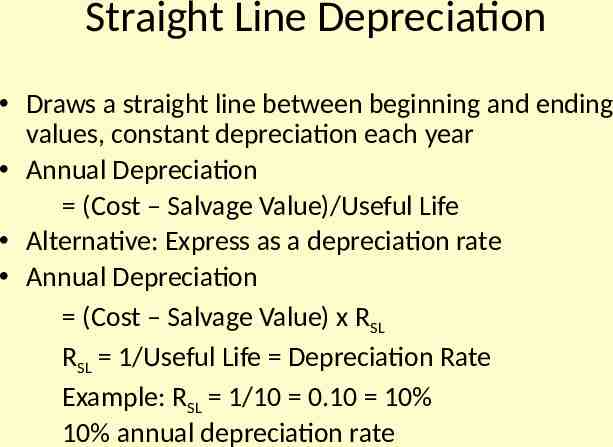
Straight Line Depreciation Draws a straight line between beginning and ending values, constant depreciation each year Annual Depreciation (Cost – Salvage Value)/Useful Life Alternative: Express as a depreciation rate Annual Depreciation (Cost – Salvage Value) x RSL RSL 1/Useful Life Depreciation Rate Example: RSL 1/10 0.10 10% 10% annual depreciation rate
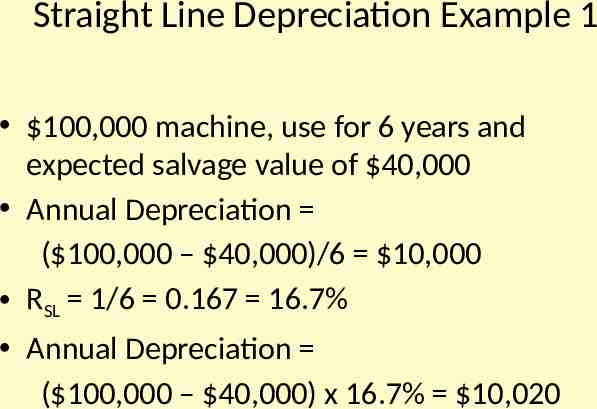
Straight Line Depreciation Example 1 100,000 machine, use for 6 years and expected salvage value of 40,000 Annual Depreciation ( 100,000 – 40,000)/6 10,000 RSL 1/6 0.167 16.7% Annual Depreciation ( 100,000 – 40,000) x 16.7% 10,020
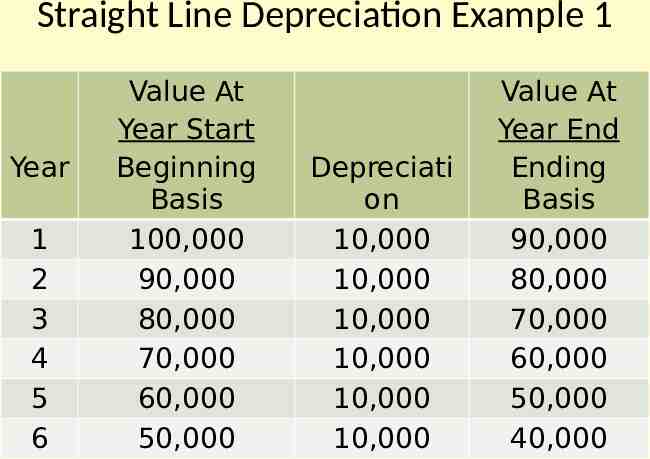
Straight Line Depreciation Example 1 Year 1 2 3 4 5 6 Value At Year Start Beginning Basis 100,000 90,000 80,000 70,000 60,000 50,000 Depreciati on 10,000 10,000 10,000 10,000 10,000 10,000 Value At Year End Ending Basis 90,000 80,000 70,000 60,000 50,000 40,000
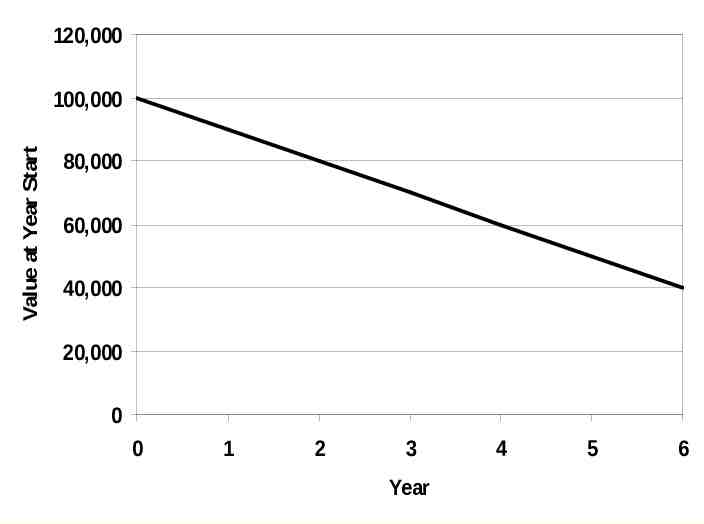
120,000 Value at Year Start 100,000 80,000 60,000 40,000 20,000 0 0 1 2 3 Year 4 5 6
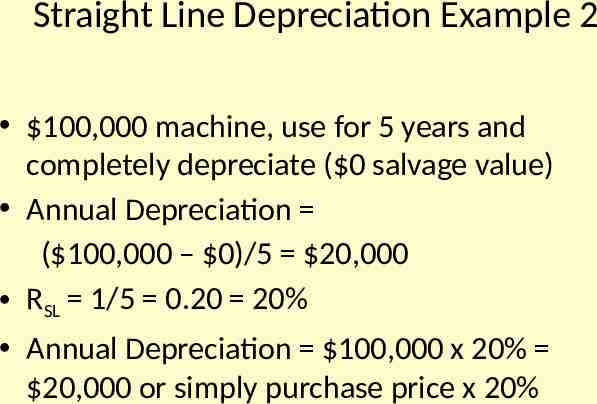
Straight Line Depreciation Example 2 100,000 machine, use for 5 years and completely depreciate ( 0 salvage value) Annual Depreciation ( 100,000 – 0)/5 20,000 RSL 1/5 0.20 20% Annual Depreciation 100,000 x 20% 20,000 or simply purchase price x 20%
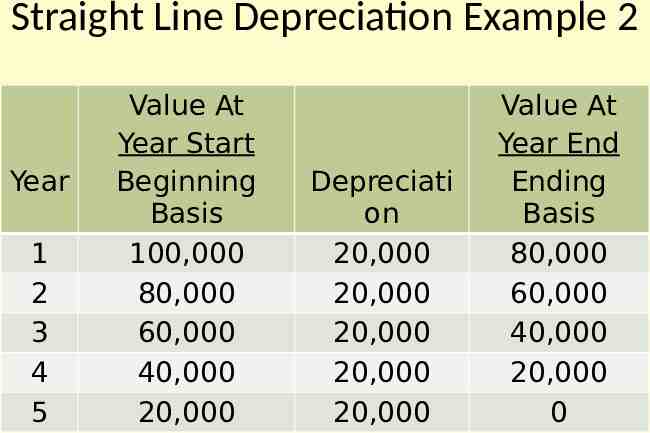
Straight Line Depreciation Example 2 Year 1 2 3 4 5 Value At Year Start Beginning Basis 100,000 80,000 60,000 40,000 20,000 Depreciati on 20,000 20,000 20,000 20,000 20,000 Value At Year End Ending Basis 80,000 60,000 40,000 20,000 0
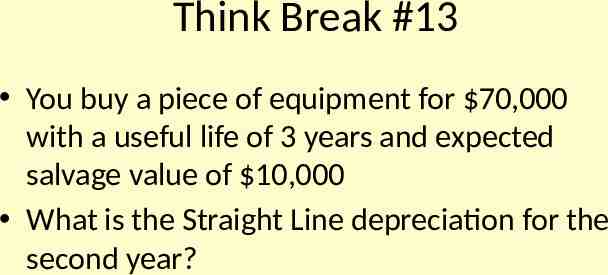
Think Break #13 You buy a piece of equipment for 70,000 with a useful life of 3 years and expected salvage value of 10,000 What is the Straight Line depreciation for the second year?
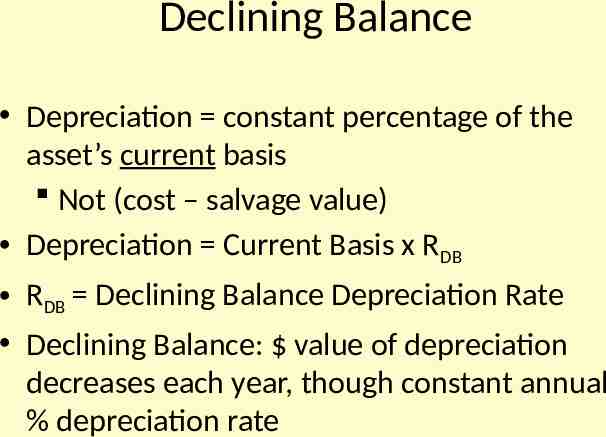
Declining Balance Depreciation constant percentage of the asset’s current basis Not (cost – salvage value) Depreciation Current Basis x RDB RDB Declining Balance Depreciation Rate Declining Balance: value of depreciation decreases each year, though constant annual % depreciation rate
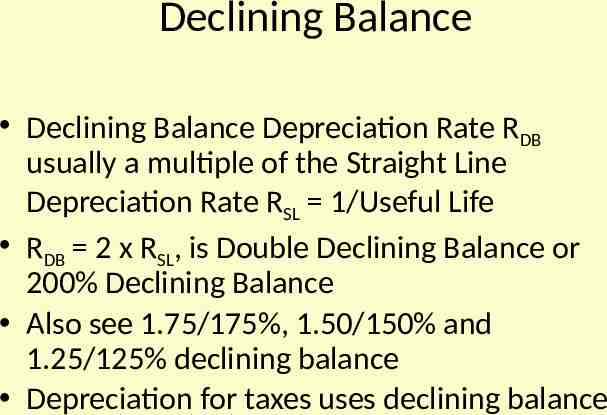
Declining Balance Declining Balance Depreciation Rate RDB usually a multiple of the Straight Line Depreciation Rate RSL 1/Useful Life RDB 2 x RSL, is Double Declining Balance or 200% Declining Balance Also see 1.75/175%, 1.50/150% and 1.25/125% declining balance Depreciation for taxes uses declining balance
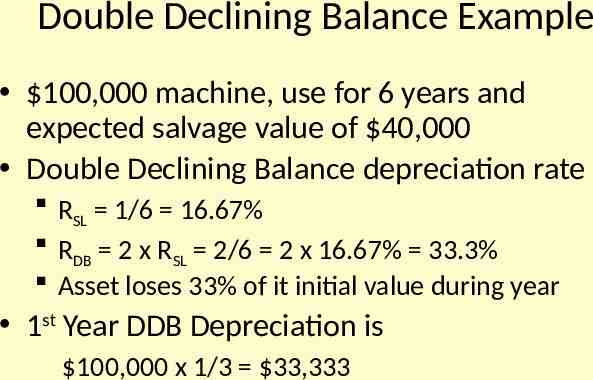
Double Declining Balance Example 100,000 machine, use for 6 years and expected salvage value of 40,000 Double Declining Balance depreciation rate RSL 1/6 16.67% RDB 2 x RSL 2/6 2 x 16.67% 33.3% Asset loses 33% of it initial value during year 1st Year DDB Depreciation is 100,000 x 1/3 33,333
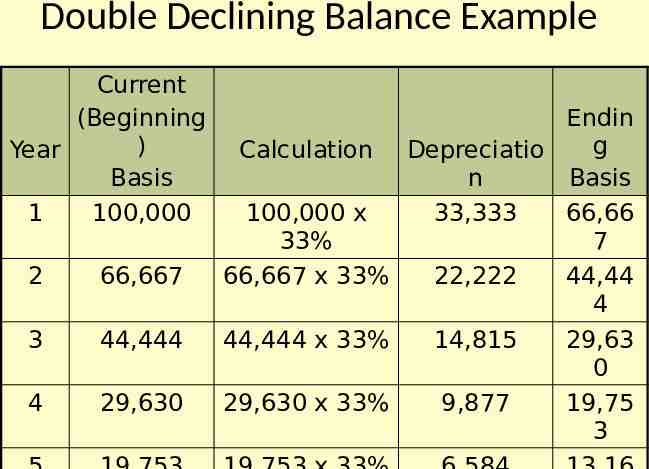
Double Declining Balance Example Current (Beginning ) Year Basis 1 100,000 2 66,667 3 44,444 4 29,630 Endin g Calculation Depreciatio n Basis 100,000 x 33,333 66,66 33% 7 66,667 x 33% 22,222 44,44 4 44,444 x 33% 14,815 29,63 0 29,630 x 33% 9,877 19,75 3
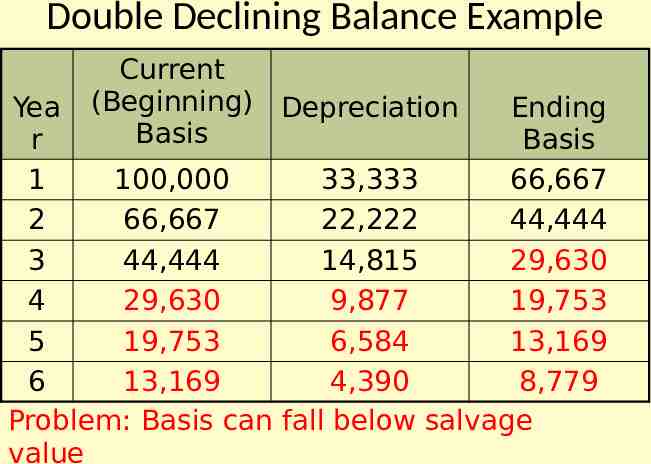
Double Declining Balance Example Current (Beginning) Depreciation Basis Yea Ending r Basis 1 100,000 33,333 66,667 2 66,667 22,222 44,444 3 44,444 14,815 29,630 4 29,630 9,877 19,753 5 19,753 6,584 13,169 6 13,169 4,390 8,779 Problem: Basis can fall below salvage value
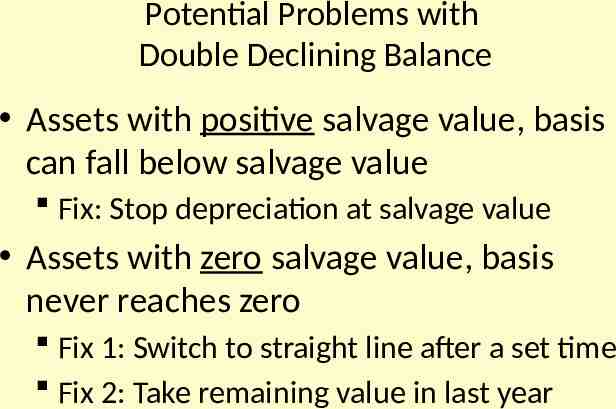
Potential Problems with Double Declining Balance Assets with positive salvage value, basis can fall below salvage value Fix: Stop depreciation at salvage value Assets with zero salvage value, basis never reaches zero Fix 1: Switch to straight line after a set time Fix 2: Take remaining value in last year
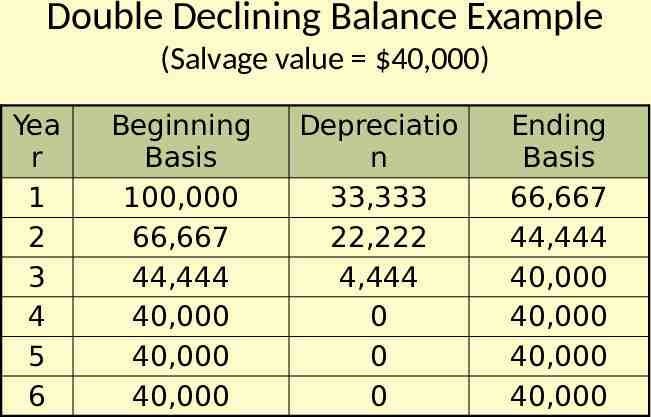
Double Declining Balance Example (Salvage value 40,000) Yea r 1 2 3 4 5 6 Beginning Basis 100,000 66,667 44,444 40,000 40,000 40,000 Depreciatio n 33,333 22,222 4,444 0 0 0 Ending Basis 66,667 44,444 40,000 40,000 40,000 40,000
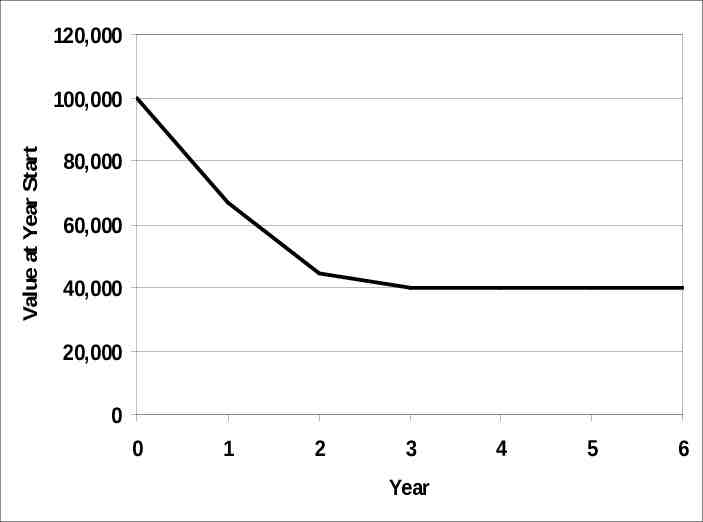
120,000 Value at Year Start 100,000 80,000 60,000 40,000 20,000 0 0 1 2 3 Year 4 5 6
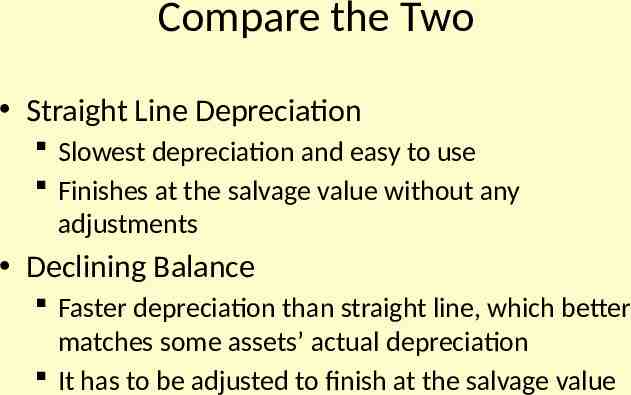
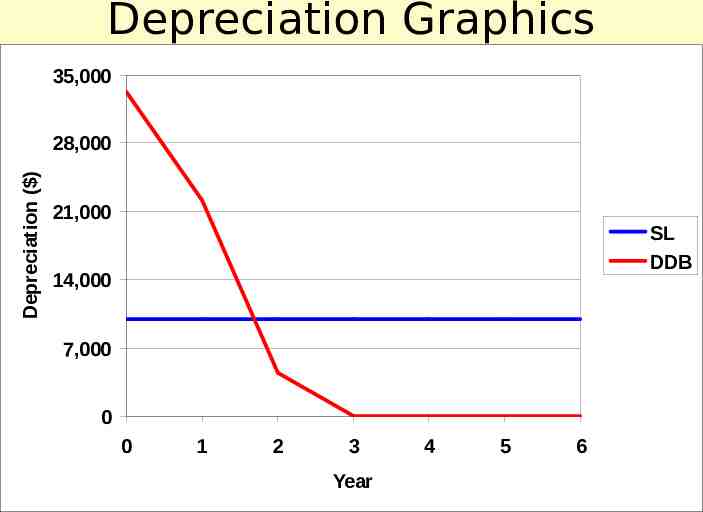
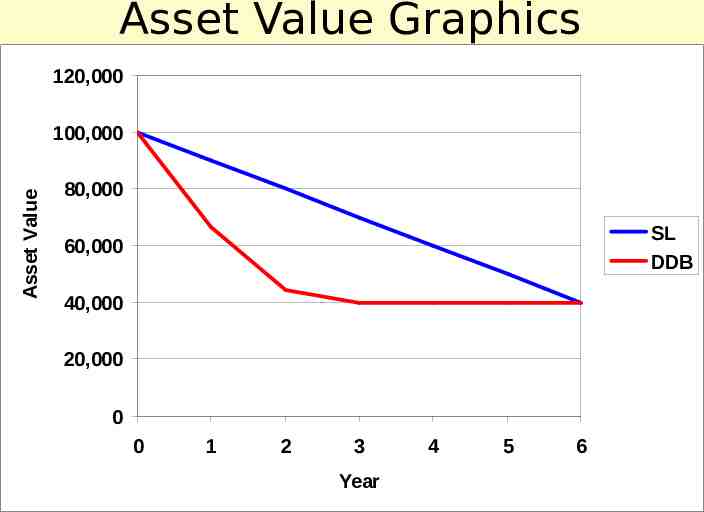
Compare the Two Straight Line Depreciation Slowest depreciation and easy to use Finishes at the salvage value without any adjustments Declining Balance Faster depreciation than straight line, which better matches some assets’ actual depreciation It has to be adjusted to finish at the salvage value
Depreciation Graphics 35,000 Depreciation ( ) 28,000 21,000 SL DDB 14,000 7,000 0 0 1 2 3 Year 4 5 6
Asset Value Graphics 120,000 Asset Value 100,000 80,000 SL DDB 60,000 40,000 20,000 0 0 1 2 3 Year 4 5 6
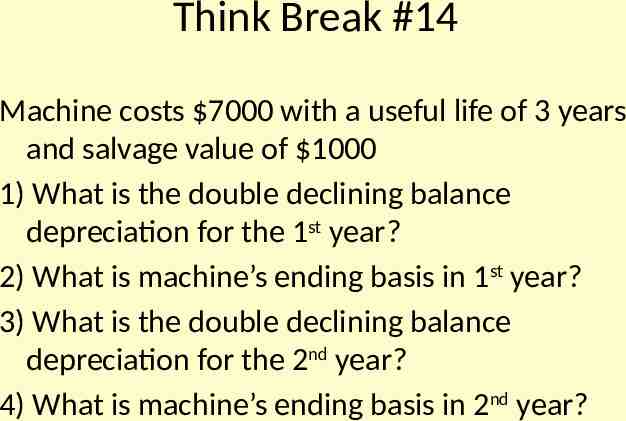
Think Break #14 Machine costs 7000 with a useful life of 3 years and salvage value of 1000 1) What is the double declining balance depreciation for the 1st year? 2) What is machine’s ending basis in 1st year? 3) What is the double declining balance depreciation for the 2nd year? 4) What is machine’s ending basis in 2nd year?
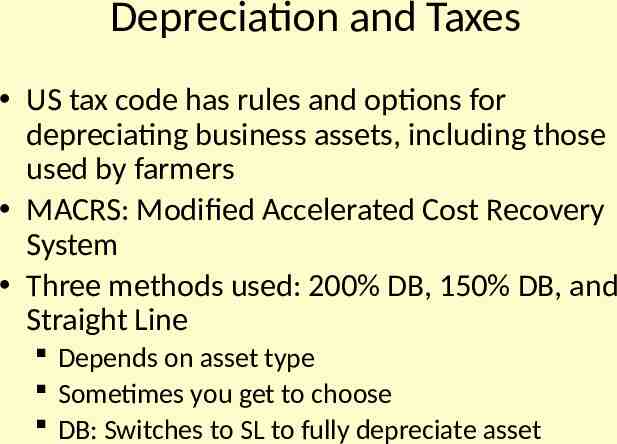
Depreciation and Taxes US tax code has rules and options for depreciating business assets, including those used by farmers MACRS: Modified Accelerated Cost Recovery System Three methods used: 200% DB, 150% DB, and Straight Line Depends on asset type Sometimes you get to choose DB: Switches to SL to fully depreciate asset
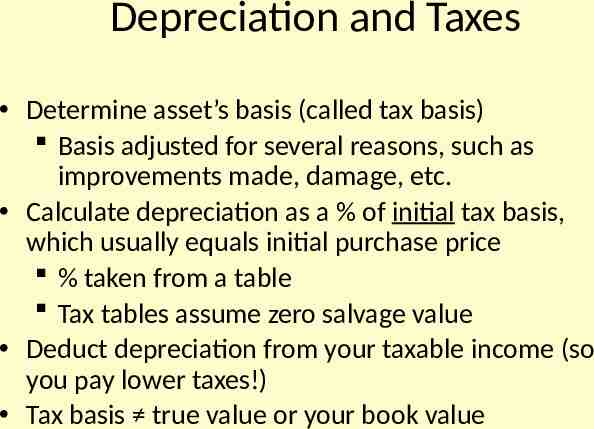
Depreciation and Taxes Determine asset’s basis (called tax basis) Basis adjusted for several reasons, such as improvements made, damage, etc. Calculate depreciation as a % of initial tax basis, which usually equals initial purchase price % taken from a table Tax tables assume zero salvage value Deduct depreciation from your taxable income (so you pay lower taxes!) Tax basis true value or your book value
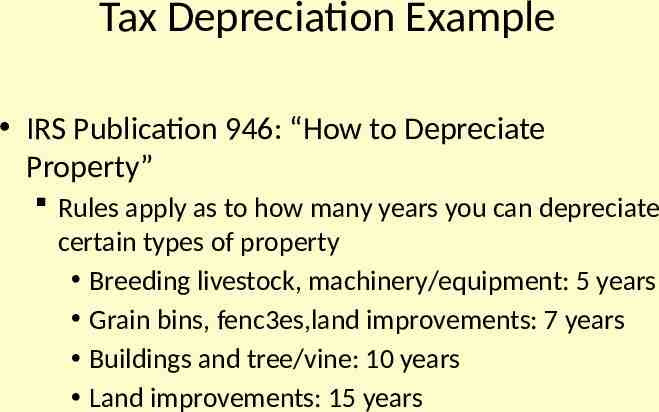
Tax Depreciation Example IRS Publication 946: “How to Depreciate Property” Rules apply as to how many years you can depreciate certain types of property Breeding livestock, machinery/equipment: 5 years Grain bins, fenc3es,land improvements: 7 years Buildings and tree/vine: 10 years Land improvements: 15 years
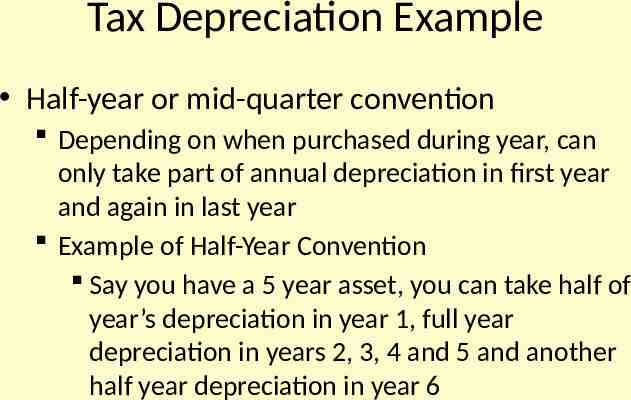
Tax Depreciation Example Half-year or mid-quarter convention Depending on when purchased during year, can only take part of annual depreciation in first year and again in last year Example of Half-Year Convention Say you have a 5 year asset, you can take half of year’s depreciation in year 1, full year depreciation in years 2, 3, 4 and 5 and another half year depreciation in year 6
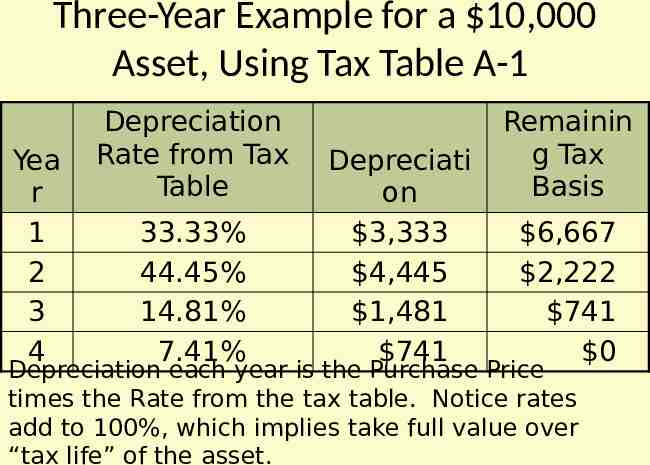
Three-Year Example for a 10,000 Asset, Using Tax Table A-1 Yea r 1 2 3 4 Depreciation Rate from Tax Table 33.33% 44.45% 14.81% 7.41% Depreciati on 3,333 4,445 1,481 741 Remainin g Tax Basis 6,667 2,222 741 0 Depreciation each year is the Purchase Price times the Rate from the tax table. Notice rates add to 100%, which implies take full value over “tax life” of the asset.
Depreciation and Taxes Section 179: Allows taking a large amount of depreciation in year purchase asset Way to really reduce income (and so taxes) Buy equipment/building and write full cost off as a cost of business in that year The ending basis of asset can be zero in first year Many farmers do this in years they make more money than usual
Depreciation and Taxes Depreciation Recapture: Form 4797 Depreciation Recapture: When sell an asset, if the sales price differs from the tax basis, file Form 4797 If sale price remaining tax basis: claim extra as ordinary income and pay income taxes If sale price remaining tax basis: claim extra depreciation and reduce ordinary income and income taxes Eventually the government gets its taxes if you “over depreciate” an asset via tax laws (e.g., Section 179)
Depreciation and Taxes Main Point: Tax depreciation not the same as “real” depreciation Section 179 depreciation really throws it off Businesses & farms: some keep separate records Tax depreciation and tax basis records Can differ between federal and state Book value for farm balance sheet for farm’s “real” value for loan applications Records of asset values for insurance purposes Can create complicated farm records
Summary Explained concept of a balance sheet Current and Non-current Assets Current and Non-current Liabilities Equity: what balances the sheet How to value assets: Cost or Market basis How to depreciate assets Straight Line or Declining Balance methods Taxes and depreciation Next Section: What do you do with a balance sheet?