Experimental Evaluation of Learning Algorithms Part 1
15 Slides133.50 KB
Experimental Evaluation of Learning Algorithms Part 1
Motivation Evaluating the performance of learning systems is important because: Learning systems are usually designed to predict the class of “future” unlabeled data points. In some cases, evaluating hypotheses is an integral part of the learning process (example, when pruning a decision tree) 2
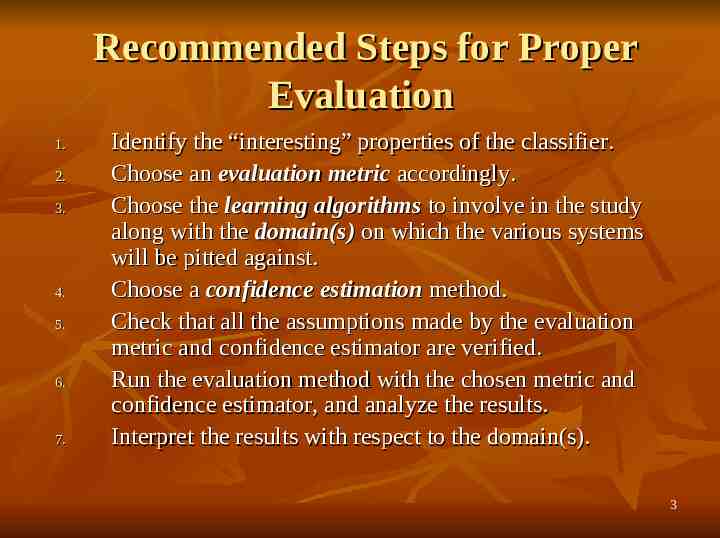
Recommended Steps for Proper Evaluation 1. 2. 3. 4. 5. 6. 7. Identify the “interesting” properties of the classifier. Choose an evaluation metric accordingly. Choose the learning algorithms to involve in the study along with the domain(s) on which the various systems will be pitted against. Choose a confidence estimation method. Check that all the assumptions made by the evaluation metric and confidence estimator are verified. Run the evaluation method with the chosen metric and confidence estimator, and analyze the results. Interpret the results with respect to the domain(s). 3
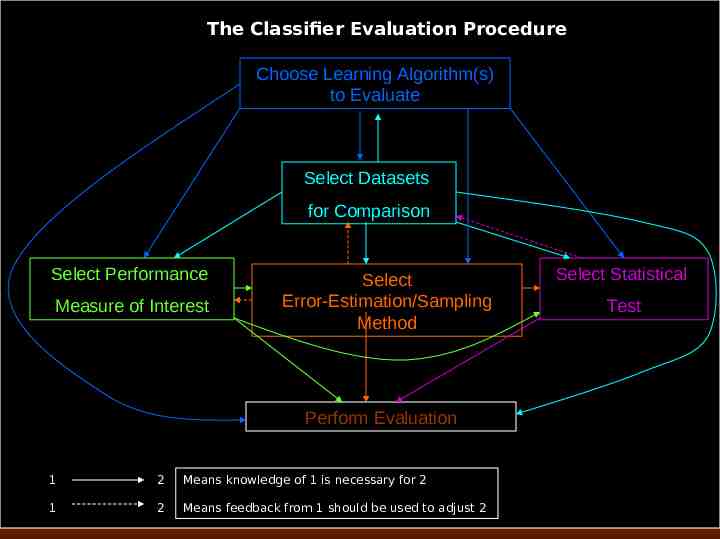
The Classifier Evaluation Procedure Choose Learning Algorithm(s) to Evaluate Select Datasets for Comparison Select Performance Measure of Interest Select Error-Estimation/Sampling Method Select Statistical Test Perform Evaluation 1 2 Means knowledge of 1 is necessary for 2 1 2 Means feedback from 1 should be used to adjust 2 4
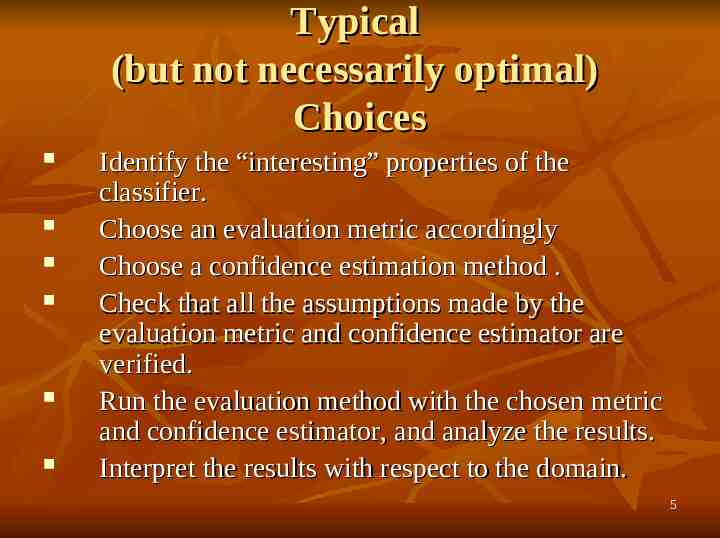
Typical (but not necessarily optimal) Choices Identify the “interesting” properties of the classifier. Choose an evaluation metric accordingly Choose a confidence estimation method . Check that all the assumptions made by the evaluation metric and confidence estimator are verified. Run the evaluation method with the chosen metric and confidence estimator, and analyze the results. Interpret the results with respect to the domain. 5
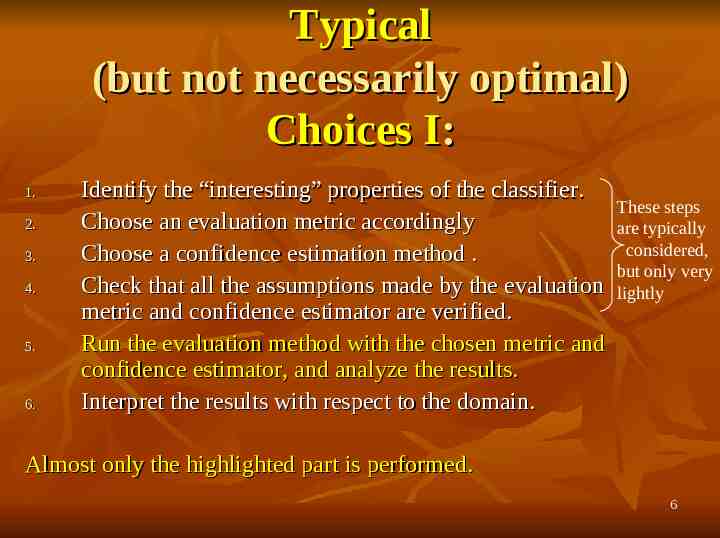
Typical (but not necessarily optimal) Choices I: 1. 2. 3. 4. 5. 6. Identify the “interesting” properties of the classifier. Choose an evaluation metric accordingly Choose a confidence estimation method . Check that all the assumptions made by the evaluation metric and confidence estimator are verified. Run the evaluation method with the chosen metric and confidence estimator, and analyze the results. Interpret the results with respect to the domain. These steps are typically considered, but only very lightly Almost only the highlighted part is performed. 6
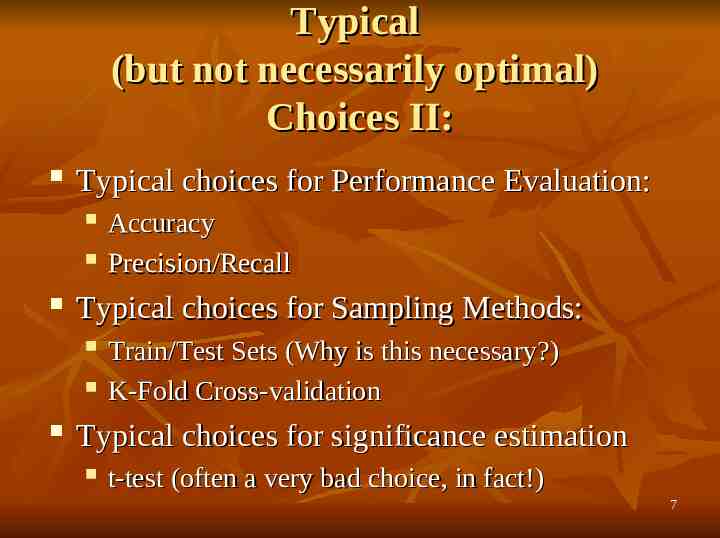
Typical (but not necessarily optimal) Choices II: Typical choices for Performance Evaluation: Typical choices for Sampling Methods: Accuracy Precision/Recall Train/Test Sets (Why is this necessary?) K-Fold Cross-validation Typical choices for significance estimation t-test (often a very bad choice, in fact!) 7
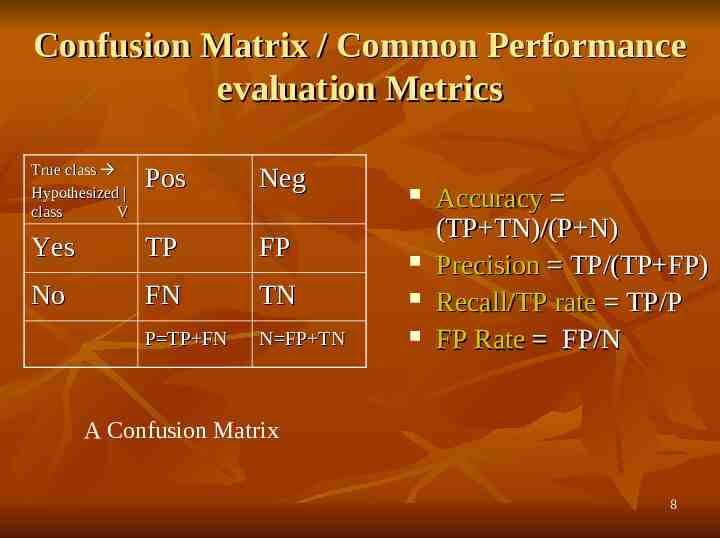
Confusion Matrix / Common Performance evaluation Metrics True class Hypothesized class V Pos Neg Yes TP FP No FN TN P TP FN N FP TN Accuracy (TP TN)/(P N) Precision TP/(TP FP) Recall/TP rate TP/P FP Rate FP/N A Confusion Matrix 8
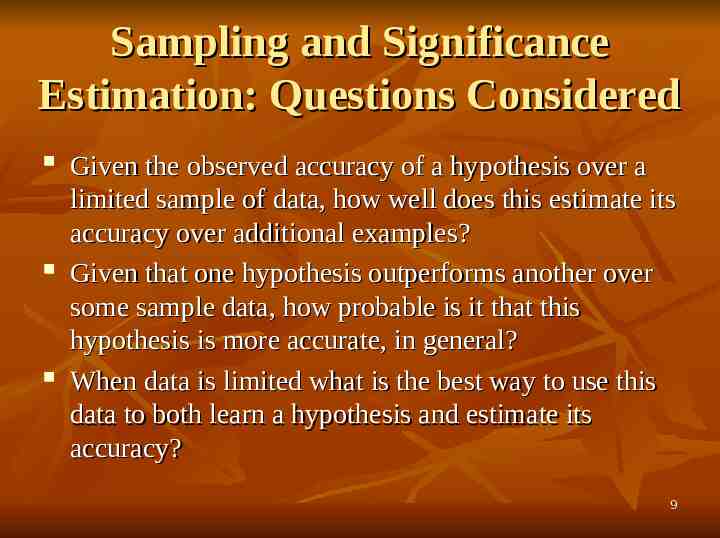
Sampling and Significance Estimation: Questions Considered Given the observed accuracy of a hypothesis over a limited sample of data, how well does this estimate its accuracy over additional examples? Given that one hypothesis outperforms another over some sample data, how probable is it that this hypothesis is more accurate, in general? When data is limited what is the best way to use this data to both learn a hypothesis and estimate its accuracy? 9
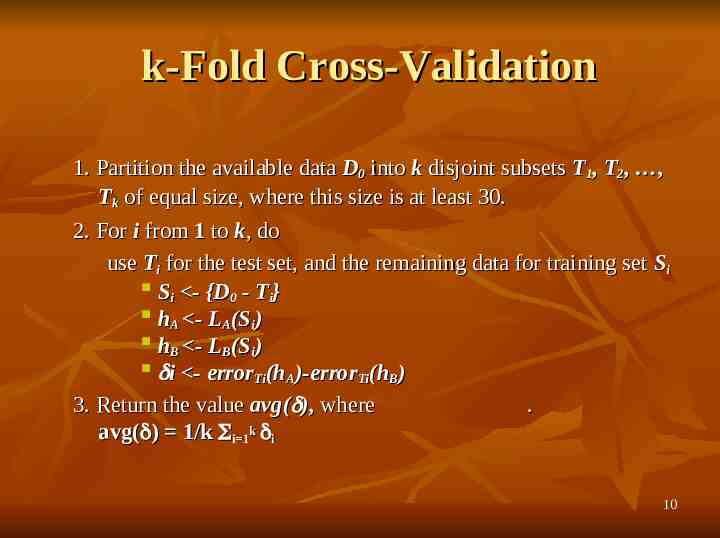
k-Fold Cross-Validation 1. Partition the available data D0 into k disjoint subsets T1, T2, , Tk of equal size, where this size is at least 30. 2. For i from 1 to k, do use Ti for the test set, and the remaining data for training set Si Si - {D0 - Ti} hA - LA(Si) hB - LB(Si) i - error (h )-error (h ) Ti A Ti B 3. Return the value avg( ), where . avg( ) 1/k i 1k i 10
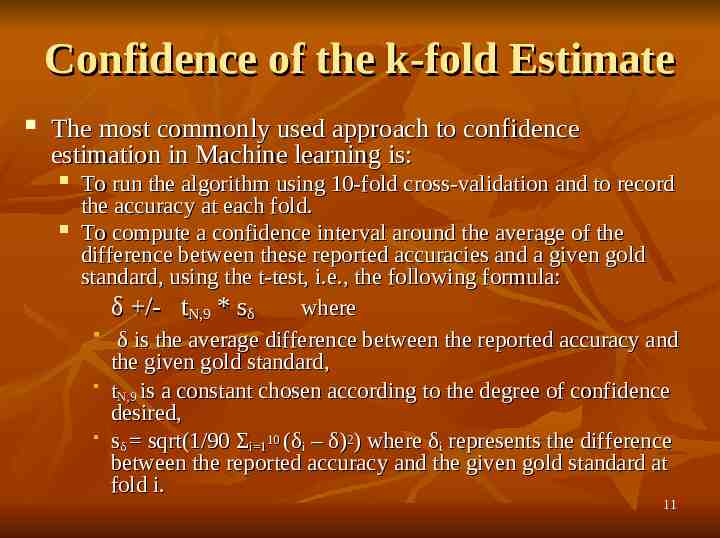
Confidence of the k-fold Estimate The most commonly used approach to confidence estimation in Machine learning is: To run the algorithm using 10-fold cross-validation and to record the accuracy at each fold. To compute a confidence interval around the average of the difference between these reported accuracies and a given gold standard, using the t-test, i.e., the following formula: δ /- tN,9 * sδ where δ is the average difference between the reported accuracy and the given gold standard, t N,9 is a constant chosen according to the degree of confidence desired, s sqrt(1/90 Σ 10 (δ – δ)2) where δ represents the difference δ i 1 i i between the reported accuracy and the given gold standard at fold i. 11
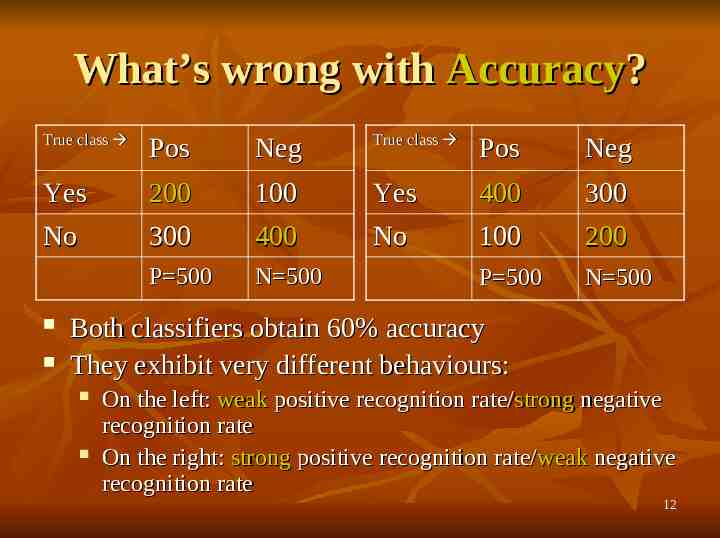
What’s wrong with Accuracy? True class Pos Neg True class Pos Neg Yes No 200 300 100 400 Yes No 400 100 300 200 P 500 N 500 P 500 N 500 Both classifiers obtain 60% accuracy They exhibit very different behaviours: On the left: weak positive recognition rate/strong negative recognition rate On the right: strong positive recognition rate/weak negative recognition rate 12
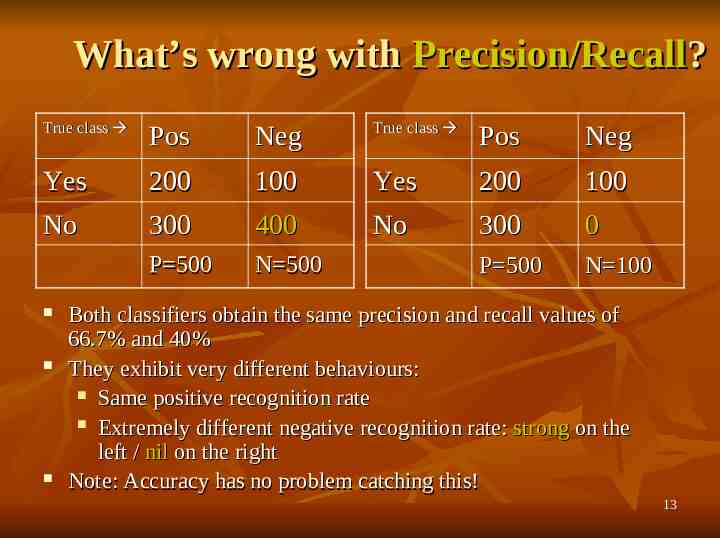
What’s wrong with Precision/Recall? True class Pos Neg True class Pos Neg Yes No 200 300 100 400 Yes No 200 300 100 0 P 500 N 500 P 500 N 100 Both classifiers obtain the same precision and recall values of 66.7% and 40% They exhibit very different behaviours: Same positive recognition rate Extremely different negative recognition rate: strong on the left / nil on the right Note: Accuracy has no problem catching this! 13
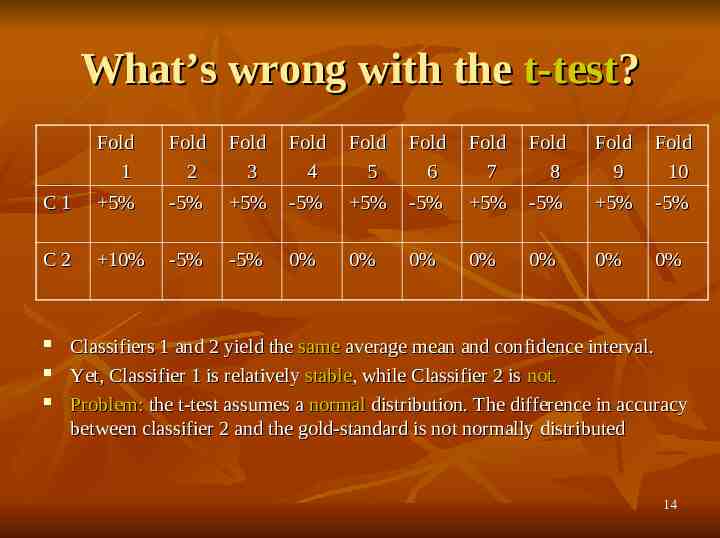
What’s wrong with the t-test? Fold 1 Fold 2 Fold 3 Fold 4 Fold 5 Fold 6 Fold 7 Fold 8 Fold 9 Fold 10 C1 5% -5% 5% -5% 5% -5% 5% -5% 5% -5% C2 10% -5% -5% 0% 0% 0% 0% 0% 0% 0% Classifiers 1 and 2 yield the same average mean and confidence interval. Yet, Classifier 1 is relatively stable, while Classifier 2 is not. Problem: the t-test assumes a normal distribution. The difference in accuracy between classifier 2 and the gold-standard is not normally distributed 14
So what can be done? Think about evaluation carefully prior to starting your experiments. Use performance measures other than accuracy and precision recall. E.g., ROC Analysis, combinations of measures. Also, think about the best measure for your problem. Use re-sampling methods other than cross-validation, when necessary: bootstrapping? Randomization? Use statistical tests other than the t-test: non-parametric tests; tests appropriate for many classifiers compared on many domains (the t-test is not appropriate for this case, which is the most common one). We will try to discuss some of these issues next time. 15