DRAM Evaluation Plan & Metrics Workshop Cathy Fogel & Bruce


23 Slides1.03 MB
DRAM Evaluation Plan & Metrics Workshop Cathy Fogel & Bruce Kaneshiro Demand Response Section California Public Utilities Commission March 1, 2017 1
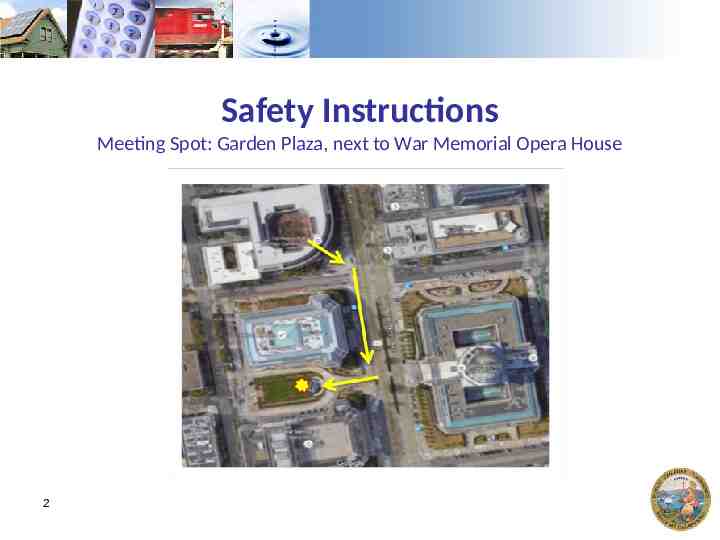
Safety Instructions Meeting Spot: Garden Plaza, next to War Memorial Opera House 2
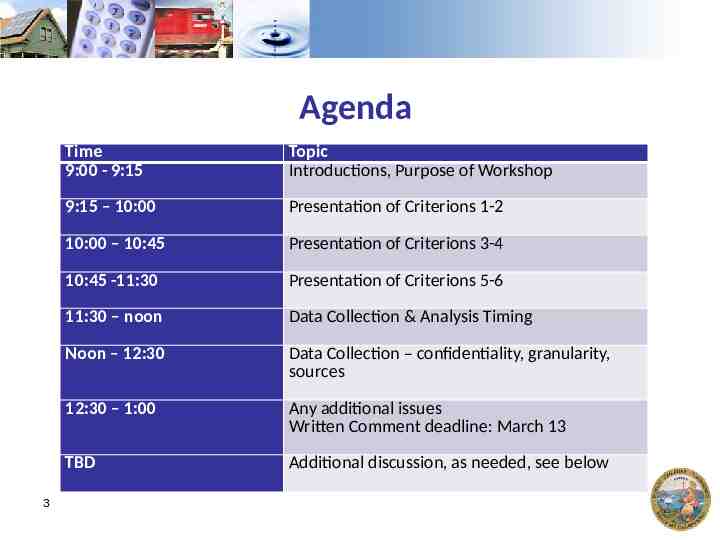
Agenda 3 Time 9:00 - 9:15 Topic Introductions, Purpose of Workshop 9:15 – 10:00 Presentation of Criterions 1-2 10:00 – 10:45 Presentation of Criterions 3-4 10:45 -11:30 Presentation of Criterions 5-6 11:30 – noon Data Collection & Analysis Timing Noon – 12:30 Data Collection – confidentiality, granularity, sources 12:30 – 1:00 Any additional issues Written Comment deadline: March 13 TBD Additional discussion, as needed, see below
Introduction Goal 1: Research the full DRAM I and DRAM II pilots and the solicitation phase of DRAM III Goal 2: Provide recommendations based on the research and analysis to guide the Commission in determining if the auction mechanism pilots may be deemed successful 4
Project Objectives Objective 1: Assess the DRAM pilots based on the Commission’s adopted criteria for determining its success Objective 2: Explore these criteria using metrics based on input from Parties to R.13-09-011 Objective 3: Provide data and factual analysis to guide recommendations Objective 4: Undertake a balanced analysis based on input from the range of market, utility and regulatory actors 5
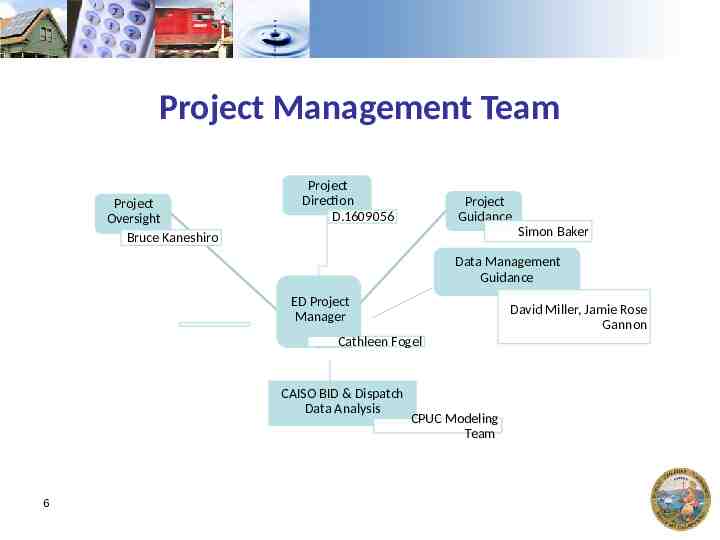
Project Management Team Project Oversight Bruce Kaneshiro Non-financially interested ies Project Direction D.1609056 Project Guidance Simon Baker Data Management Guidance ED Project Manager David Miller, Jamie Rose Gannon Cathleen Fogel CAISO BID & Dispatch Data Analysis 6 CPUC Modeling Team
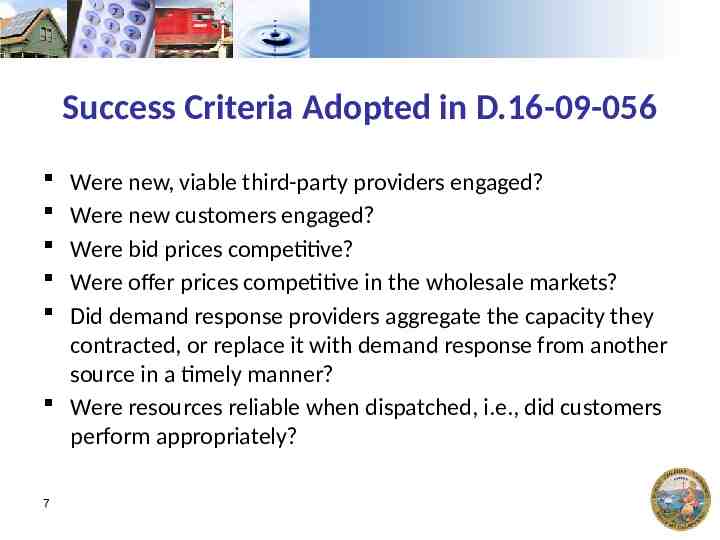
Success Criteria Adopted in D.16-09-056 Were new, viable third-party providers engaged? Were new customers engaged? Were bid prices competitive? Were offer prices competitive in the wholesale markets? Did demand response providers aggregate the capacity they contracted, or replace it with demand response from another source in a timely manner? Were resources reliable when dispatched, i.e., did customers perform appropriately? 7
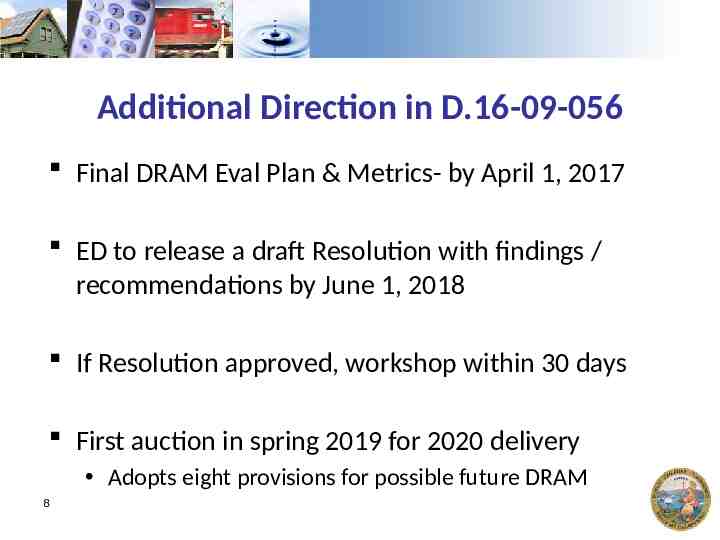
Additional Direction in D.16-09-056 Final DRAM Eval Plan & Metrics- by April 1, 2017 ED to release a draft Resolution with findings / recommendations by June 1, 2018 If Resolution approved, workshop within 30 days First auction in spring 2019 for 2020 delivery Adopts eight provisions for possible future DRAM 8
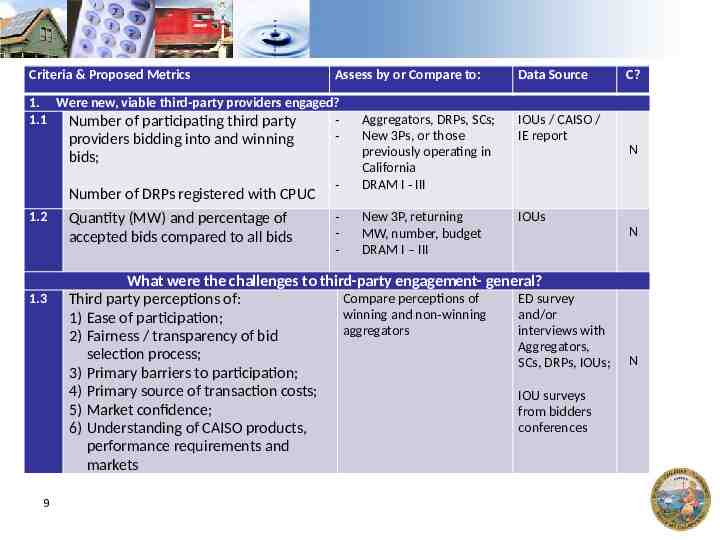
Criteria & Proposed Metrics Assess by or Compare to: 1. Were new, viable third-party providers engaged? 1.1 Number of participating third party providers bidding into and winning IOUs / CAISO / IE report - Aggregators, DRPs, SCs; New 3Ps, or those previously operating in California DRAM I - III - New 3P, returning MW, number, budget DRAM I – III IOUs bids; Number of DRPs registered with CPUC 1.2 1.3 9 Quantity (MW) and percentage of accepted bids compared to all bids Data Source C? N What were the challenges to third-party engagement- general? Compare perceptions of ED survey Third party perceptions of: winning and non-winning and/or 1) Ease of participation; aggregators interviews with 2) Fairness / transparency of bid Aggregators, selection process; SCs, DRPs, IOUs; 3) Primary barriers to participation; 4) Primary source of transaction costs; IOU surveys 5) Market confidence; from bidders conferences 6) Understanding of CAISO products, performance requirements and markets N N
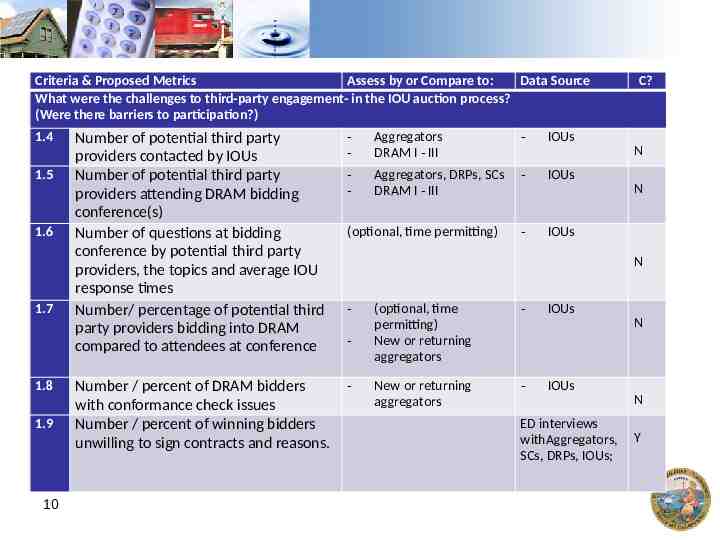
Criteria & Proposed Metrics Assess by or Compare to: Data Source What were the challenges to third-party engagement- in the IOU auction process? (Were there barriers to participation?) 1.4 1.5 1.6 1.7 1.8 1.9 10 Number of potential third party providers contacted by IOUs Number of potential third party providers attending DRAM bidding conference(s) Number of questions at bidding conference by potential third party providers, the topics and average IOU response times Number/ percentage of potential third party providers bidding into DRAM compared to attendees at conference - Aggregators DRAM I - III - - Aggregators, DRPs, SCs DRAM I - III - Number / percent of DRAM bidders with conformance check issues Number / percent of winning bidders unwilling to sign contracts and reasons. - (optional, time permitting) IOUs C? N IOUs N - IOUs N - (optional, time permitting) New or returning aggregators - New or returning aggregators - IOUs N IOUs N ED interviews withAggregators, SCs, DRPs, IOUs; Y
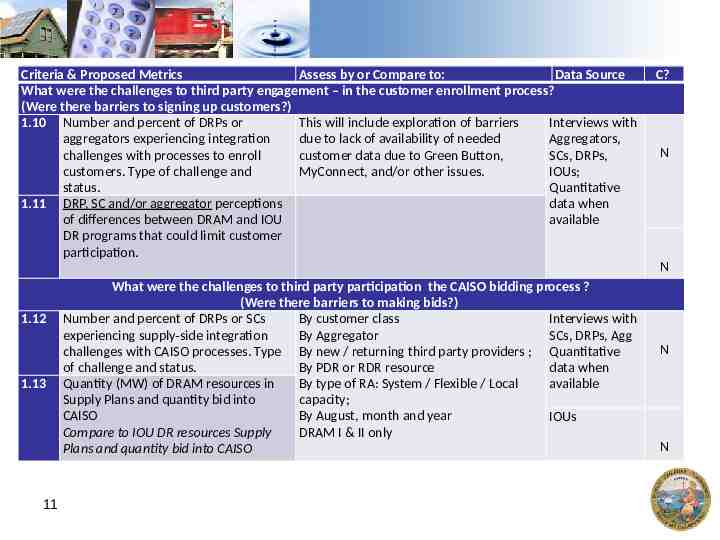
Criteria & Proposed Metrics Assess by or Compare to: Data Source What were the challenges to third party engagement – in the customer enrollment process? (Were there barriers to signing up customers?) 1.10 Number and percent of DRPs or This will include exploration of barriers Interviews with aggregators experiencing integration due to lack of availability of needed Aggregators, challenges with processes to enroll customer data due to Green Button, SCs, DRPs, customers. Type of challenge and MyConnect, and/or other issues. IOUs; status. Quantitative 1.11 DRP, SC and/or aggregator perceptions data when available of differences between DRAM and IOU DR programs that could limit customer participation. C? N N 1.12 1.13 11 What were the challenges to third party participation the CAISO bidding process ? (Were there barriers to making bids?) Number and percent of DRPs or SCs By customer class Interviews with experiencing supply-side integration By Aggregator SCs, DRPs, Agg challenges with CAISO processes. Type By new / returning third party providers ; Quantitative of challenge and status. By PDR or RDR resource data when Quantity (MW) of DRAM resources in By type of RA: System / Flexible / Local available Supply Plans and quantity bid into capacity; CAISO By August, month and year IOUs Compare to IOU DR resources Supply DRAM I & II only Plans and quantity bid into CAISO N N
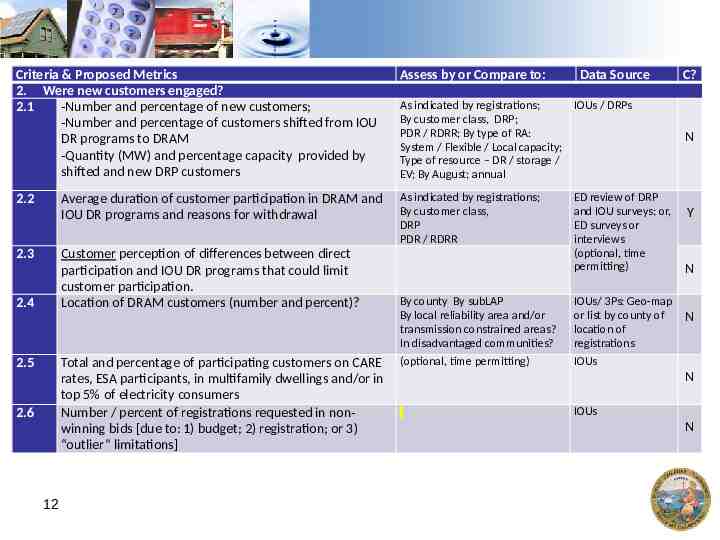
Criteria & Proposed Metrics 2. Were new customers engaged? 2.1 -Number and percentage of new customers; -Number and percentage of customers shifted from IOU DR programs to DRAM -Quantity (MW) and percentage capacity provided by shifted and new DRP customers Assess by or Compare to: As indicated by registrations; IOUs / DRPs By customer class, DRP; PDR / RDRR; By type of RA: System / Flexible / Local capacity; Type of resource – DR / storage / EV; By August; annual N 2.2 As indicated by registrations; By customer class, DRP PDR / RDRR Y Average duration of customer participation in DRAM and IOU DR programs and reasons for withdrawal 2.3 Customer perception of differences between direct participation and IOU DR programs that could limit customer participation. Location of DRAM customers (number and percent)? 2.4 2.5 Total and percentage of participating customers on CARE rates, ESA participants, in multifamily dwellings and/or in top 5% of electricity consumers Number / percent of registrations requested in nonwinning bids [due to: 1) budget; 2) registration; or 3) “outlier” limitations] 2.6 12 Data Source ED review of DRP and IOU surveys; or, ED surveys or interviews (optional, time permitting) By county By subLAP By local reliability area and/or transmission constrained areas? In disadvantaged communities? IOUs/ 3Ps: Geo-map or list by county of location of registrations (optional, time permitting) IOUs C? N N N IOUs N
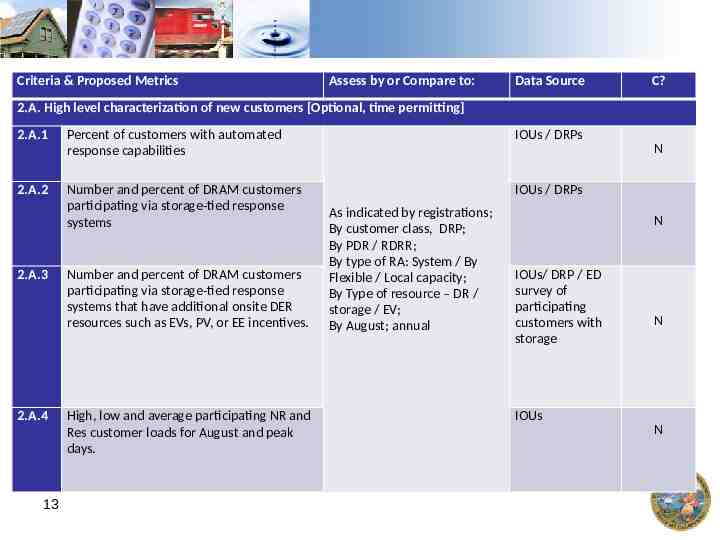
Criteria & Proposed Metrics Assess by or Compare to: Data Source C? 2.A. High level characterization of new customers [Optional, time permitting] 2.A.1 2.A.2 2.A.3 2.A.4 13 Percent of customers with automated response capabilities IOUs / DRPs Number and percent of DRAM customers participating via storage-tied response systems IOUs / DRPs Number and percent of DRAM customers participating via storage-tied response systems that have additional onsite DER resources such as EVs, PV, or EE incentives. High, low and average participating NR and Res customer loads for August and peak days. N As indicated by registrations; By customer class, DRP; By PDR / RDRR; By type of RA: System / By Flexible / Local capacity; By Type of resource – DR / storage / EV; By August; annual N IOUs/ DRP / ED survey of participating customers with storage N IOUs N
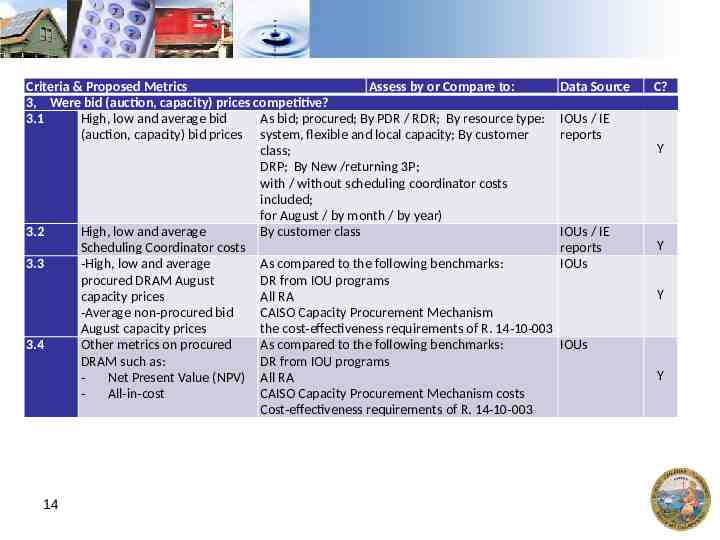
Criteria & Proposed Metrics Assess by or Compare to: 3, Were bid (auction, capacity) prices competitive? 3.1 High, low and average bid As bid; procured; By PDR / RDR; By resource type: (auction, capacity) bid prices system, flexible and local capacity; By customer class; DRP; By New /returning 3P; with / without scheduling coordinator costs included; for August / by month / by year) 3.2 High, low and average By customer class Scheduling Coordinator costs 3.3 -High, low and average As compared to the following benchmarks: procured DRAM August DR from IOU programs capacity prices All RA -Average non-procured bid CAISO Capacity Procurement Mechanism August capacity prices the cost-effectiveness requirements of R. 14-10-003 3.4 Other metrics on procured As compared to the following benchmarks: DRAM such as: DR from IOU programs Net Present Value (NPV) All RA All-in-cost CAISO Capacity Procurement Mechanism costs Cost-effectiveness requirements of R. 14-10-003 14 Data Source C? IOUs / IE reports Y IOUs / IE reports IOUs Y Y IOUs Y
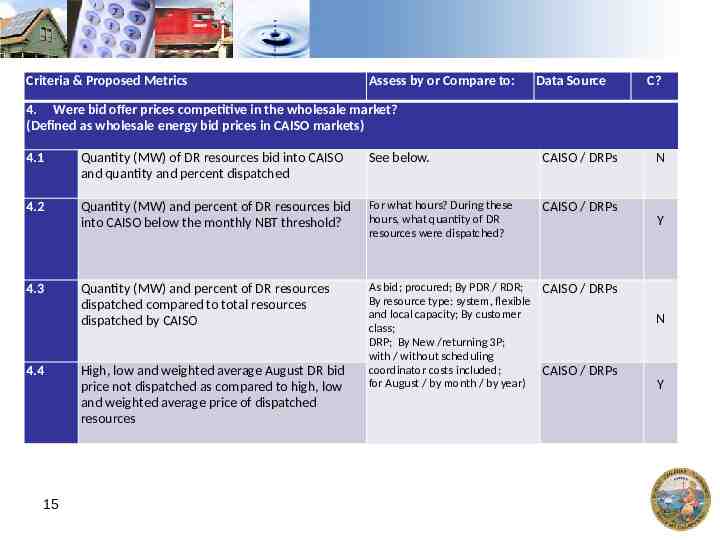
Criteria & Proposed Metrics Assess by or Compare to: Data Source C? 4. Were bid offer prices competitive in the wholesale market? (Defined as wholesale energy bid prices in CAISO markets) 4.1 Quantity (MW) of DR resources bid into CAISO and quantity and percent dispatched See below. CAISO / DRPs 4.2 Quantity (MW) and percent of DR resources bid into CAISO below the monthly NBT threshold? For what hours? During these hours, what quantity of DR resources were dispatched? CAISO / DRPs Quantity (MW) and percent of DR resources dispatched compared to total resources dispatched by CAISO As bid; procured; By PDR / RDR; CAISO / DRPs By resource type: system, flexible and local capacity; By customer class; DRP; By New /returning 3P; with / without scheduling coordinator costs included; CAISO / DRPs for August / by month / by year) 4.3 4.4 15 High, low and weighted average August DR bid price not dispatched as compared to high, low and weighted average price of dispatched resources N Y N Y
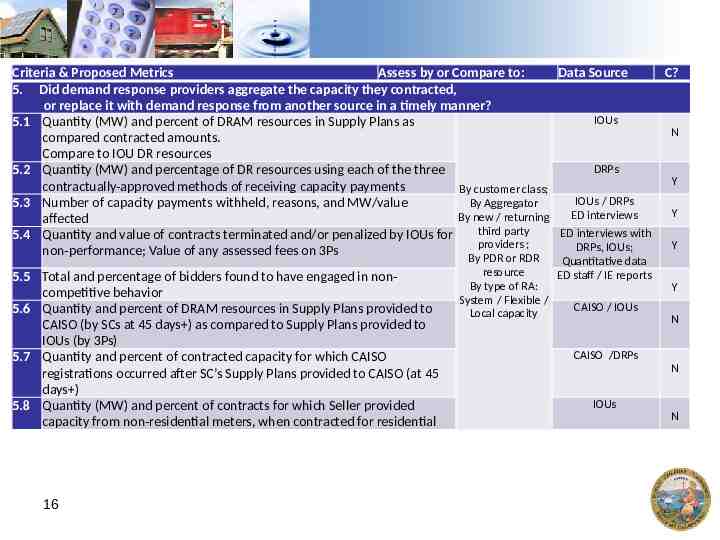
Criteria & Proposed Metrics Assess by or Compare to: Data Source C? 5. Did demand response providers aggregate the capacity they contracted, or replace it with demand response from another source in a timely manner? IOUs 5.1 Quantity (MW) and percent of DRAM resources in Supply Plans as N compared contracted amounts. Compare to IOU DR resources DRPs 5.2 Quantity (MW) and percentage of DR resources using each of the three Y contractually-approved methods of receiving capacity payments By customer class; IOUs / DRPs 5.3 Number of capacity payments withheld, reasons, and MW/value By Aggregator Y ED interviews By new / returning affected third party ED interviews with 5.4 Quantity and value of contracts terminated and/or penalized by IOUs for providers ; Y DRPs, IOUs; non-performance; Value of any assessed fees on 3Ps By PDR or RDR 5.5 Total and percentage of bidders found to have engaged in noncompetitive behavior 5.6 Quantity and percent of DRAM resources in Supply Plans provided to CAISO (by SCs at 45 days ) as compared to Supply Plans provided to IOUs (by 3Ps) 5.7 Quantity and percent of contracted capacity for which CAISO registrations occurred after SC’s Supply Plans provided to CAISO (at 45 days ) 5.8 Quantity (MW) and percent of contracts for which Seller provided capacity from non-residential meters, when contracted for residential 16 Quantitative data resource ED staff / IE reports By type of RA: System / Flexible / CAISO / IOUs Local capacity Y N CAISO /DRPs N IOUs N
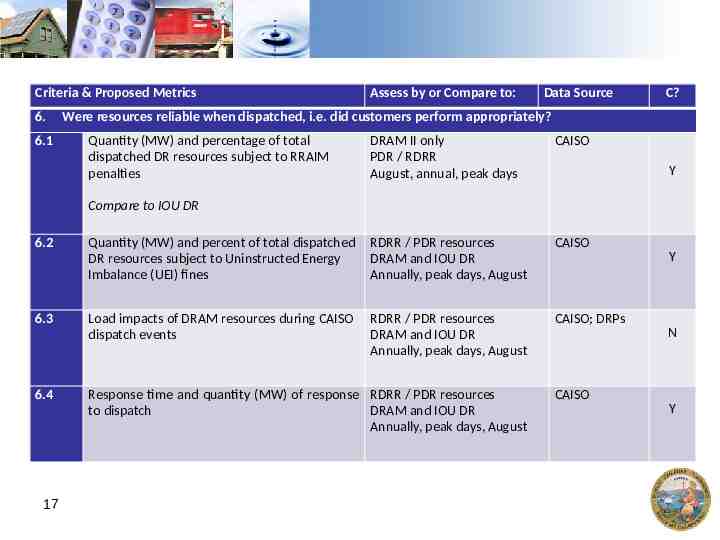
Criteria & Proposed Metrics 6. 6.1 Assess by or Compare to: Data Source C? Were resources reliable when dispatched, i.e. did customers perform appropriately? Quantity (MW) and percentage of total dispatched DR resources subject to RRAIM penalties DRAM II only PDR / RDRR August, annual, peak days CAISO Quantity (MW) and percent of total dispatched DR resources subject to Uninstructed Energy Imbalance (UEI) fines RDRR / PDR resources DRAM and IOU DR Annually, peak days, August CAISO Load impacts of DRAM resources during CAISO dispatch events RDRR / PDR resources DRAM and IOU DR Annually, peak days, August CAISO; DRPs Y Compare to IOU DR 6.2 6.3 6.4 17 Response time and quantity (MW) of response RDRR / PDR resources to dispatch DRAM and IOU DR Annually, peak days, August Y N CAISO Y
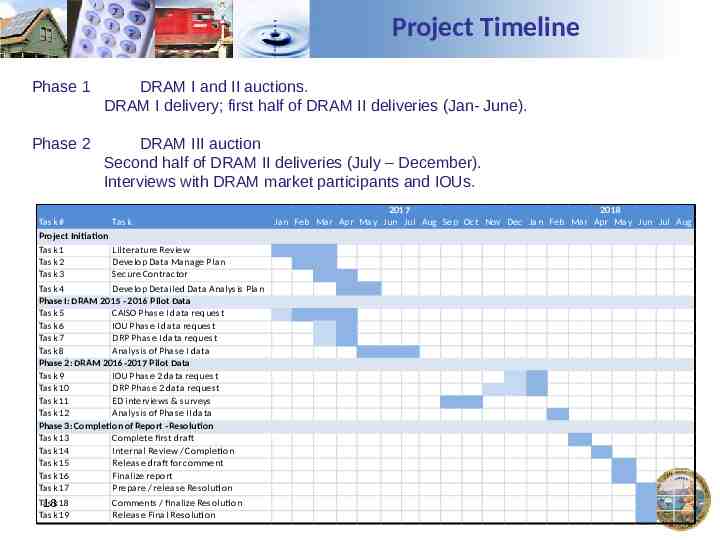
Project Timeline Phase 1 DRAM I and II auctions. DRAM I delivery; first half of DRAM II deliveries (Jan- June). Phase 2 DRAM III auction Second half of DRAM II deliveries (July – December). Interviews with DRAM market participants and IOUs. Task # Task Project Initiation Task 1 Lilterature Review Task 2 Develop Data Manage Plan Task 3 Secure Contractor Task 4 Develop Detailed Data Analysis Plan Phase I: DRAM 2015 - 2016 Pilot Data Task 5 CAISO Phase I data request Task 6 IOU Phase I data request Task 7 DRP Phase I data request Task 8 Analysis of Phase I data Phase 2: DRAM 2016-2017 Pilot Data Task 9 IOU Phase 2 data request Task 10 DRP Phase 2 data request Task 11 ED interviews & surveys Task 12 Analysis of Phase II data Phase 3: Completion of Report - Resolution Task 13 Complete first draft Task 14 Internal Review / Completion Task 15 Release draft for comment Task 16 Finalize report Task 17 Prepare / release Resolution Task 18 18 Task 19 Comments / finalize Resolution Release Final Resolution 2017 2018 Jan Feb Mar Apr May Jun Jul Aug Sep Oct Nov Dec Jan Feb Mar Apr May Jun Jul Aug
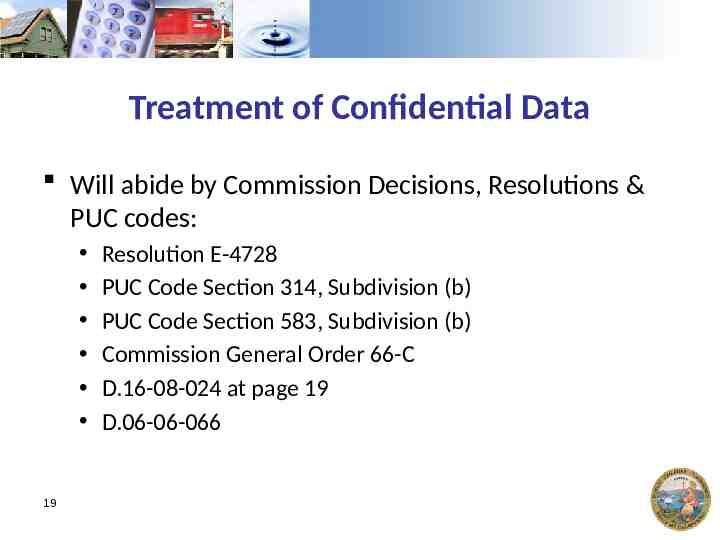
Treatment of Confidential Data Will abide by Commission Decisions, Resolutions & PUC codes: 19 Resolution E-4728 PUC Code Section 314, Subdivision (b) PUC Code Section 583, Subdivision (b) Commission General Order 66-C D.16-08-024 at page 19 D.06-06-066
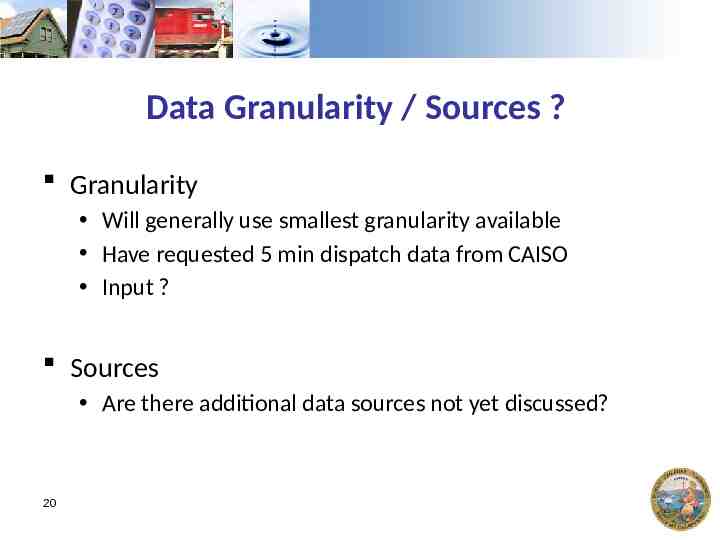
Data Granularity / Sources ? Granularity Will generally use smallest granularity available Have requested 5 min dispatch data from CAISO Input ? Sources Are there additional data sources not yet discussed? 20
Any Additional Questions / Comments? Deadline for written comments March 13 Please send your comments to [email protected] and copy the Service List of R.13-09-011 Request comments not exceed five pages, double spaced. Some questions for comment are in Appendix A of the draft Plan (and next slide) Energy Division will release a final DRAM Evaluation 21 Plan & Metrics by April 1, 2017.
Specific Questions for Comment (not required) Are the goals & objectives complete? Concerns / suggestions about handling and/or presentation of confidential data? Missing metrics? Data source / granularity suggestions? Can your organization provide data not mentioned? What metrics are the most important to demonstrate the success of the DRAM? What ones do you see as least important or fully optional? Overall project and/or individual phase timeline? Additional comments. 22
23