Healthy Communities: What Local Governments Can Do To Reduce and


74 Slides8.46 MB
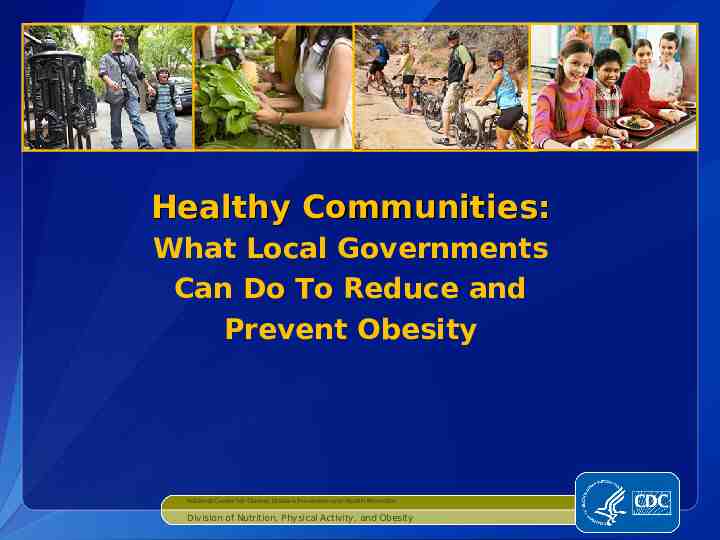
Healthy Communities: What Local Governments Can Do To Reduce and Prevent Obesity National Center for Chronic Disease Prevention and Health Promotion Division of Nutrition, Physical Activity, and Obesity
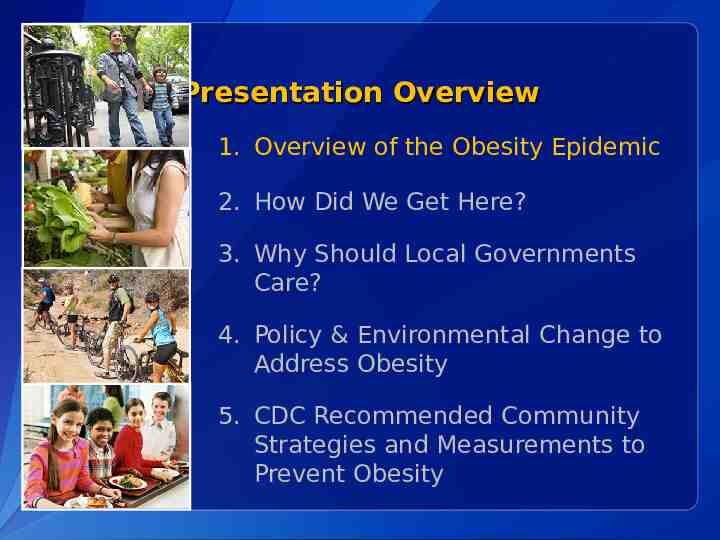
Presentation Overview 1. Overview of the Obesity Epidemic 2. How Did We Get Here? 3. Why Should Local Governments Care? 4. Policy & Environmental Change to Address Obesity 5. CDC Recommended Community Strategies and Measurements to Prevent Obesity
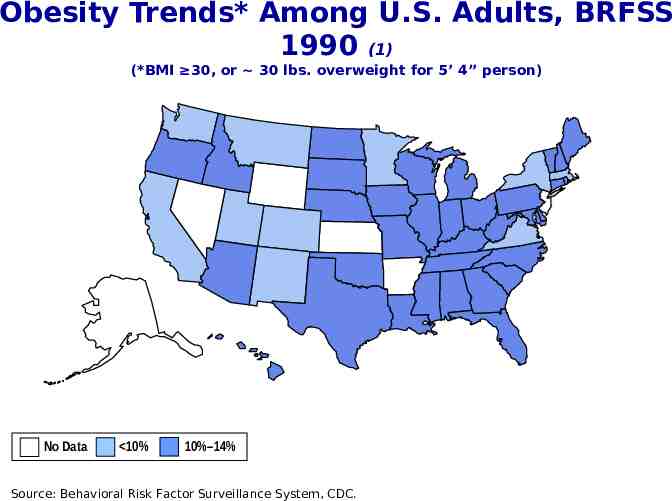
Obesity Trends* Among U.S. Adults, BRFSS 1990 (1) (*BMI 30, or 30 lbs. overweight for 5’ 4” person) No Data 10% 10%–14% Source: Behavioral Risk Factor Surveillance System, CDC.
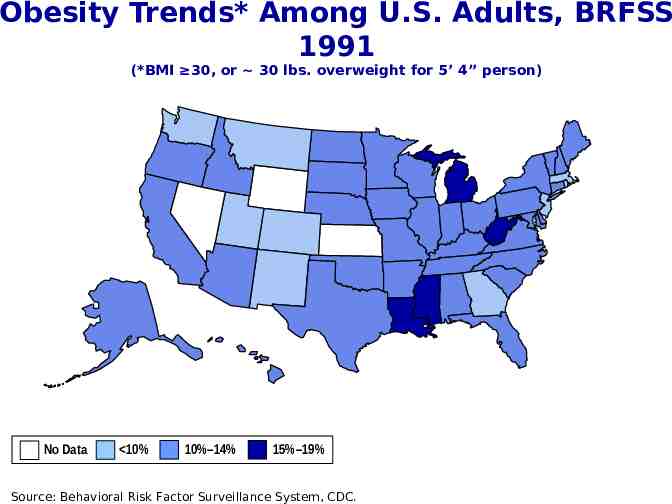
Obesity Trends* Among U.S. Adults, BRFSS 1991 (*BMI 30, or 30 lbs. overweight for 5’ 4” person) No Data 10% 10%–14% 15%–19% Source: Behavioral Risk Factor Surveillance System, CDC.
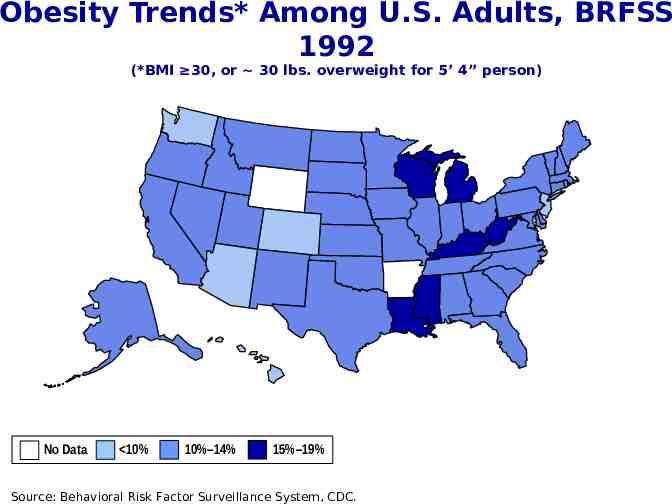
Obesity Trends* Among U.S. Adults, BRFSS 1992 (*BMI 30, or 30 lbs. overweight for 5’ 4” person) No Data 10% 10%–14% 15%–19% Source: Behavioral Risk Factor Surveillance System, CDC.
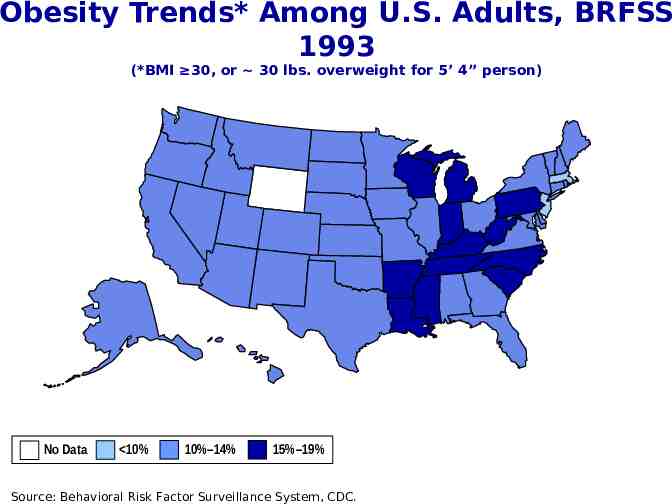
Obesity Trends* Among U.S. Adults, BRFSS 1993 (*BMI 30, or 30 lbs. overweight for 5’ 4” person) No Data 10% 10%–14% 15%–19% Source: Behavioral Risk Factor Surveillance System, CDC.
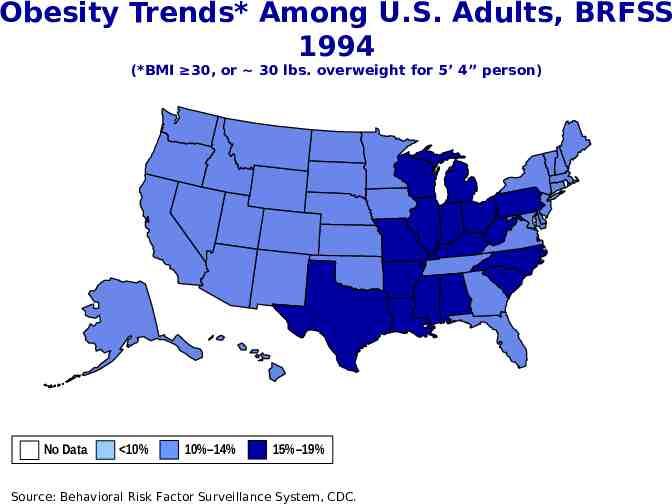
Obesity Trends* Among U.S. Adults, BRFSS 1994 (*BMI 30, or 30 lbs. overweight for 5’ 4” person) No Data 10% 10%–14% 15%–19% Source: Behavioral Risk Factor Surveillance System, CDC.
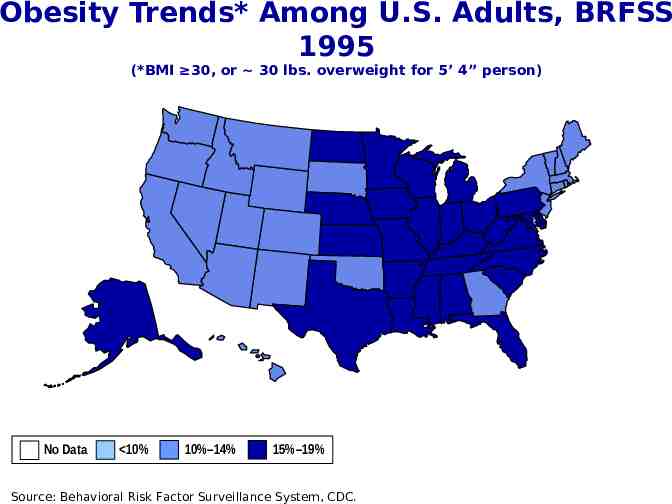
Obesity Trends* Among U.S. Adults, BRFSS 1995 (*BMI 30, or 30 lbs. overweight for 5’ 4” person) No Data 10% 10%–14% 15%–19% Source: Behavioral Risk Factor Surveillance System, CDC.
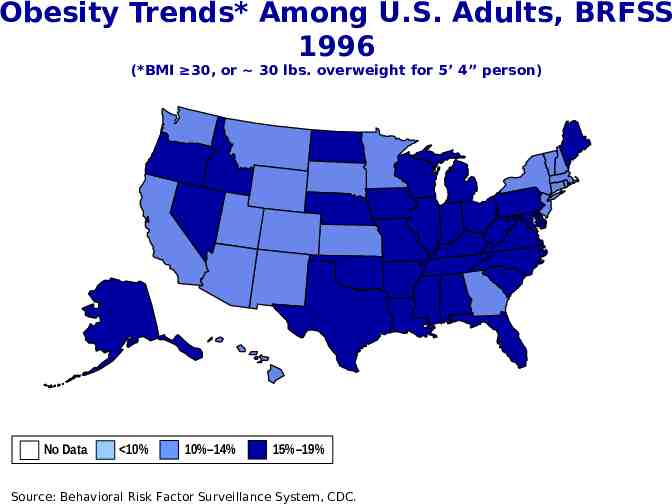
Obesity Trends* Among U.S. Adults, BRFSS 1996 (*BMI 30, or 30 lbs. overweight for 5’ 4” person) No Data 10% 10%–14% 15%–19% Source: Behavioral Risk Factor Surveillance System, CDC.
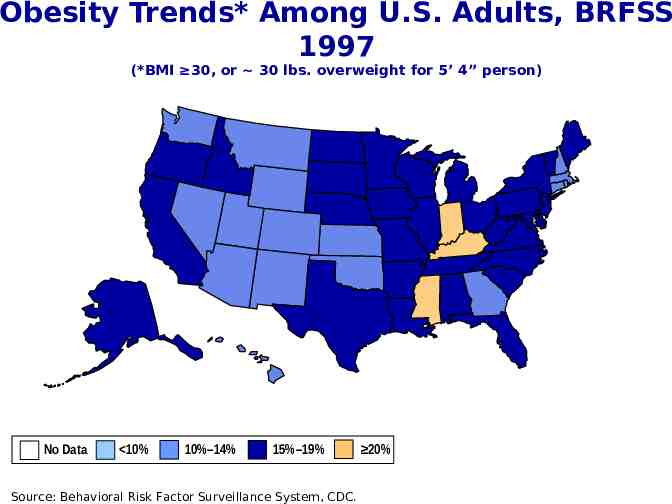
Obesity Trends* Among U.S. Adults, BRFSS 1997 (*BMI 30, or 30 lbs. overweight for 5’ 4” person) No Data 10% 10%–14% 15%–19% Source: Behavioral Risk Factor Surveillance System, CDC. 20%
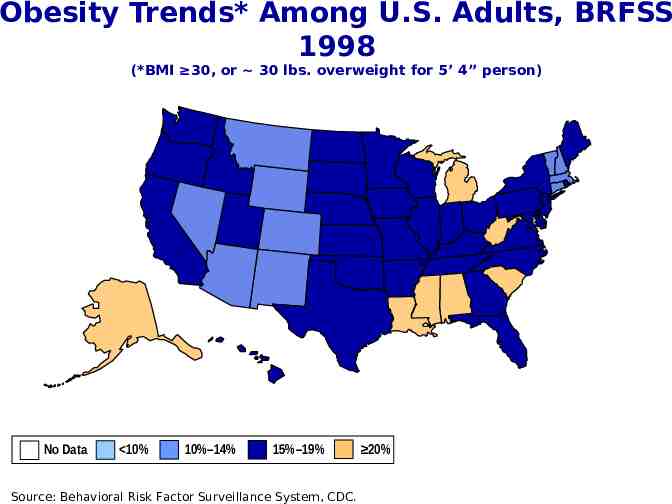
Obesity Trends* Among U.S. Adults, BRFSS 1998 (*BMI 30, or 30 lbs. overweight for 5’ 4” person) No Data 10% 10%–14% 15%–19% Source: Behavioral Risk Factor Surveillance System, CDC. 20%
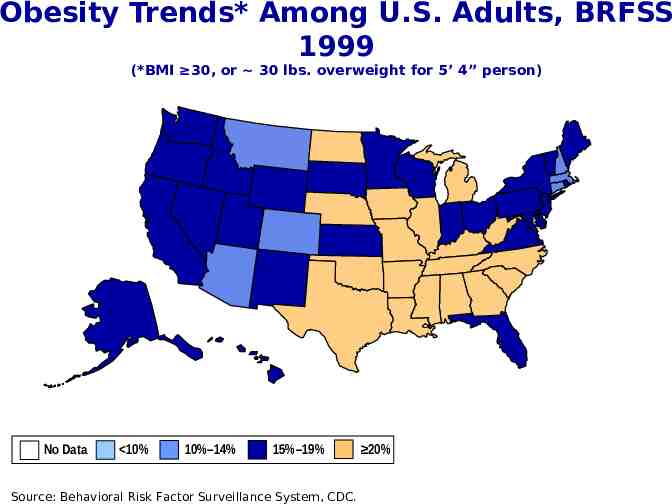
Obesity Trends* Among U.S. Adults, BRFSS 1999 (*BMI 30, or 30 lbs. overweight for 5’ 4” person) No Data 10% 10%–14% 15%–19% Source: Behavioral Risk Factor Surveillance System, CDC. 20%
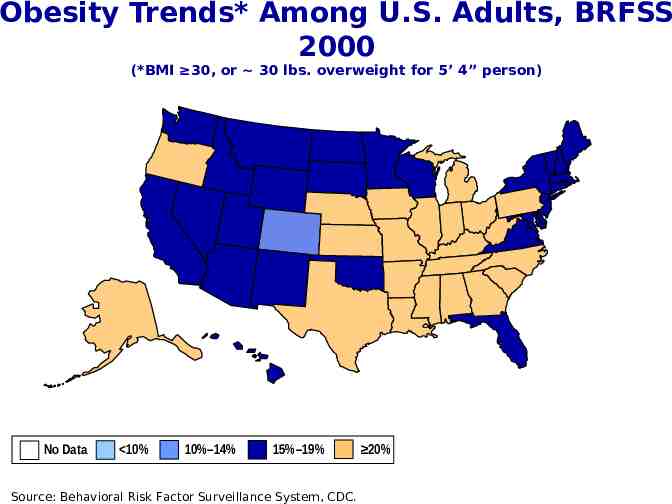
Obesity Trends* Among U.S. Adults, BRFSS 2000 (*BMI 30, or 30 lbs. overweight for 5’ 4” person) No Data 10% 10%–14% 15%–19% Source: Behavioral Risk Factor Surveillance System, CDC. 20%
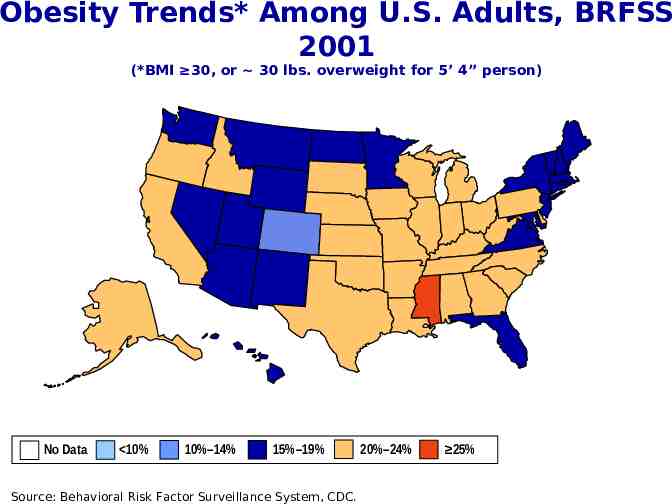
Obesity Trends* Among U.S. Adults, BRFSS 2001 (*BMI 30, or 30 lbs. overweight for 5’ 4” person) No Data 10% 10%–14% 15%–19% Source: Behavioral Risk Factor Surveillance System, CDC. 20%–24% 25%
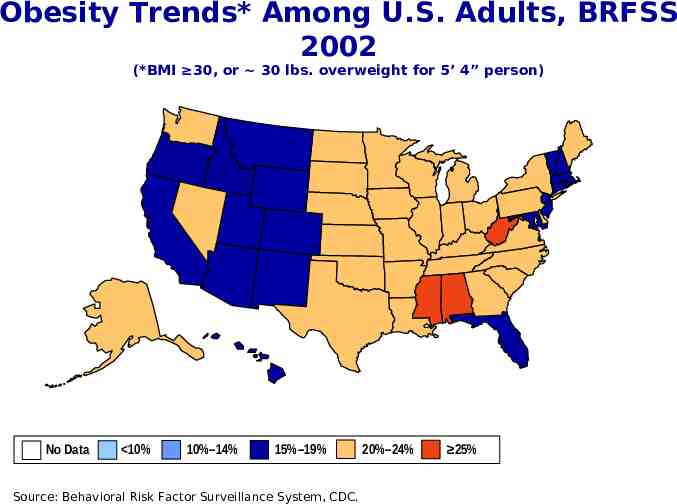
Obesity Trends* Among U.S. Adults, BRFSS 2002 (*BMI 30, or 30 lbs. overweight for 5’ 4” person) No Data 10% 10%–14% 15%–19% Source: Behavioral Risk Factor Surveillance System, CDC. 20%–24% 25%
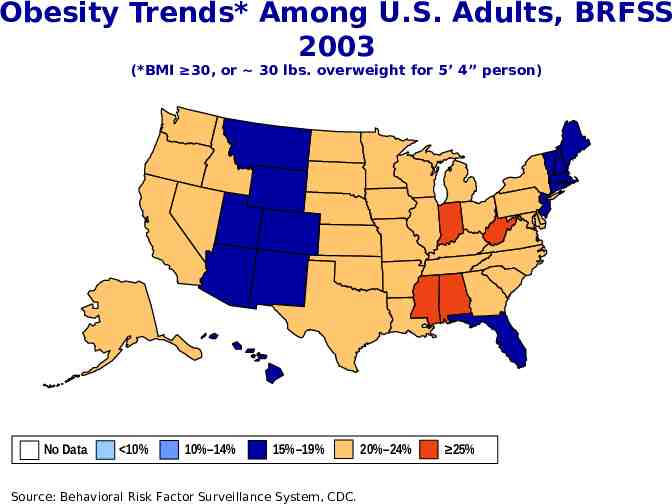
Obesity Trends* Among U.S. Adults, BRFSS 2003 (*BMI 30, or 30 lbs. overweight for 5’ 4” person) No Data 10% 10%–14% 15%–19% Source: Behavioral Risk Factor Surveillance System, CDC. 20%–24% 25%
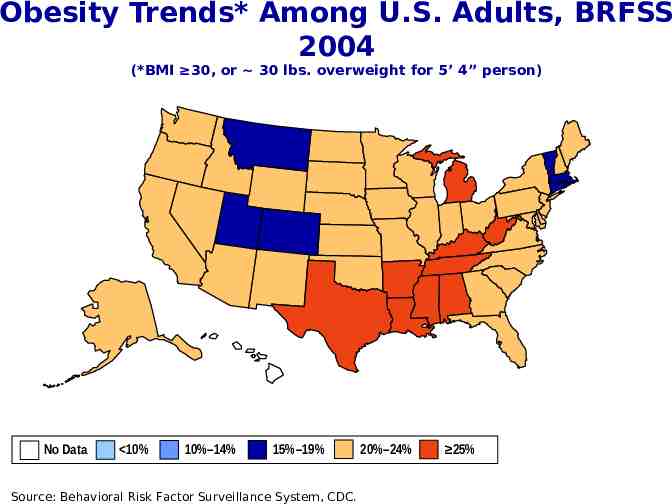
Obesity Trends* Among U.S. Adults, BRFSS 2004 (*BMI 30, or 30 lbs. overweight for 5’ 4” person) No Data 10% 10%–14% 15%–19% Source: Behavioral Risk Factor Surveillance System, CDC. 20%–24% 25%
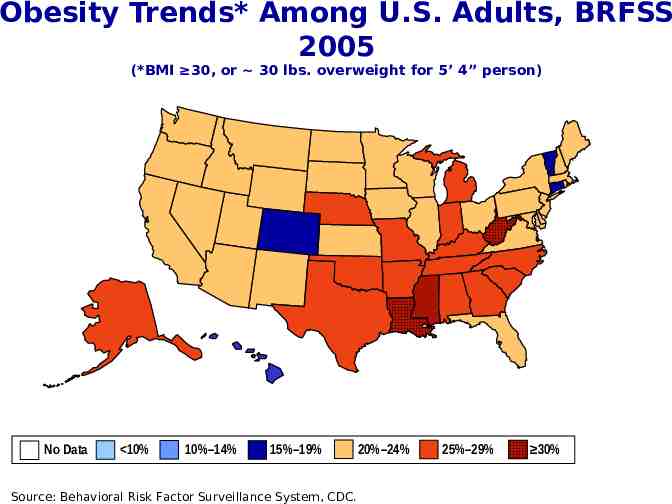
Obesity Trends* Among U.S. Adults, BRFSS 2005 (*BMI 30, or 30 lbs. overweight for 5’ 4” person) No Data 10% 10%–14% 15%–19% Source: Behavioral Risk Factor Surveillance System, CDC. 20%–24% 25%–29% 30%
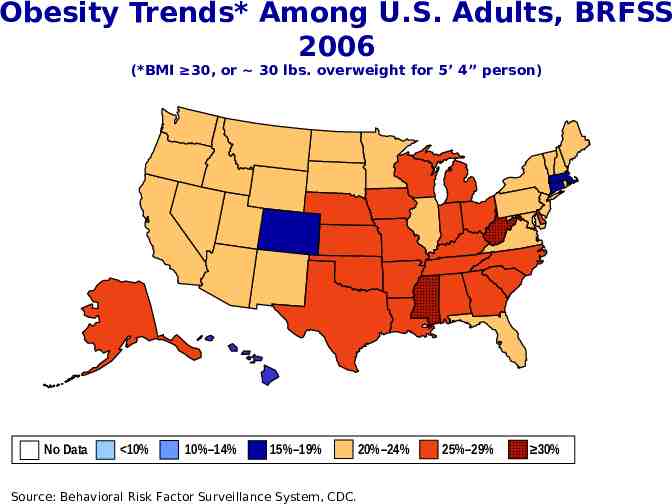
Obesity Trends* Among U.S. Adults, BRFSS 2006 (*BMI 30, or 30 lbs. overweight for 5’ 4” person) No Data 10% 10%–14% 15%–19% Source: Behavioral Risk Factor Surveillance System, CDC. 20%–24% 25%–29% 30%
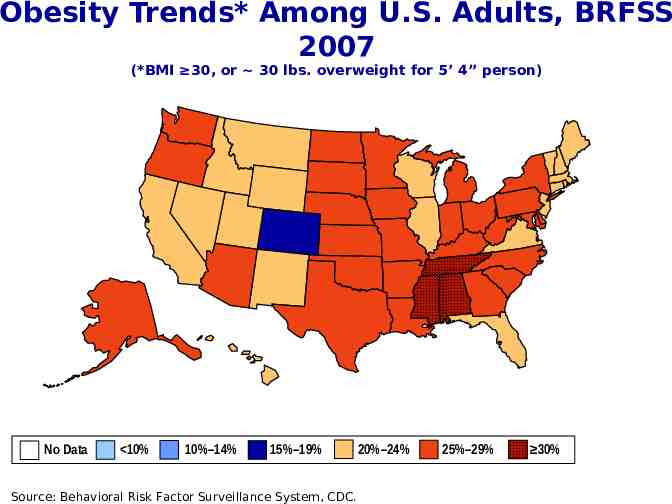
Obesity Trends* Among U.S. Adults, BRFSS 2007 (*BMI 30, or 30 lbs. overweight for 5’ 4” person) No Data 10% 10%–14% 15%–19% Source: Behavioral Risk Factor Surveillance System, CDC. 20%–24% 25%–29% 30%
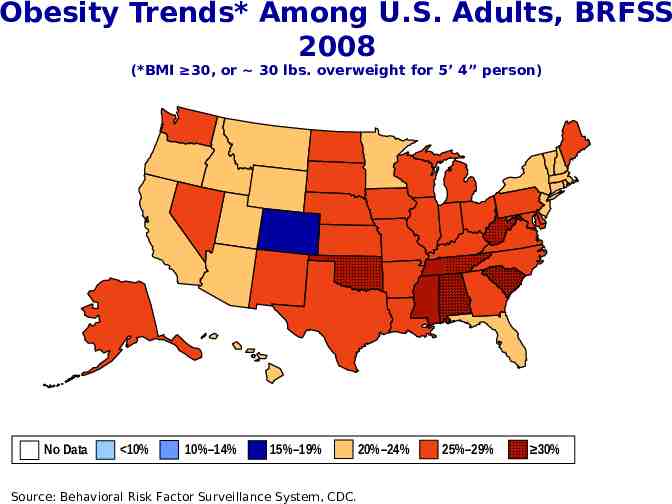
Obesity Trends* Among U.S. Adults, BRFSS 2008 (*BMI 30, or 30 lbs. overweight for 5’ 4” person) No Data 10% 10%–14% 15%–19% Source: Behavioral Risk Factor Surveillance System, CDC. 20%–24% 25%–29% 30%
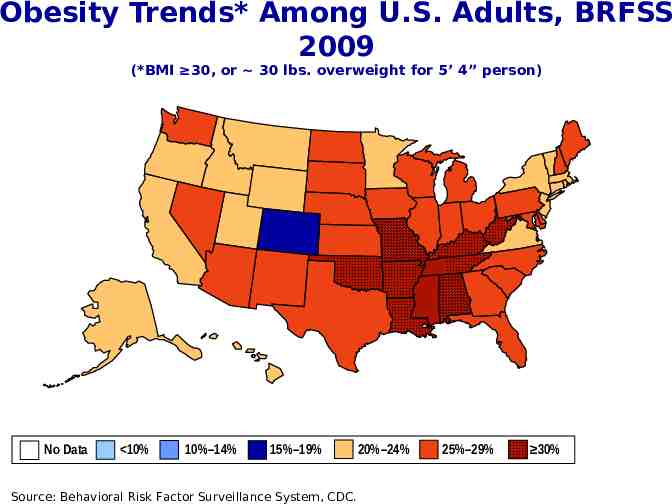
Obesity Trends* Among U.S. Adults, BRFSS 2009 (*BMI 30, or 30 lbs. overweight for 5’ 4” person) No Data 10% 10%–14% 15%–19% Source: Behavioral Risk Factor Surveillance System, CDC. 20%–24% 25%–29% 30%
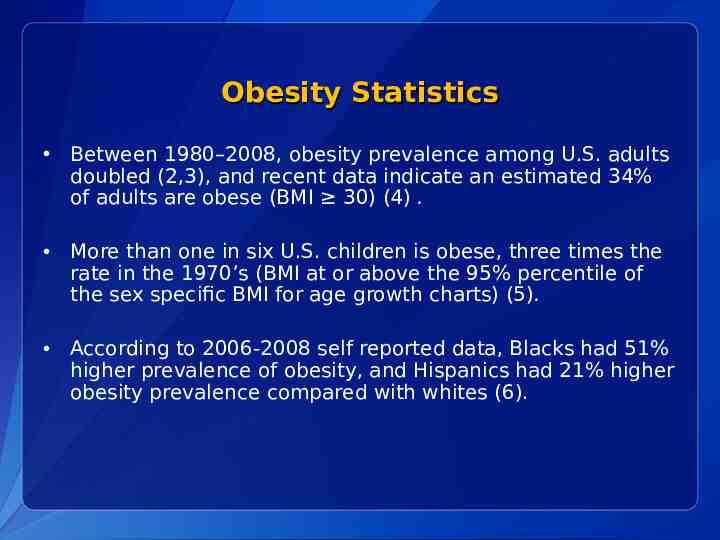
Obesity Statistics Between 1980–2008, obesity prevalence among U.S. adults doubled (2,3), and recent data indicate an estimated 34% of adults are obese (BMI 30) (4) . More than one in six U.S. children is obese, three times the rate in the 1970’s (BMI at or above the 95% percentile of the sex specific BMI for age growth charts) (5). According to 2006-2008 self reported data, Blacks had 51% higher prevalence of obesity, and Hispanics had 21% higher obesity prevalence compared with whites (6).
Presentation Overview 1. Overview of the Obesity Epidemic 2. How Did We Get Here? 3. Why Should Local Governments Care? 4. Policy & Environmental Change to Address Obesity 5. CDC Recommended Community Strategies and Measurements to Prevent Obesity
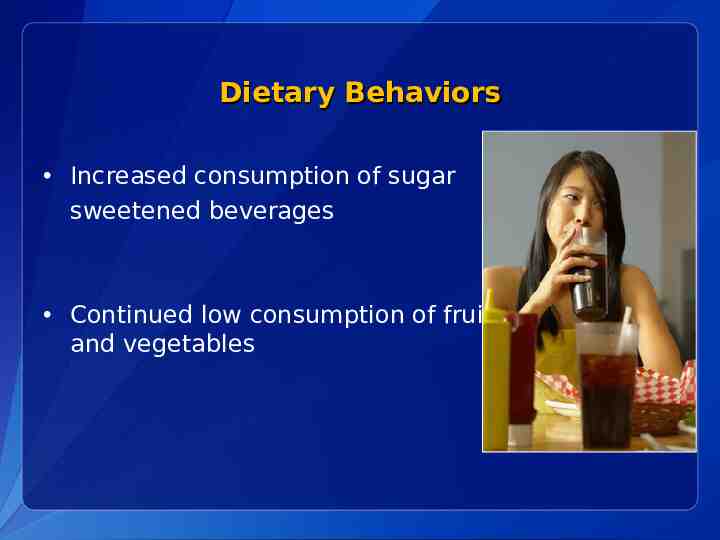
Dietary Behaviors Increased consumption of sugar sweetened beverages Continued low consumption of fruits and vegetables
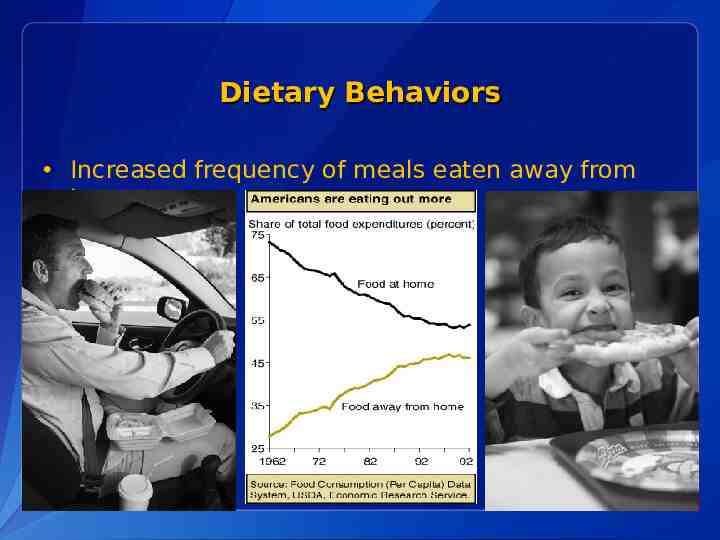
Dietary Behaviors Increased frequency of meals eaten away from home
The Food Environment Increased number of fast food establishments in the U.S. Lack of access to full service grocery stores selling affordable healthful foods Less healthy food & beverage advertising aimed at children
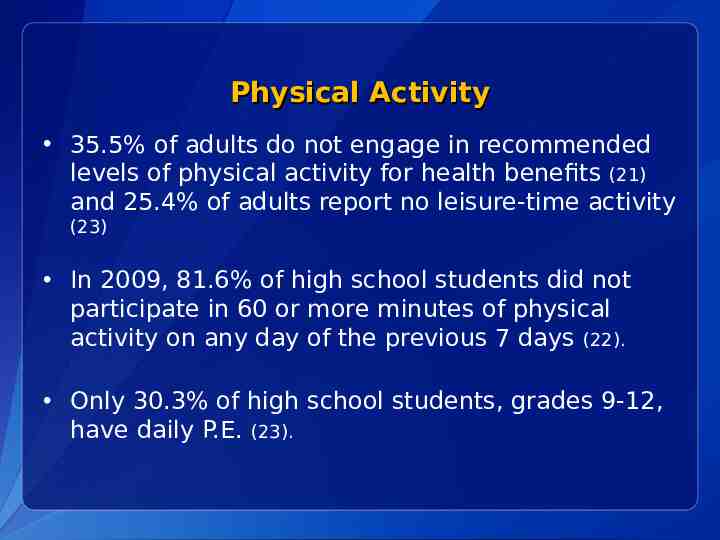
Physical Activity 35.5% of adults do not engage in recommended levels of physical activity for health benefits (21) and 25.4% of adults report no leisure-time activity (23) In 2009, 81.6% of high school students did not participate in 60 or more minutes of physical activity on any day of the previous 7 days (22). Only 30.3% of high school students, grades 9-12, have daily P.E. (23).
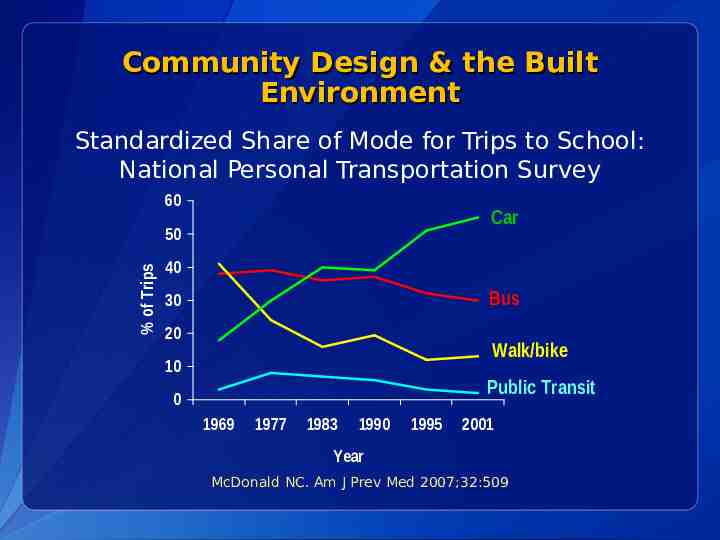
Community Design & the Built Environment Standardized Share of Mode for Trips to School: National Personal Transportation Survey 60 Car % of Trips 50 40 Bus 30 20 Walk/bike 10 Public Transit 0 1969 1977 1983 1990 1995 2001 Year McDonald NC. Am J Prev Med 2007;32:509
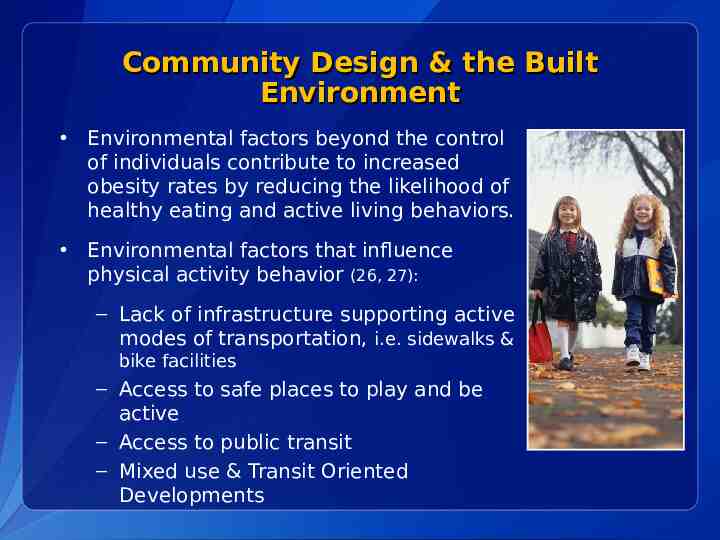
Community Design & the Built Environment Environmental factors beyond the control of individuals contribute to increased obesity rates by reducing the likelihood of healthy eating and active living behaviors. Environmental factors that influence physical activity behavior (26, 27): – Lack of infrastructure supporting active modes of transportation, i.e. sidewalks & bike facilities – Access to safe places to play and be active – Access to public transit – Mixed use & Transit Oriented Developments
Presentation Overview 1. Overview of the Obesity Epidemic 2. How Did We Get Here? 3. Why Should Local Governments Care? 4. Policy & Environmental Change to Address Obesity 5. CDC Recommended Community Strategies and Measurements to Prevent Obesity
Why Should Local Governments Care? The Cost of Obesity is High: In 2008, the annual healthcare cost of obesity in the US was estimated to be as high as 147 billion dollars a year, double the amount a decade ago (28). Annual medical expenses for the obese are estimated to be 42 percent higher than for a person of a healthy weight (28). Workplace obesity prevention programs may be an effective way for employers, including local governments, to reduce obesity, lower health care costs, lower absenteeism, and increase employee productivity.
Why Should Local Governments Care? Local government officials are community leaders and can enact policies that support healthy community design – For example, local zoning ordinances & economic incentives affect the presence and absence of: Parks and open spaces for recreation Bike facilities Mixed use developments Healthy food retailers & farmers markets
Local Government Can Be Part of the Solution Policies and environments that affect peoples’ health are determined by a variety of local government entities, including: City Councils/County Commissions Zoning Boards School Districts Transportation & Planning departments Parks & Recreation departments
Advantages of Policy & Environmental Change to Address Obesity: Potential for systemic change in a community’s food and physical activity environment. Broad Reach: Opportunity to “level the playing field” for all members of a community, including disproportionately impacted populations. Flexibility: Consider the unique characteristics and needs of your community and implement obesity prevention initiatives to address them.
Advantages of Policy & Environmental Initiatives to Address Obesity: Policy-based strategies have proven very effective in other major public health battles, for example, the tobacco control movement. Local Policy Example: After a decade with no decrease in smoking, New York City implemented a five point tobacco control program, which included two policy initiatives: aggressive increases in cigarette taxation (2002) and smoke free air legislation (2003). During 2002-2004, estimated adult smoking prevalence decreased from 21.5% to 18.4%, representing nearly 200,000 fewer smokers in New York city (29-31).
Call To Action What can local governments do right now to address obesity? – Enact policy and environmental initiatives that support healthy eating and active living – Partner with a variety of local agencies to leverage resources and achieve greater impact (i.e. Planning Dept, Economic Redevelopment Agency, Parks & Recreation Dept, Public Health Dept) – Set feasible short and long term goals to address the unique needs of your community – Measure your community’s performance and adjust goals as necessary
Presentation Overview 1. Overview of the Obesity Epidemic 2. How Did We Get Here? 3. Why Should Local Governments Care? 4. Policy & Environmental Change to Address Obesity 5. CDC Recommended Community Strategies and Measurements to Prevent Obesity
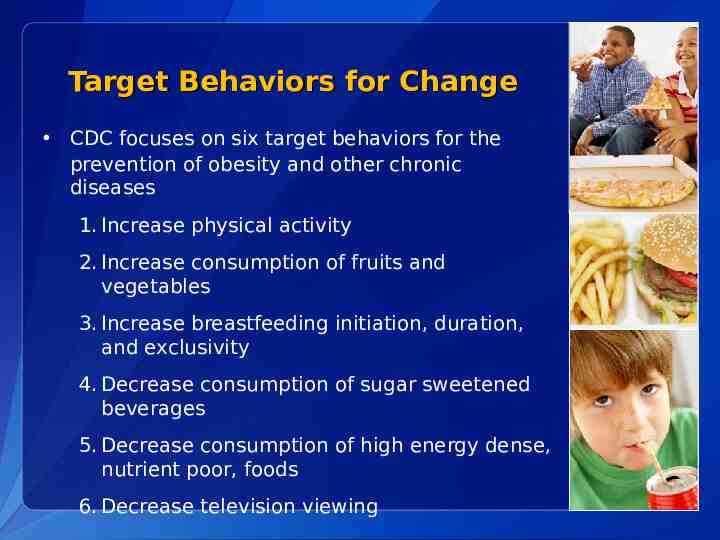
Target Behaviors for Change CDC focuses on six target behaviors for the prevention of obesity and other chronic diseases 1. Increase physical activity 2. Increase consumption of fruits and vegetables 3. Increase breastfeeding initiation, duration, and exclusivity 4. Decrease consumption of sugar sweetened beverages 5. Decrease consumption of high energy dense, nutrient poor, foods 6. Decrease television viewing
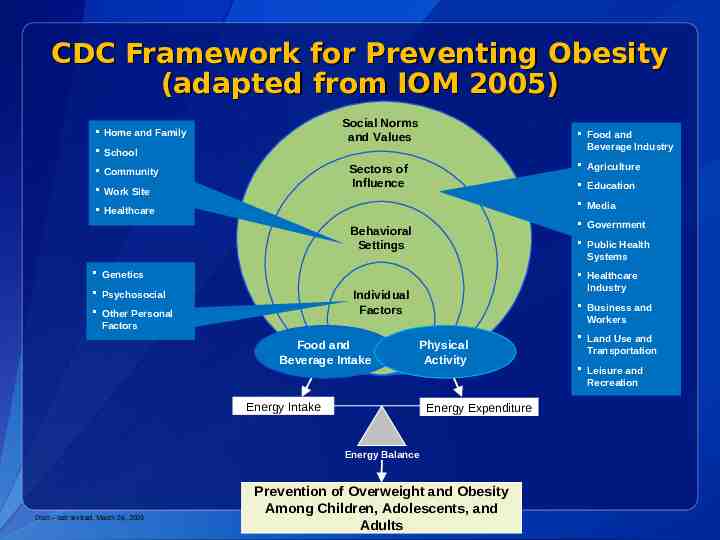
CDC Framework for Preventing Obesity (adapted from IOM 2005) Social Norms and Values Home and Family Food and Beverage Industry School Agriculture Sectors of Influence Community Work Site Education Media Healthcare Government Behavioral Settings Public Health Systems Genetics Healthcare Industry Individual Factors Psychosocial Other Personal Factors Food and Beverage Intake Business and Workers Physical Activity Energy Intake Energy Expenditure Energy Balance Draft – last revised, March 24, 2005 Prevention of Overweight and Obesity Among Children, Adolescents, and Adults Land Use and Transportation Leisure and Recreation
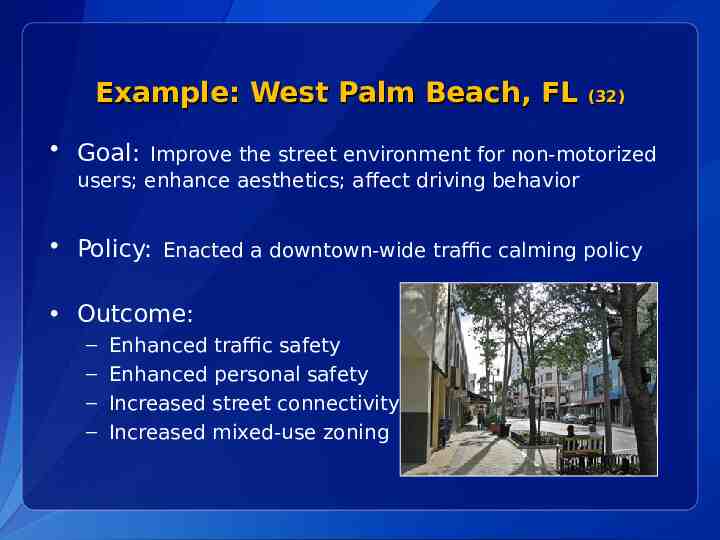
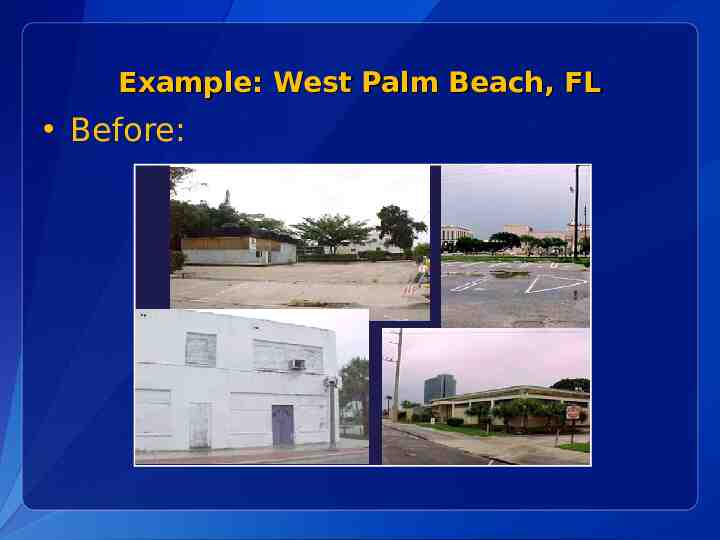
Example: West Palm Beach, FL (32) Goal: Improve the street environment for non-motorized users; enhance aesthetics; affect driving behavior Policy: Enacted a downtown-wide traffic calming policy Outcome: – – – – Enhanced traffic safety Enhanced personal safety Increased street connectivity Increased mixed-use zoning
Example: West Palm Beach, FL Before:
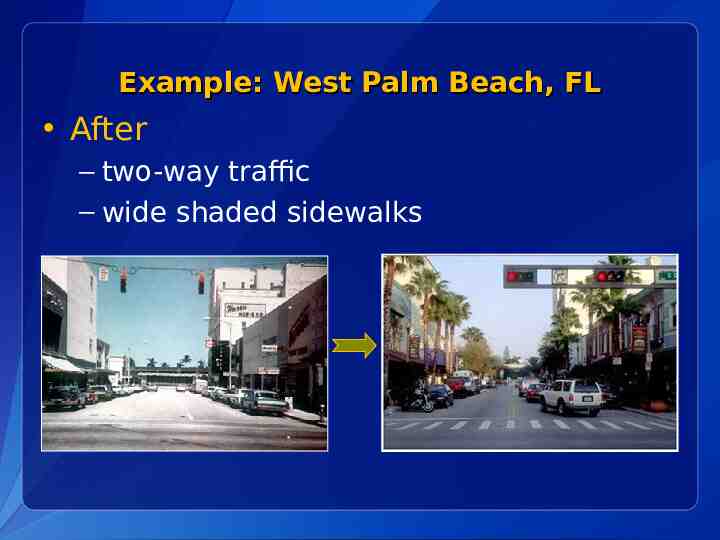
Example: West Palm Beach, FL After – two-way traffic – wide shaded sidewalks
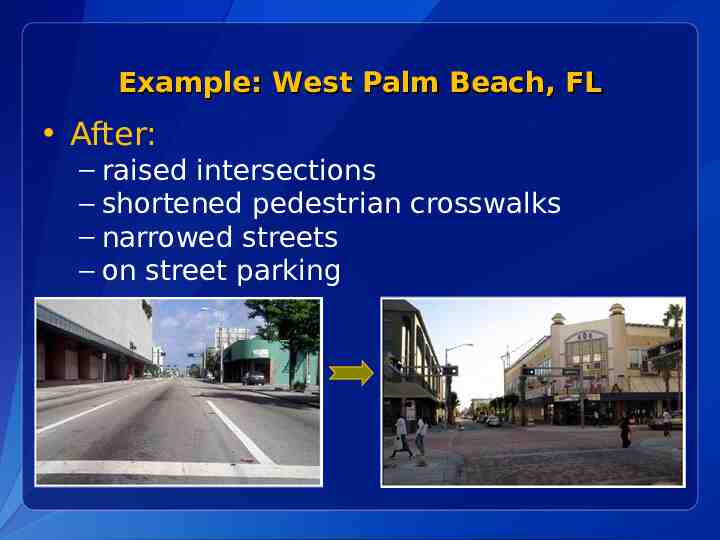
Example: West Palm Beach, FL After: – raised intersections – shortened pedestrian crosswalks – narrowed streets – on street parking
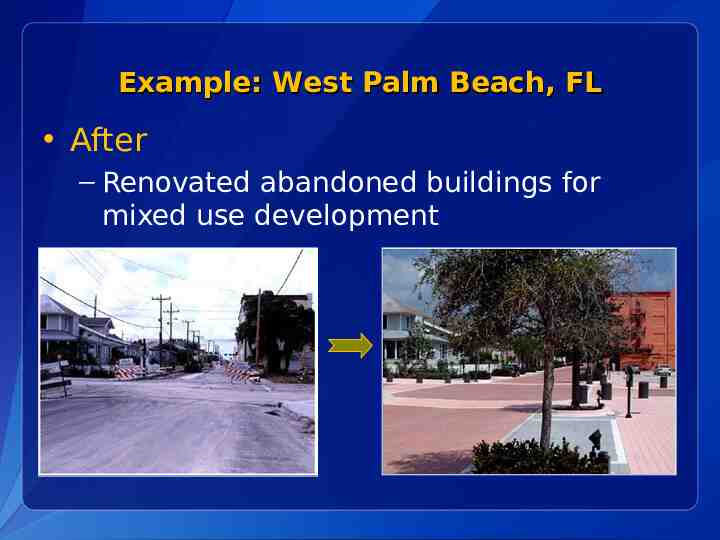
Example: West Palm Beach, FL After – Renovated abandoned buildings for mixed use development
Example: West Palm Beach, FL After
Example: Somerville, MA (33) Goal: Increase access to affordable healthier foods Environmental Change: Implemented a farmers market that was culturally and economically appropriate for the community. Outcome: – Created an incentive program for WIC & food stamp beneficiaries to shop at the market – Instructions for vendors on how to accept food stamps – Promotional materials produced in four languages – Increases in attendance, the percentage of foreign born and low income patrons, & the redemption rate of WIC Special Supplemental Nutrition Program vouchers
Example: City of Corning and Corning Union School District, CA (36) Goal: Increase community access to safe places for physical activity Policy Change: Established a Joint Use Agreement that opens up school recreation facilities and resources for public use. – Public use of school facilities during after-school hours, on weekends, and non-school days. – Shared recreation facilities include: gymnasiums, swimming pools, tennis courts, and athletic fields. – Shared responsibility for facility maintenance and repair costs.
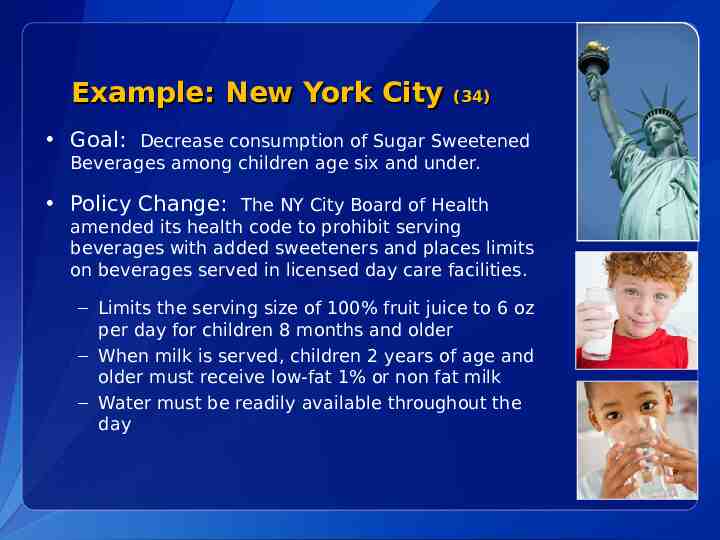
Example: New York City (34) Goal: Decrease consumption of Sugar Sweetened Beverages among children age six and under. Policy Change: The NY City Board of Health amended its health code to prohibit serving beverages with added sweeteners and places limits on beverages served in licensed day care facilities. – Limits the serving size of 100% fruit juice to 6 oz per day for children 8 months and older – When milk is served, children 2 years of age and older must receive low-fat 1% or non fat milk – Water must be readily available throughout the day
Presentation Overview 1. Overview of the Obesity Epidemic 2. How Did We Get Here? 3. Why Should Local Governments Care? 4. Policy & Environmental Change to Address Obesity 5. CDC Recommended Community Strategies and Measurements to Prevent Obesity
CDC Recommended Community Strategies and Measurements to Prevent Obesity CDC’s Goal: To recommend a set of obesity prevention strategies and corresponding measurements, or indicators, that local governments can use to plan, implement, and monitor policy and environmental initiatives to prevent obesity.
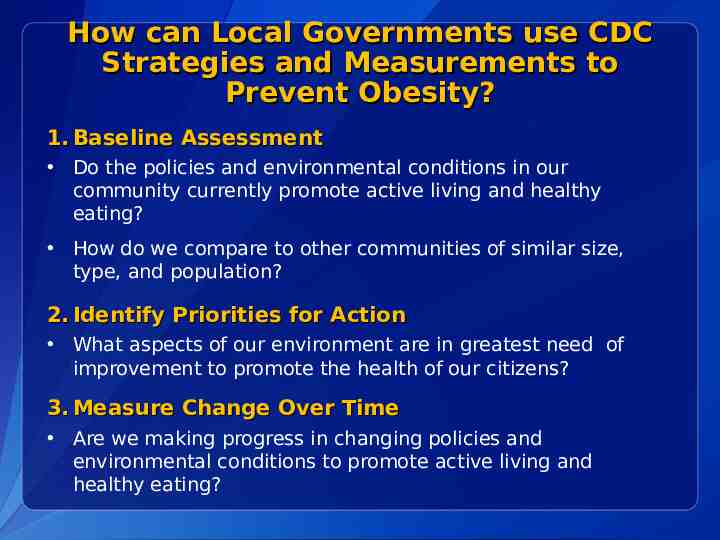
How can Local Governments use CDC Strategies and Measurements to Prevent Obesity? 1. Baseline Assessment Do the policies and environmental conditions in our community currently promote active living and healthy eating? How do we compare to other communities of similar size, type, and population? 2. Identify Priorities for Action What aspects of our environment are in greatest need of improvement to promote the health of our citizens? 3. Measure Change Over Time Are we making progress in changing policies and environmental conditions to promote active living and healthy eating?
CDC Recommended Community Strategies and Measurements to Prevent Obesity Project Methodology
CDC Recommended Community Strategies and Measurements to Prevent Obesity Project Approach: Recommended Strategies and Measurements are: Grounded in existing evidence (systematic review of literature) Grounded in expert opinion Guided by principles of transparency, stakeholder involvement, and documentation.
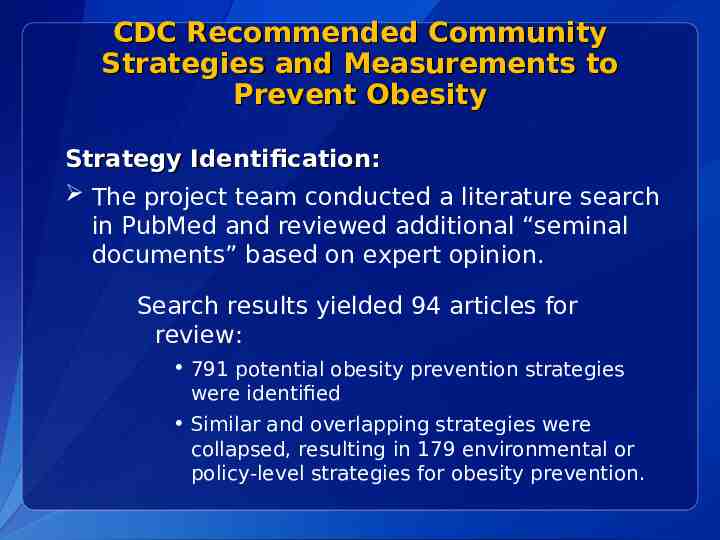
CDC Recommended Community Strategies and Measurements to Prevent Obesity Strategy Identification: The project team conducted a literature search in PubMed and reviewed additional “seminal documents” based on expert opinion. Search results yielded 94 articles for review: 791 potential obesity prevention strategies were identified Similar and overlapping strategies were collapsed, resulting in 179 environmental or policy-level strategies for obesity prevention.
CDC Recommended Community Strategies and Measurements to Prevent Obesity Project Expertise 15 Academic Select Panelists 60 CDC Workgroup Members 20 Local Government Experts 6 Measurement Experts
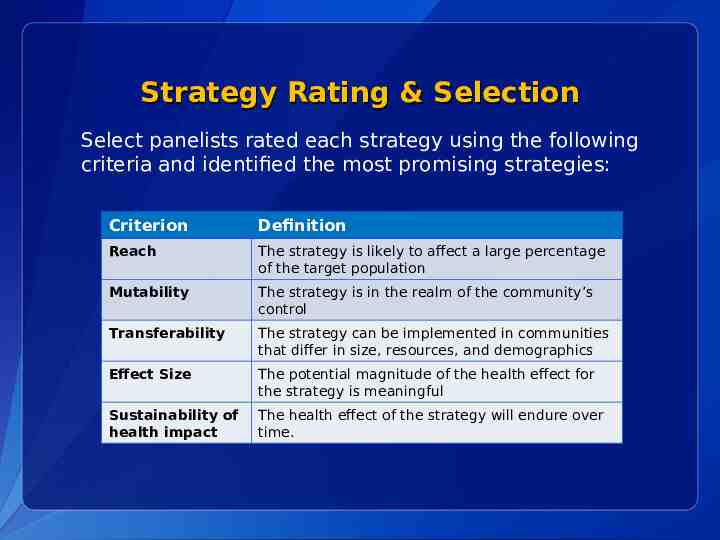
Strategy Rating & Selection Select panelists rated each strategy using the following criteria and identified the most promising strategies: Criterion Definition Reach The strategy is likely to affect a large percentage of the target population Mutability The strategy is in the realm of the community’s control Transferability The strategy can be implemented in communities that differ in size, resources, and demographics Effect Size The potential magnitude of the health effect for the strategy is meaningful Sustainability of health impact The health effect of the strategy will endure over time.
Measurement Nomination & Selection Three Content Area Experts were assigned to each strategy according to area of expertise Assigned experts reviewed the evidence base for each strategy and nominated up to three measures Through a voting process the top 2 measures were selected for each strategy
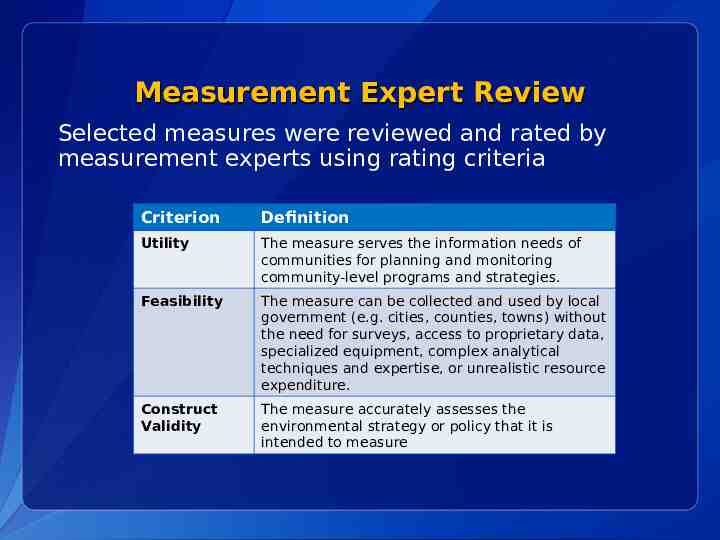
Measurement Expert Review Selected measures were reviewed and rated by measurement experts using rating criteria Criterion Definition Utility The measure serves the information needs of communities for planning and monitoring community-level programs and strategies. Feasibility The measure can be collected and used by local government (e.g. cities, counties, towns) without the need for surveys, access to proprietary data, specialized equipment, complex analytical techniques and expertise, or unrealistic resource expenditure. Construct Validity The measure accurately assesses the environmental strategy or policy that it is intended to measure
Local Government Pilot Test Twenty local government representatives pilot tested the measures: Local Government representatives included City Managers, Urban Planners, and Budget Analysts Each community pilot tested a subset of the measures They provided feedback on their ability to report on each measurement, the level of effort required to gather the necessary data, and the perceived utility of each measurement.
CDC Recommended Community Strategies and Measurements to Prevent Obesity Outcome: CDC recommended 24 policy and environmental change strategies to promote healthy eating and active living and reduce the prevalence of obesity in the U.S. CDC also identified a suggested measurement for each strategy that communities can use to assess implementation and track progress over time.
CDC’s Recommended Strategies to Prevent Obesity Strategies to Promote the Availability of Affordable Healthy Food & Beverages 1. Increase availability of healthier food and beverage choices in public service venues 2. Improve availability of affordable healthier food and beverage choices in public service venues 3. Improve geographic availability of supermarkets in underserved areas 4. Provide incentives to food retailers to locate in and/or offer healthier food and beverage choices in underserved areas 5. Improve availability of mechanisms for purchasing foods from farms 6. Provide incentives for the production, distribution, and procurement of foods from local farms
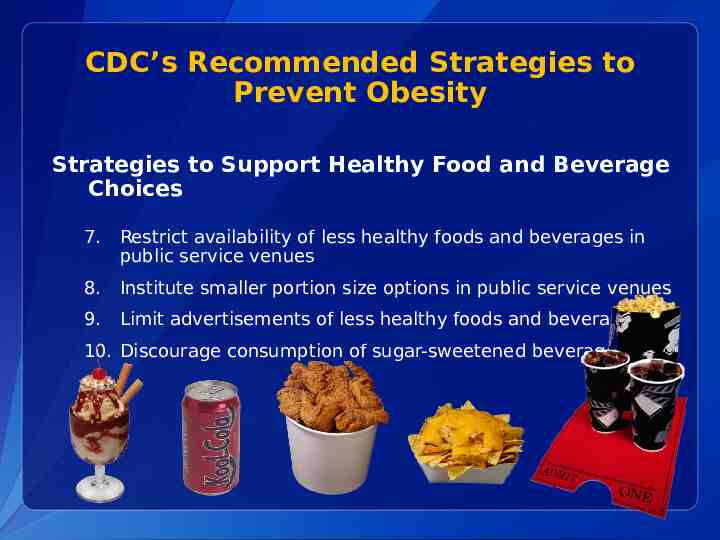
CDC’s Recommended Strategies to Prevent Obesity Strategies to Support Healthy Food and Beverage Choices 7. Restrict availability of less healthy foods and beverages in public service venues 8. Institute smaller portion size options in public service venues 9. Limit advertisements of less healthy foods and beverages 10. Discourage consumption of sugar-sweetened beverages
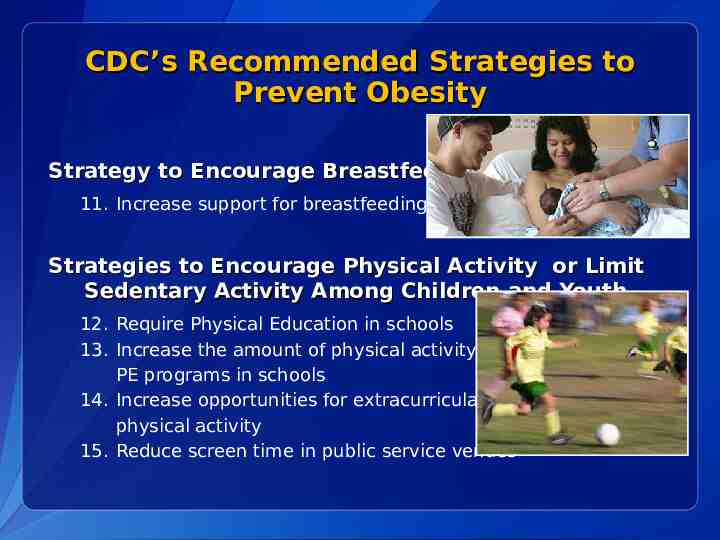
CDC’s Recommended Strategies to Prevent Obesity Strategy to Encourage Breastfeeding 11. Increase support for breastfeeding Strategies to Encourage Physical Activity or Limit Sedentary Activity Among Children and Youth 12. Require Physical Education in schools 13. Increase the amount of physical activity in PE programs in schools 14. Increase opportunities for extracurricular physical activity 15. Reduce screen time in public service venues
CDC’s Recommended Strategies to Prevent Obesity Strategies to Create Safe Communities That Support Physical Activity 16. 17. 18. 19. 20. 21. 22. Improve access to outdoor recreational facilities Enhance infrastructure supporting bicycling Enhance infrastructure supporting walking Support locating schools in residential neighborhoods Improve access to transportation Zone for mixed-use development Enhance personal safety where people are or could be physically active 23. Enhance traffic safety in areas where persons are or could be physically active Strategy to Encourage Communities to Organize for Change 24. Participate in community coalitions or partnerships to address obesity
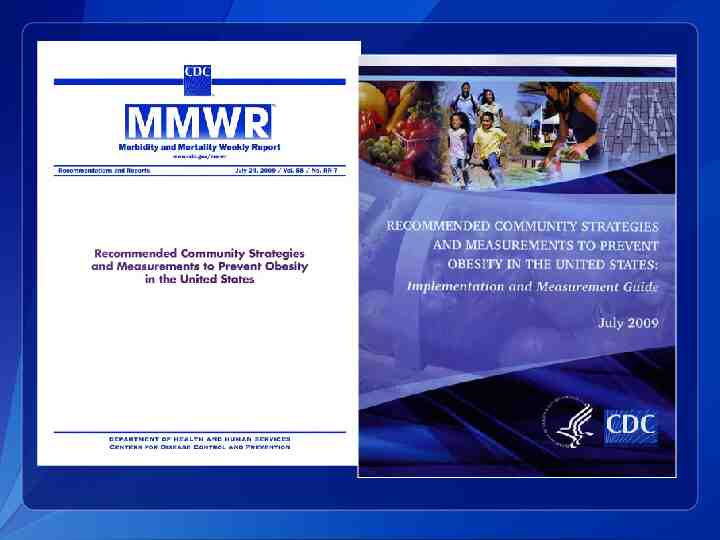
Resources for Implementing Strategies and Measures and Monitoring Performance Published in CDC’s MMWR Recommendations and Reports supplement, July, 2009: http://www.cdc.gov/mmwr/preview/mmwrhtml/rr5807a1.htm A detailed Implementation and Measurement Guide was developed to assist local governments, states, and policy makers in implementing the CDC recommended strategies and reporting on the associated measurements: http://www.cdc.gov/obesity/downloads/community strategies guide.pdf Measures were incorporated into ICMA’s Center for Performance Measurement system: http://www.icma.org/performance
References 1. BRFSS, Behavioral Risk Factor Surveillance System, http://www.cdc.gov/brfss/ 2. Flegal KM, Carroll MD, Ogden CL, Johnson CL. Prevalence and trends in obesity among U.S. adults, 1999-2000. JAMA. 2002 Oct 9; 288 (14); 17231727. 3. Ogden CL, Carroll MD, Curtin LR, McDowell MA, Tabak CJ, Flegal KM. Prevalence of overweight and obesity in the United States, 1999-2004. JAMA. 2006 Apr 5; 295 (13); 1549-55. 4. National Center for Health Statistics. Health, United States, 2009: With Special Feature Medical Technology. Hyatsville, MD. 2010. 5. Cynthia L. Ogden; Margaret D. Carroll; Lester R. Curtin; Molly M. Lamb; Katherine M. Flegal. Prevalence of High Body Mass Index in US Children and Adolescents, 2007-2008 JAMA. 2010;303(3):242-249. 6. Centers for Disease Control & Prevention. Differences in Prevalence of Obesity Among Black, White, & Hispanic Adults—United States, 2006-2008. MMWR 2009; 58 (27); 740-744. 7. Centers for Disease Control & Prevention. Incorporating Away-From-Home Food into a Healthy Eating Plan. Research to Practice Series (No. 6). Atlanta, GA: National Center for Chronic Disease Prevention and Health Promotion, Division of Nutrition and Physical Activity. 8. Block G. Foods contributing to energy intake in the US: data from NHANES III and NHANES 1999-2000. J Food Composit Anal. 2004;17(3-4): 439-447 9. Berkey CS, Rockett HR, Field AE, Gillman MW, Colditz GA. Sugar-added beverages and adolescent weight change. Obes Res. 2004;12(5): 778-788.
References 10. Striegel-Moore RH, Thompson D, Affenito SG, et al. Correlates of beverage intake in adolescent girls: The National Heart, Lung, and Blood Institute Growth and Health Study. J Pediatr. 2006;148(2): 183-187. 11. Dubois L, Farmer A, Girard M, Peterson K. Regular sugar-sweetened beverage consumption between meals increases risk of overweight among preschool-aged children. J Am Diet Assoc. 2007;107(6): 924-934. 12. Tordoff MG, Alleva AM. Effect of drinking soda sweetened with aspartame or highfructose corn syrup on food intake and body weight. Am J Clin Nutr. 1990;51(6): 963969. 13. DiMeglio D, Mattes R. Liquid versus solid carbohydrate: effects on food intake and body weight. Int J Obes Relat Metab Disord. 2000;24 (6): 794-800. 14. Raben A, Vasilaras TH, Møller AC, Astrup A. Sucrose compared with artificial sweeteners: different effects on ad libitum food intake and body weight after 10 wk of supplementation in overweight subjects. Am J Clin Nutr. 2002;76(4): 721-729. 15. James J, Thomas P, Cavan D, Kerr D. Preventing childhood obesity by reducing consumption of carbonated drinks: cluster randomized controlled trial. BMJ. 2004;328 (7450): 1237. 16. Ebbeling CB, Feldman HA, Osganian SK, Chomitz VR, Ellenbogen SJ, Ludwig DS. Effects of decreasing sugar-sweetened beverage consumption on body weight in adolescents: A randomized, controlled pilot study. Pediatrics. 2006;117(3): 673-680 17. Kimmons J, Gillespie C, Seymour J, Serdula M, Blanck HM. Fruit and vegetable intake among adolescents and adults in the United States: percentage meeting individualized recommendations. Medscape J Med. 2009;11(1):26. 18. Larson N, Story M, Nelson M. Neighborhood Environments Disparities in Access to Healthy Foods in the U. S. Am J Prev Med. 2009.
References 19. Federal Trade Commission.(2008) Marketing Food to Children and Adolescents: A Review of Industry Expenditures, Activities, and Self-Regulation. Washington, D.C.: Federal Trade Commission.Retrieved from: http://www.ftc.gov/os/2008/07/P064504foodmktingreport.pdf, at ES-1. 20. Escobar-Chaves, S.L., Anderson, C.A.(2008).Media and Risky Behaviors.Children and Electronic Media.18(1).Retrieved from: http://futureofchildren.org/futureofchildren/publications/docs/18 01 07.pdf 21. Centers for Disease Control and Prevention. (2010). State Indicator Report on Physical Activity, 2010 National Action Guide. Retrieved from: http://www.cdc.gov/physicalactivity/downloads/PA State Indicator Report 2010 Action Guide.pdf 22. Centers for Disease Control and Prevention. Youth Risk Behavior Surveillance — United States, 2009. Surveillance Summaries, [6-4-2010]. MMWR 2010;59(5). 23. Centers for Disease Control and Prevention. (2010). State Indicator Report on Physical Activity, 2010 National Action Guide. Retrieved from: http://www.cdc.gov/physicalactivity/downloads/PA State Indicator Report 2010 Action Guide.pdf 24. US DHHS. Physical Activity and health: A report of the Surgeon General. Atlanta, GA: US. Department of Health and Human Services, Centers for Disease Control and Prevention, National Center for Chronic Disease Prevention and Health Promotion, The President’s Council on Physical Fitness and sports: 1996 25. U.S. Department of Health and Human Services. 2008 Physical Activity Guidelines for Americans. Hyattsville, MD: U.S. Department of Health and Human Services, 2008.
References 26.Resources for State and Community Programs March 2010. “CDC’s Guide to Strategies for Increasing Physical Activity in the Community.” CD‐ ROM. Centers for Disease Control and Prevention, 2010. 27.Heath GW, Brownson RC, Kruger J, et al. The effectiveness of urban design and land use and transport policies and practices to increase physical activity: A systematic review. J Phys Act Health. 2006;3(suppl 1):S55–S76. 28. Finkelstein EA, Trogdon JG, Cohen JW, Dietz W. Annual medical spending attributable to obesity: payer-and service-specific estimates. Health Aff (Millwood). 2009 Sep-Oct;28(5):w822-31 29.Chang C, Leighton J, Mostashari F, McCord C, Frieden TR. The New York City Smoke-Free Air Act: second-hand smoke as a worker health and safety issue. Am J Ind Med 2004;46:188--95. 30.Frieden TR, Mostashari F, Kerker BD, Miller N, Hajat A, Frankel M. Adult tobacco use levels after intensive tobacco-control measures: New York City, 2002--2003. Am J Public Health 2005;95:1016--23. 31.New York City Department of Health and Mental Hygiene. EpiQuery: NYC interactive health data. Available at https://a816-health3ssl.nyc.gov.
References 32. Lockwood, I., & Stillings, T. (1998). Traffic calming for crime reduction & neighborhood revitilization. West Palm Beach, FL: City of West Palm Beach 33. Active Living by Design. (2006). Shape-Up Somerville, Somerville Massachusetts. Chapel Hill, NC: Author. 34. NY City Department of Health and Mental Hygiene (2006). Notice of adoption of amendments to Article 47 of the New York City health code. New York, NY; Author. 35. 6. Zoumas-Morse C, Rock CL, Sobo EJ, Neuhouser ML. "Children’s Patterns of Macronutrient Intake and Associations with Restaurant and Home Eating." J Am Dietetic Assoc 2001;101:923-925. 36. Strategic Alliance ENACT. (2008). Policy detail: Corning Union High School District Facilities Use Agreement. Retrieved August 5, 2010, from http://eatbettermovemore.org/sa/policies/policy detail.php?s Search &i ssue &env &keyword 73&s State California&jurisdiction 3&year & policyID 333
Reversing the obesity epidemic is a shared responsibility. Social and environmental changes are influenced by the efforts of many
The content contained in this PowerPoint presentation is in the public domain. However, if you use any text or change the text, please remove the Centers for Disease Control and Prevention (CDC) and Department of Health and Human Services (HHS) logos, and credit CDC for the data. For more information please contact Centers for Disease Control and Prevention 1600 Clifton Road NE, Atlanta, GA 30333 Telephone, 1-800-CDC-INFO (232-4636)/TTY: 1-888-232-6348 E-mail: [email protected] Web: www.cdc.gov The findings and conclusions in this report are those of the authors and do not necessarily represent the official position of the Centers for Disease Control and Prevention. National Center for Chronic Disease Prevention and Health Promotion CS210507 Division of Nutrition, Physical Activity, and Obesity