CUNA Current Expected Credit Loss (CECL) eSchool Calculating

16 Slides489.21 KB
CUNA Current Expected Credit Loss (CECL) eSchool Calculating an Estimate Based on the Static Pool (Vintage) Model Dan Price President Twenty Twenty Analytics [email protected] (352) 634-0042 (Rev. 02/25/2024) In collaboration
Agenda Overview FASB Example Real World Example 2
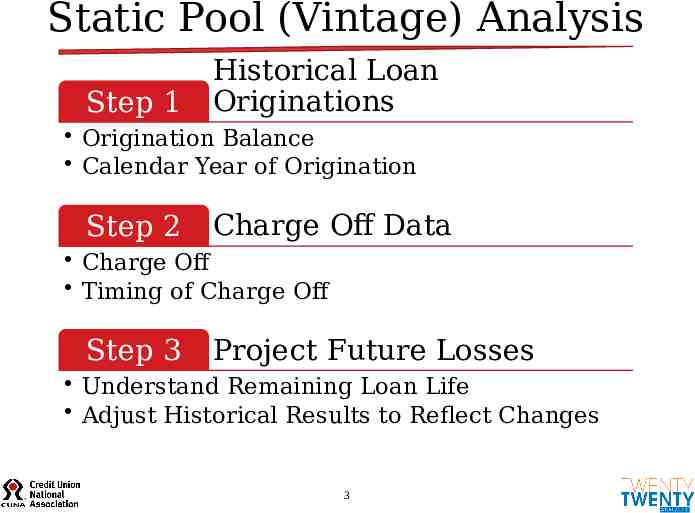
Static Pool (Vintage) Analysis Step 1 Historical Loan Originations Origination Balance Calendar Year of Origination Step 2 Charge Off Data Charge Off Timing of Charge Off Step 3 Project Future Losses Understand Remaining Loan Life Adjust Historical Results to Reflect Changes 3
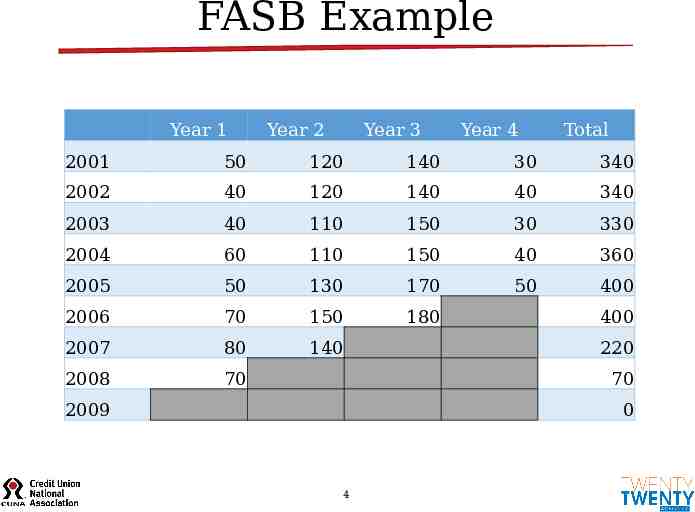
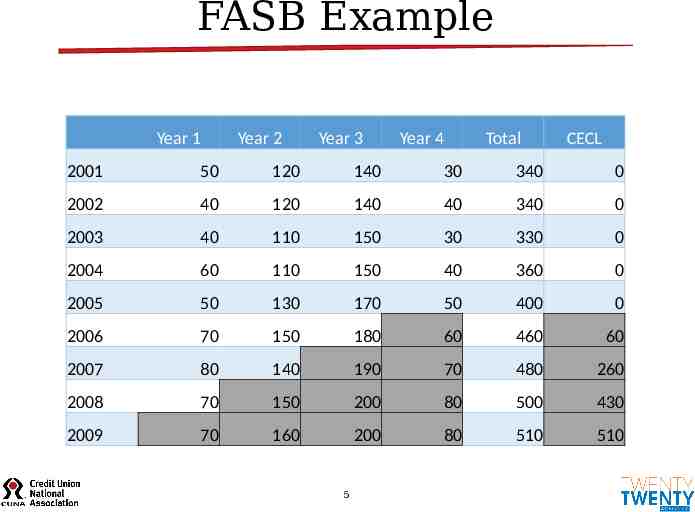
FASB Example Year 1 Year 2 Year 3 Year 4 Total 2001 50 120 140 30 340 2002 40 120 140 40 340 2003 40 110 150 30 330 2004 60 110 150 40 360 2005 50 130 170 50 400 2006 70 150 180 2007 80 140 2008 70 400 220 70 2009 0 4
FASB Example Year 1 Year 2 Year 3 Year 4 Total CECL 2001 50 120 140 30 340 0 2002 40 120 140 40 340 0 2003 40 110 150 30 330 0 2004 60 110 150 40 360 0 2005 50 130 170 50 400 0 2006 70 150 180 60 460 60 2007 80 140 190 70 480 260 2008 70 150 200 80 500 430 2009 70 160 200 80 510 510 5
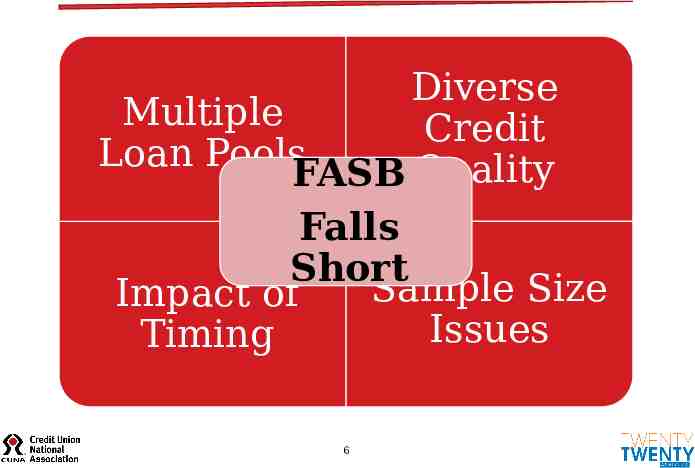
Diverse Multiple Credit Loan Pools FASB Quality Falls Short Sample Size Impact of Issues Timing 6
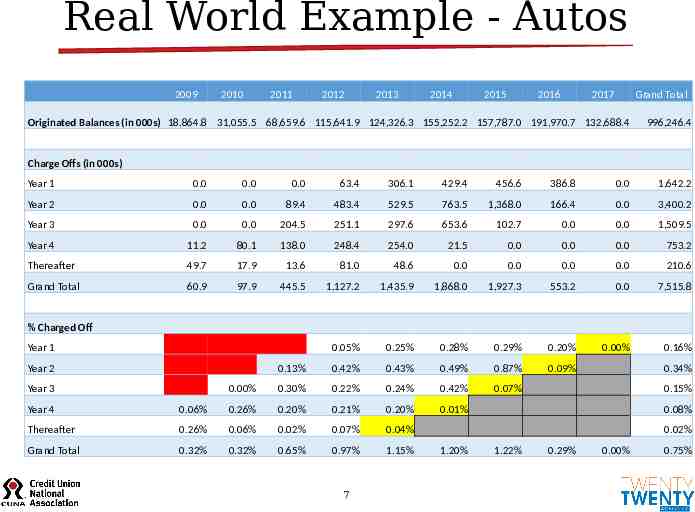
Real World Example - Autos 2009 2010 2011 2012 2013 2014 2015 2016 2017 Grand Total Originated Balances (in 000s) 18,864.8 31,055.5 68,659.6 115,641.9 124,326.3 155,252.2 157,787.0 191,970.7 132,688.4 996,246.4 Charge Offs (in 000s) Year 1 0.0 0.0 0.0 63.4 306.1 429.4 456.6 386.8 0.0 1,642.2 Year 2 0.0 0.0 89.4 483.4 529.5 763.5 1,368.0 166.4 0.0 3,400.2 Year 3 0.0 0.0 204.5 251.1 297.6 653.6 102.7 0.0 0.0 1,509.5 Year 4 11.2 80.1 138.0 248.4 254.0 21.5 0.0 0.0 0.0 753.2 Thereafter 49.7 17.9 13.6 81.0 48.6 0.0 0.0 0.0 0.0 210.6 Grand Total 60.9 97.9 445.5 1,127.2 1,435.9 1,868.0 1,927.3 553.2 0.0 7,515.8 0.05% 0.25% 0.28% 0.29% 0.20% 0.00% 0.16% 0.13% 0.42% 0.43% 0.49% 0.87% 0.09% 0.00% 0.30% 0.22% 0.24% 0.42% 0.07% 0.01% % Charged Off Year 1 Year 2 Year 3 Year 4 0.06% 0.26% 0.20% 0.21% 0.20% Thereafter 0.26% 0.06% 0.02% 0.07% 0.04% Grand Total 0.32% 0.32% 0.65% 0.97% 1.15% 7 0.34% 0.15% 0.08% 0.02% 1.20% 1.22% 0.29% 0.00% 0.75%
Real World Example 8
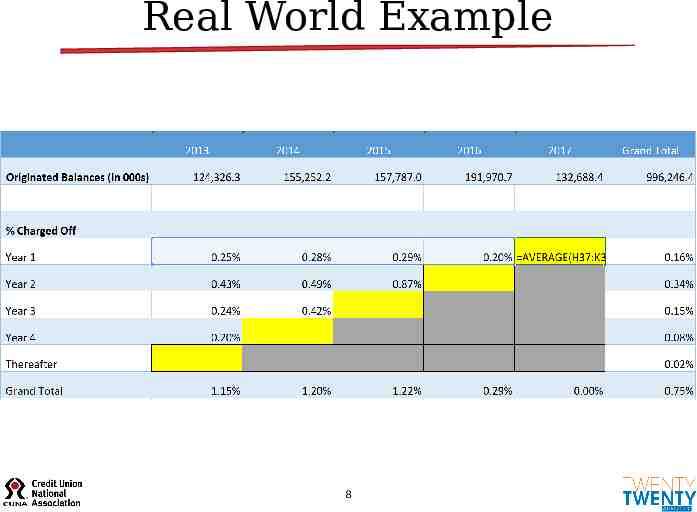
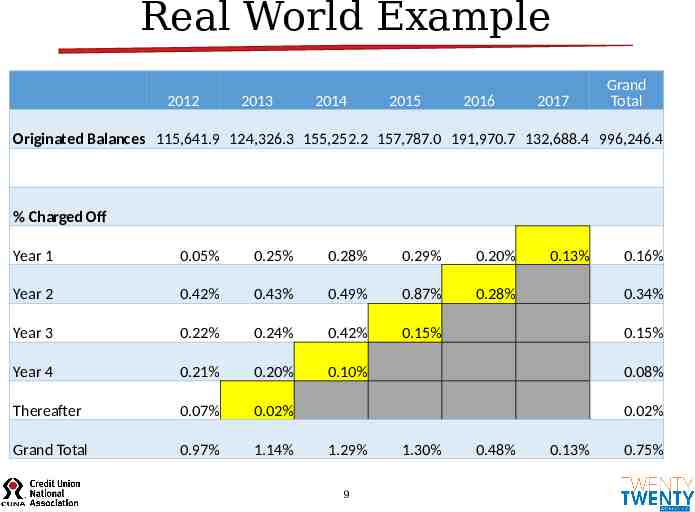
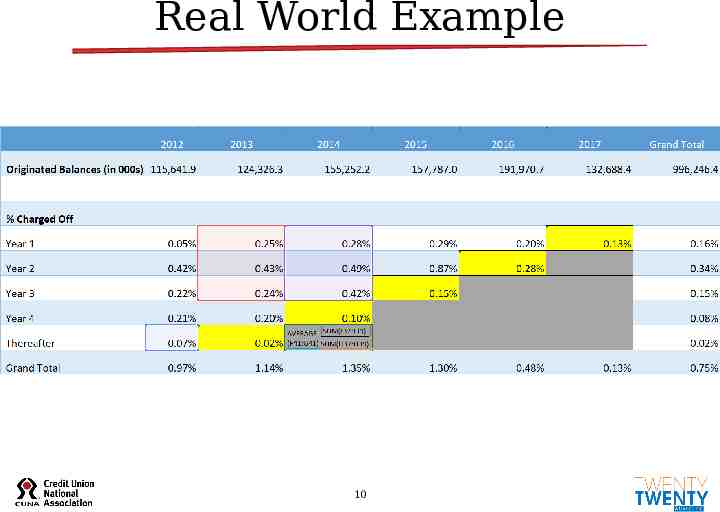
Real World Example 2012 2013 2014 2015 2016 2017 Grand Total Originated Balances 115,641.9 124,326.3 155,252.2 157,787.0 191,970.7 132,688.4 996,246.4 % Charged Off Year 1 0.05% 0.25% 0.28% 0.29% 0.20% Year 2 0.42% 0.43% 0.49% 0.87% 0.28% Year 3 0.22% 0.24% 0.42% 0.15% Year 4 0.21% 0.20% 0.10% Thereafter 0.07% 0.02% Grand Total 0.97% 1.14% 0.13% 0.16% 0.34% 0.15% 0.08% 0.02% 1.29% 9 1.30% 0.48% 0.13% 0.75%
Real World Example 10
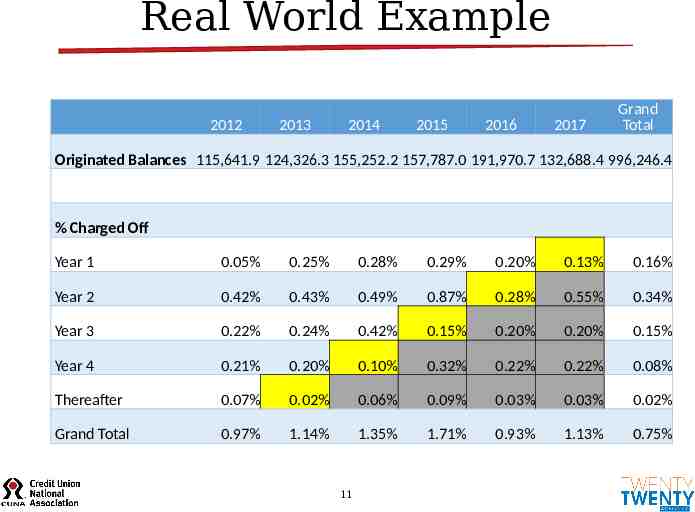
Real World Example 2012 2013 2014 2015 2016 2017 Grand Total Originated Balances 115,641.9 124,326.3 155,252.2 157,787.0 191,970.7 132,688.4 996,246.4 % Charged Off Year 1 0.05% 0.25% 0.28% 0.29% 0.20% 0.13% 0.16% Year 2 0.42% 0.43% 0.49% 0.87% 0.28% 0.55% 0.34% Year 3 0.22% 0.24% 0.42% 0.15% 0.20% 0.20% 0.15% Year 4 0.21% 0.20% 0.10% 0.32% 0.22% 0.22% 0.08% Thereafter 0.07% 0.02% 0.06% 0.09% 0.03% 0.03% 0.02% Grand Total 0.97% 1.14% 1.35% 1.71% 0.93% 1.13% 0.75% 11
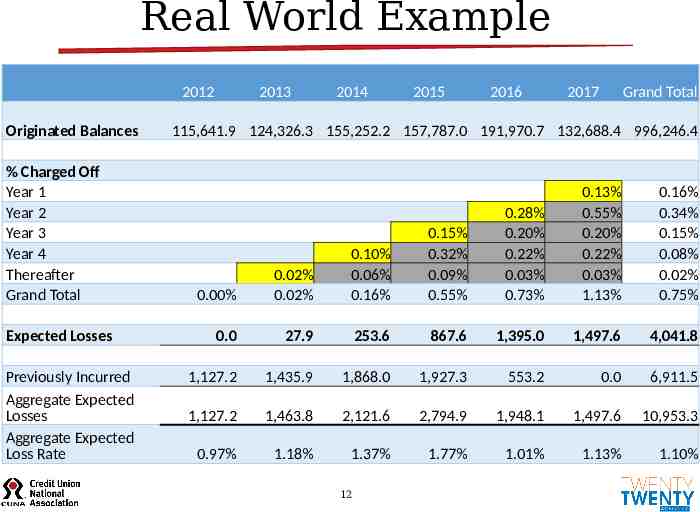
Real World Example 2012 Originated Balances % Charged Off Year 1 Year 2 Year 3 Year 4 Thereafter Grand Total Expected Losses Previously Incurred Aggregate Expected Losses Aggregate Expected Loss Rate 2013 2014 2015 2016 2017 Grand Total 115,641.9 124,326.3 155,252.2 157,787.0 191,970.7 132,688.4 996,246.4 0.00% 0.02% 0.02% 0.10% 0.06% 0.16% 0.15% 0.32% 0.09% 0.55% 0.28% 0.20% 0.22% 0.03% 0.73% 0.13% 0.55% 0.20% 0.22% 0.03% 1.13% 0.16% 0.34% 0.15% 0.08% 0.02% 0.75% 0.0 27.9 253.6 867.6 1,395.0 1,497.6 4,041.8 1,127.2 1,435.9 1,868.0 1,927.3 553.2 0.0 6,911.5 1,127.2 1,463.8 2,121.6 2,794.9 1,948.1 1,497.6 10,953.3 0.97% 1.18% 1.37% 1.77% 1.01% 1.13% 1.10% 12
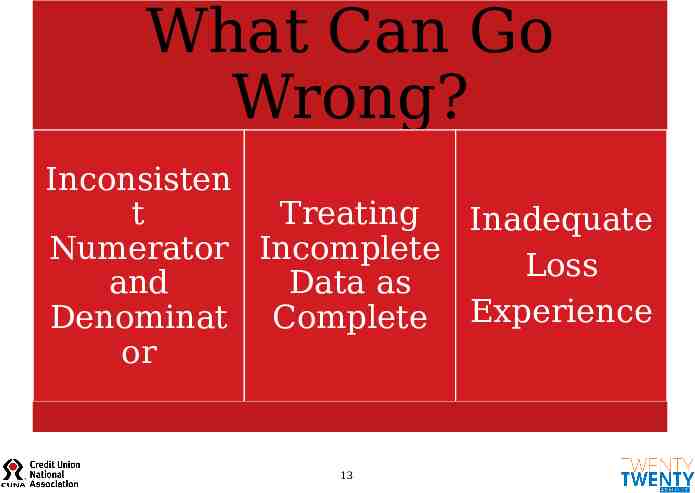
What Can Go Wrong? Inconsisten t Treating Inadequate Numerator Incomplete Loss and Data as Denominat Complete Experience or 13
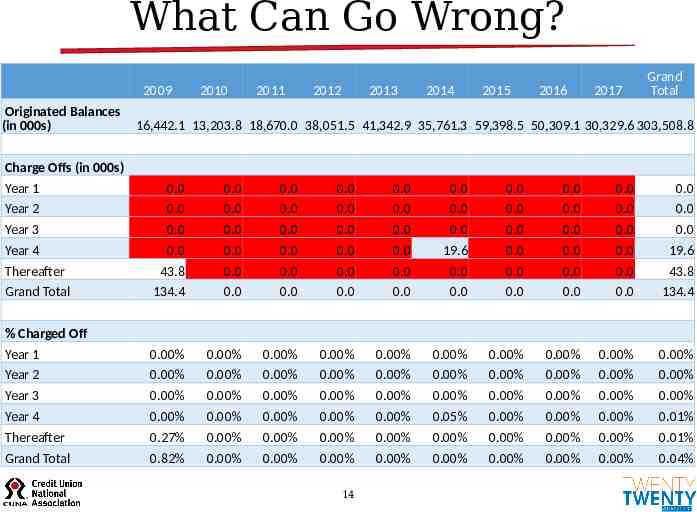
What Can Go Wrong? 2009 Originated Balances (in 000s) 2010 2011 2012 2013 2014 2015 2016 2017 Grand Total 16,442.1 13,203.8 18,670.0 38,051.5 41,342.9 35,761.3 59,398.5 50,309.1 30,329.6 303,508.8 Charge Offs (in 000s) Year 1 Year 2 Year 3 Year 4 Thereafter Grand Total 0.0 0.0 0.0 0.0 43.8 134.4 0.0 0.0 0.0 0.0 0.0 0.0 0.0 0.0 0.0 0.0 0.0 0.0 0.0 0.0 0.0 0.0 0.0 0.0 0.0 0.0 0.0 0.0 0.0 0.0 0.0 0.0 0.0 19.6 0.0 0.0 0.0 0.0 0.0 0.0 0.0 0.0 0.0 0.0 0.0 0.0 0.0 0.0 0.0 0.0 0.0 0.0 0.0 0.0 0.0 0.0 0.0 19.6 43.8 134.4 % Charged Off Year 1 Year 2 Year 3 Year 4 Thereafter 0.00% 0.00% 0.00% 0.00% 0.27% 0.00% 0.00% 0.00% 0.00% 0.00% 0.00% 0.00% 0.00% 0.00% 0.00% 0.00% 0.00% 0.00% 0.00% 0.00% 0.00% 0.00% 0.00% 0.00% 0.00% 0.00% 0.00% 0.00% 0.05% 0.00% 0.00% 0.00% 0.00% 0.00% 0.00% 0.00% 0.00% 0.00% 0.00% 0.00% 0.00% 0.00% 0.00% 0.00% 0.00% 0.00% 0.00% 0.00% 0.01% 0.01% Grand Total 0.82% 0.00% 0.00% 0.00% 0.00% 0.00% 0.00% 0.00% 0.00% 0.04% 14
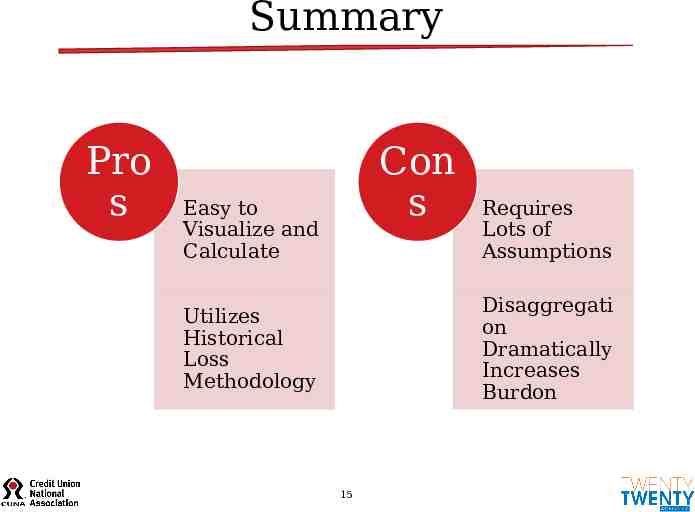
Summary Pro s Con s Easy to Visualize and Calculate Requires Lots of Assumptions Disaggregati on Dramatically Increases Burdon Utilizes Historical Loss Methodology 15
Thank You! Questions? Dan Price President Twenty Twenty Analytics [email protected] (352) 634-0042 16