Create or customiz e dashboar ds Make the data that matters easily
28 Slides1.29 MB
Create or customiz e dashboar ds Make the data that matters easily accessible to your teams for admins
making data meaningful “Information is the oil of the 21st century, and analytics is the combustion engine.” - Peter Sondergaard, senior vice president at Gartner Information is the lifeblood of businesses. But business information is only meaningful if it’s presented in a way that sales, marketing, and service teams can easily understand and act on. Dashboards provide the vehicle to uncover and visualize your most important information— the data that matters—so your teams can make quick and informed decisions.
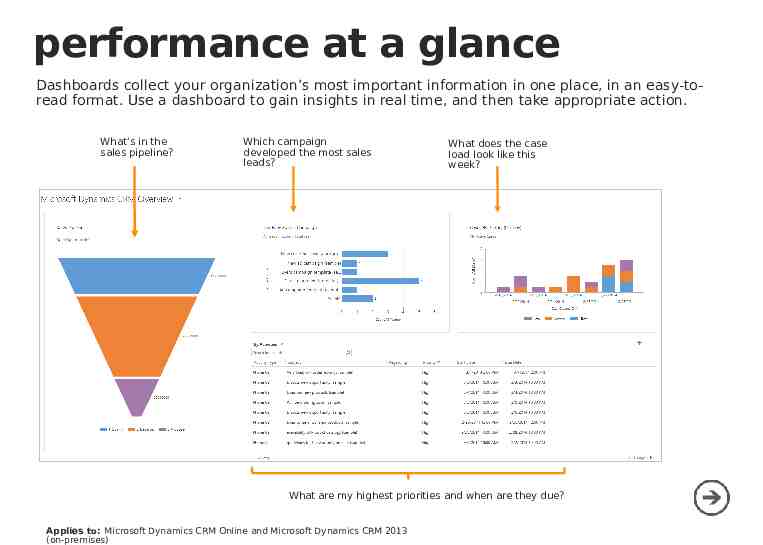
performance at a glance Dashboards collect your organization’s most important information in one place, in an easy-toread format. Use a dashboard to gain insights in real time, and then take appropriate action. What’s in the sales pipeline? Which campaign developed the most sales leads? What does the case load look like this week? What are my highest priorities and when are they due? Applies to: Microsoft Dynamics CRM Online and Microsoft Dynamics CRM 2013 (on-premises)
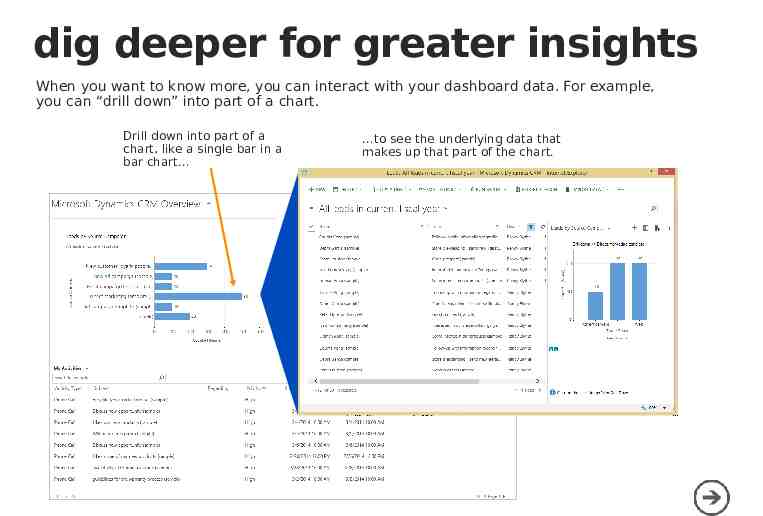
dig deeper for greater insights When you want to know more, you can interact with your dashboard data. For example, you can “drill down” into part of a chart. Drill down into part of a chart, like a single bar in a bar chart to see the underlying data that makes up that part of the chart.
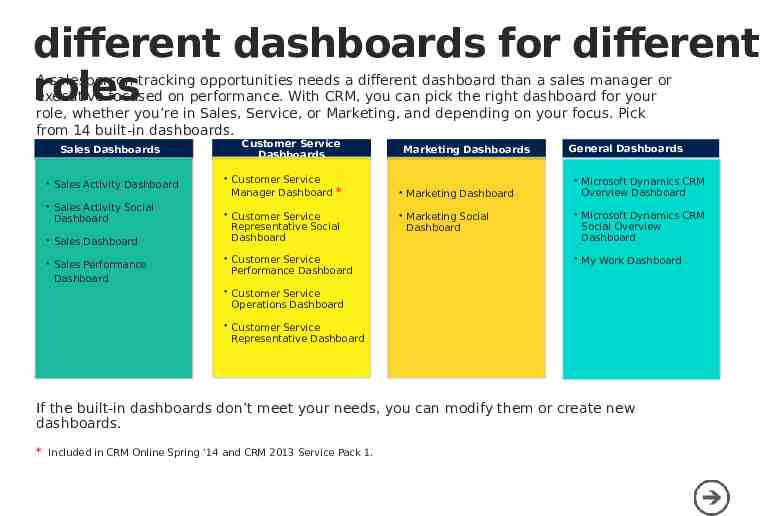
different dashboards for different roles A salesperson tracking opportunities needs a different dashboard than a sales manager or executive focused on performance. With CRM, you can pick the right dashboard for your role, whether you’re in Sales, Service, or Marketing, and depending on your focus. Pick from 14 built-in dashboards. Sales Dashboards Sales Activity Dashboard Sales Activity Social Dashboard Sales Dashboard Sales Performance Dashboard Customer Service Dashboards Customer Service Manager Dashboard * Customer Service Representative Social Dashboard Customer Service Performance Dashboard Marketing Dashboards Marketing Dashboard Marketing Social Dashboard General Dashboards Microsoft Dynamics CRM Overview Dashboard Microsoft Dynamics CRM Social Overview Dashboard My Work Dashboard Customer Service Operations Dashboard Customer Service Representative Dashboard If the built-in dashboards don’t meet your needs, you can modify them or create new dashboards. * Included in CRM Online Spring ’14 and CRM 2013 Service Pack 1.
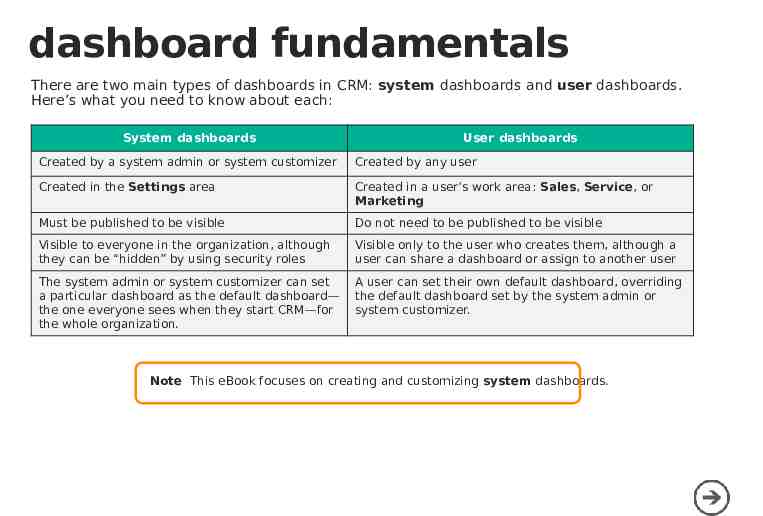
dashboard fundamentals There are two main types of dashboards in CRM: system dashboards and user dashboards. Here’s what you need to know about each: System dashboards User dashboards Created by a system admin or system customizer Created by any user Created in the Settings area Created in a user’s work area: Sales, Service, or Marketing Must be published to be visible Do not need to be published to be visible Visible to everyone in the organization, although they can be “hidden” by using security roles Visible only to the user who creates them, although a user can share a dashboard or assign to another user The system admin or system customizer can set a particular dashboard as the default dashboard— the one everyone sees when they start CRM—for the whole organization. A user can set their own default dashboard, overriding the default dashboard set by the system admin or system customizer. Note This eBook focuses on creating and customizing system dashboards.
creating or modifying a system dashboard The Sales team at Contoso has requested a change to the Sales Dashboard—a system dashboard. They’ve decided it’s more important to see their monthly sales totals than their active accounts. They also want to compare their actual sales to sales estimates to see how well they’re doing. We’ll modify the Sales Dashboard in this example to meet the needs of the Sales team.
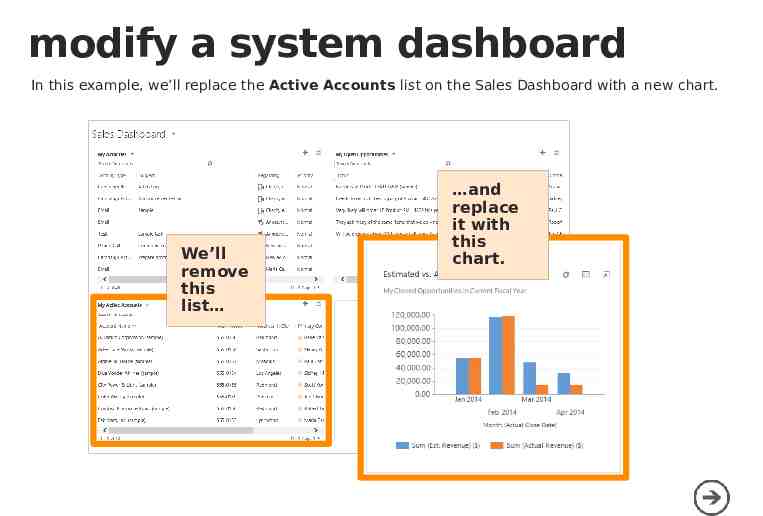
modify a system dashboard In this example, we’ll replace the Active Accounts list on the Sales Dashboard with a new chart. We’ll remove this list and replace it with this chart.
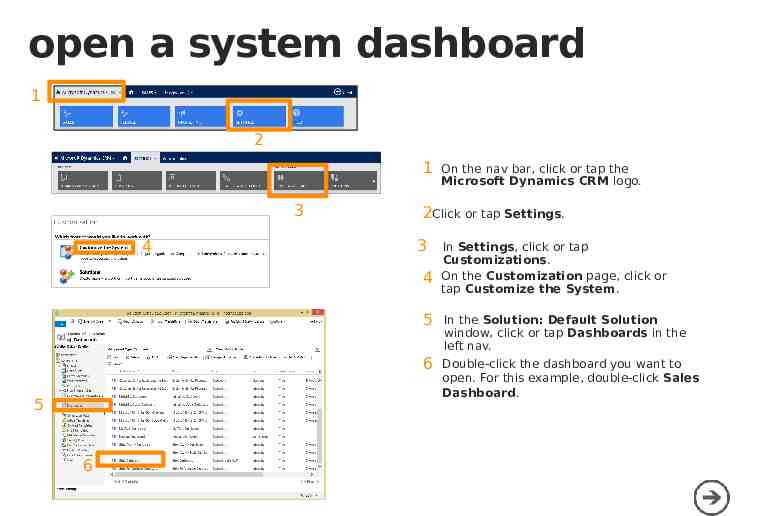
open a system dashboard 1 2 1 3 4 2Click or tap Settings. 3 4 5 6 On the nav bar, click or tap the Microsoft Dynamics CRM logo. In Settings, click or tap Customizations. On the Customization page, click or tap Customize the System. 5 In the Solution: Default Solution window, click or tap Dashboards in the left nav. 6 Double-click the dashboard you want to open. For this example, double-click Sales Dashboard.
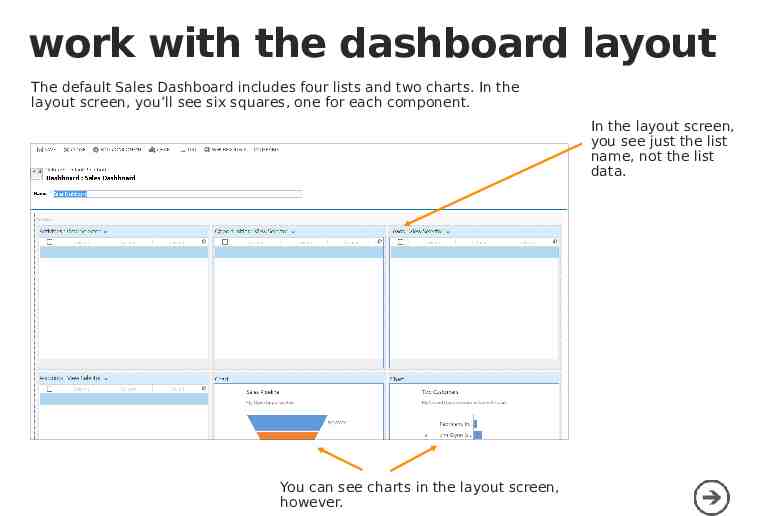
work with the dashboard layout The default Sales Dashboard includes four lists and two charts. In the layout screen, you’ll see six squares, one for each component. In the layout screen, you see just the list name, not the list data. You can see charts in the layout screen, however.
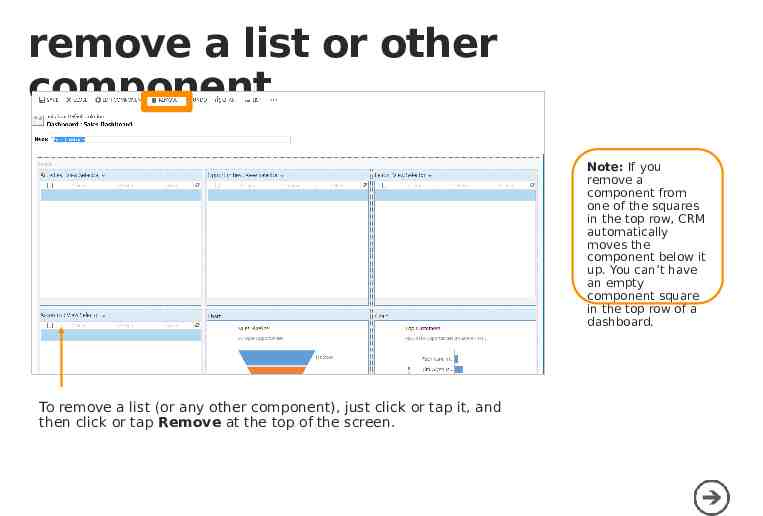
remove a list or other component Note: If you remove a component from one of the squares in the top row, CRM automatically moves the component below it up. You can’t have an empty component square in the top row of a dashboard. To remove a list (or any other component), just click or tap it, and then click or tap Remove at the top of the screen.
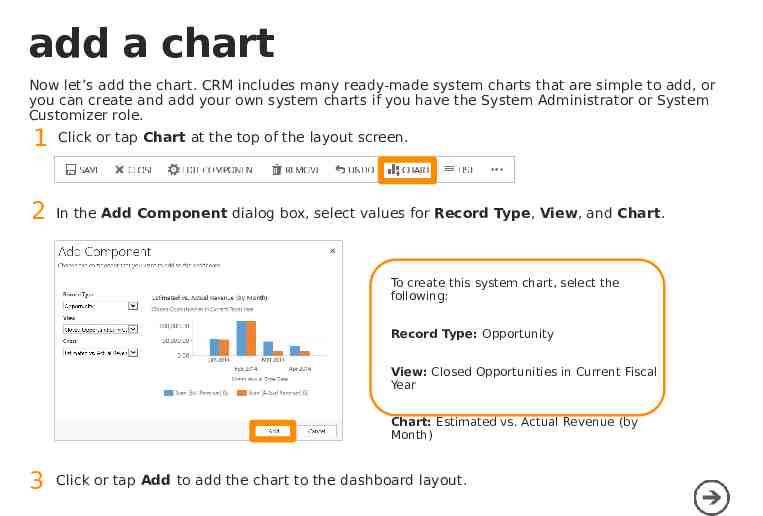
add a chart Now let’s add the chart. CRM includes many ready-made system charts that are simple to add, or you can create and add your own system charts if you have the System Administrator or System Customizer role. 1 Click or tap Chart at the top of the layout screen. 2 In the Add Component dialog box, select values for Record Type, View, and Chart. To create this system chart, select the following: Record Type: Opportunity View: Closed Opportunities in Current Fiscal Year Chart: Estimated vs. Actual Revenue (by Month) 3 Click or tap Add to add the chart to the dashboard layout.
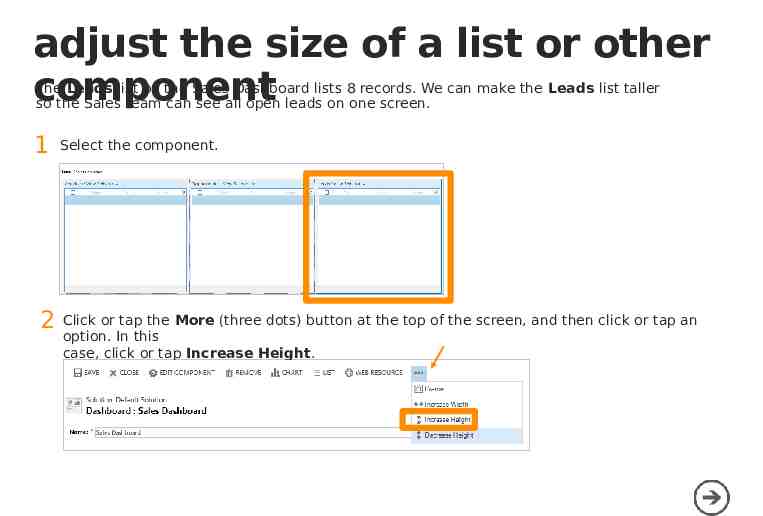
adjust the size of a list or other component The Leads list on the Sales Dashboard lists 8 records. We can make the Leads list taller so the Sales team can see all open leads on one screen. 1 2 Select the component. Click or tap the More (three dots) button at the top of the screen, and then click or tap an option. In this case, click or tap Increase Height.
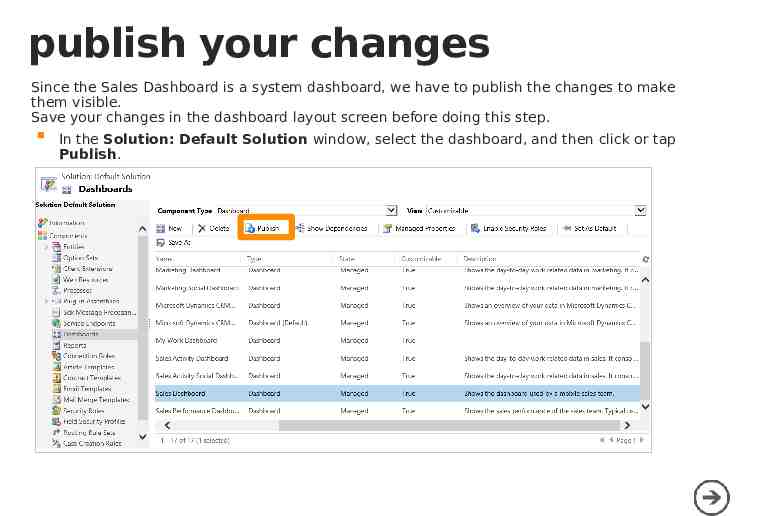
publish your changes Since the Sales Dashboard is a system dashboard, we have to publish the changes to make them visible. Save your changes in the dashboard layout screen before doing this step. In the Solution: Default Solution window, select the dashboard, and then click or tap Publish.
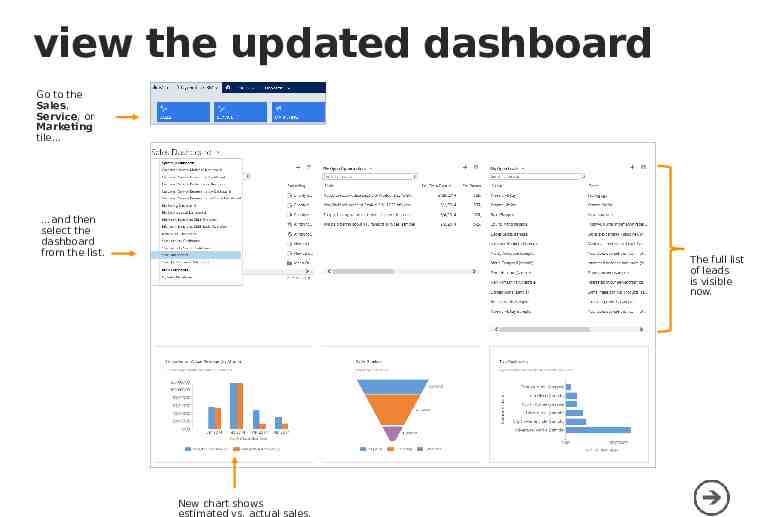
view the updated dashboard Go to the Sales, Service, or Marketing tile and then select the dashboard from the list. The full list of leads is visible now. New chart shows estimated vs. actual sales.
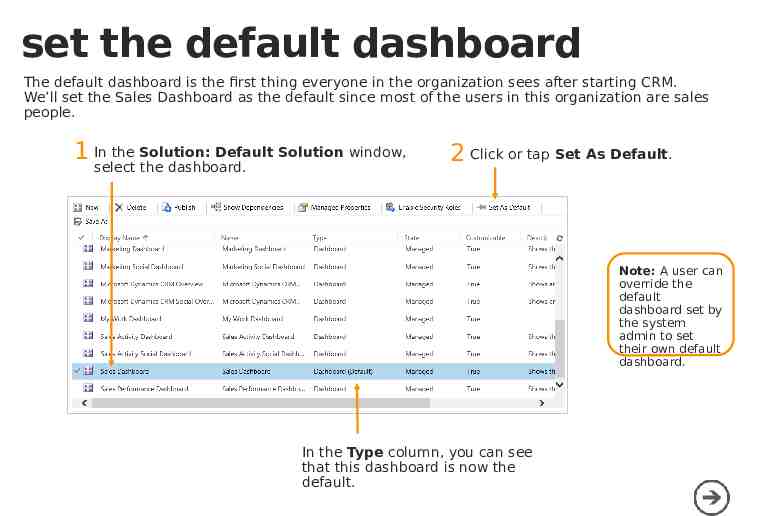
set the default dashboard The default dashboard is the first thing everyone in the organization sees after starting CRM. We’ll set the Sales Dashboard as the default since most of the users in this organization are sales people. 1 In the Solution: Default Solution window, select the dashboard. 2 Click or tap Set As Default. Note: A user can override the default dashboard set by the system admin to set their own default dashboard. In the Type column, you can see that this dashboard is now the default.
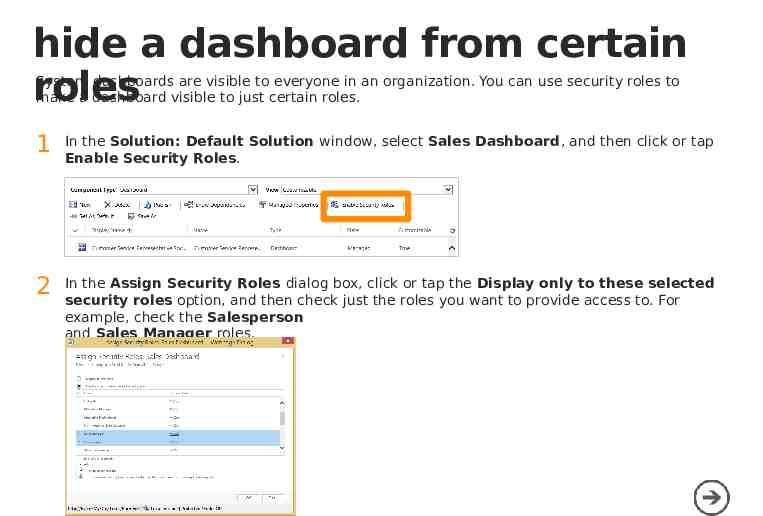
hide a dashboard from certain roles System dashboards are visible to everyone in an organization. You can use security roles to make a dashboard visible to just certain roles. 1 In the Solution: Default Solution window, select Sales Dashboard, and then click or tap Enable Security Roles. 2 In the Assign Security Roles dialog box, click or tap the Display only to these selected security roles option, and then check just the roles you want to provide access to. For example, check the Salesperson and Sales Manager roles.
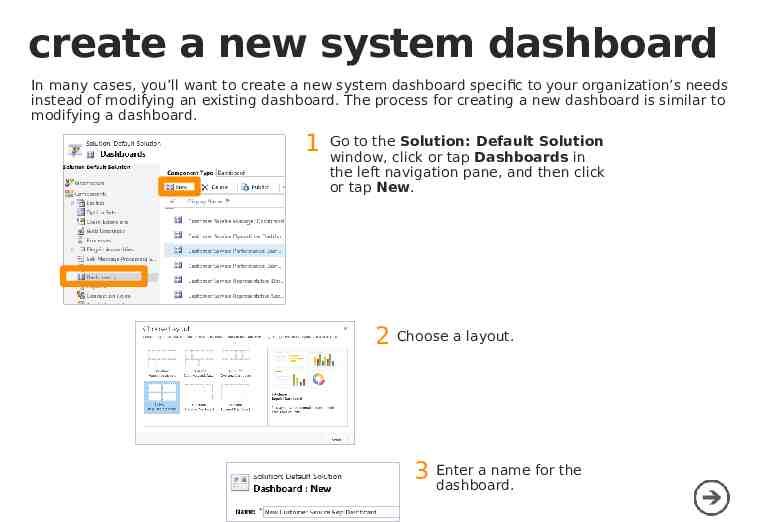
create a new system dashboard In many cases, you’ll want to create a new system dashboard specific to your organization’s needs instead of modifying an existing dashboard. The process for creating a new dashboard is similar to modifying a dashboard. 1 Go to the Solution: Default Solution window, click or tap Dashboards in the left navigation pane, and then click or tap New. 2 Choose a layout. a name for the 3 Enter dashboard.
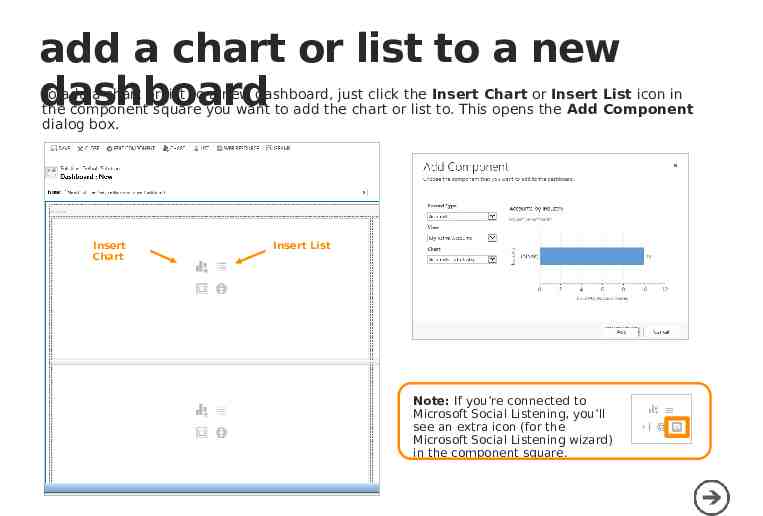
add a chart or list to a new dashboard To add a chart or list to a new dashboard, just click the Insert Chart or Insert List icon in the component square you want to add the chart or list to. This opens the Add Component dialog box. Insert Chart Insert List Note: If you’re connected to Microsoft Social Listening, you’ll see an extra icon (for the Microsoft Social Listening wizard) in the component square.
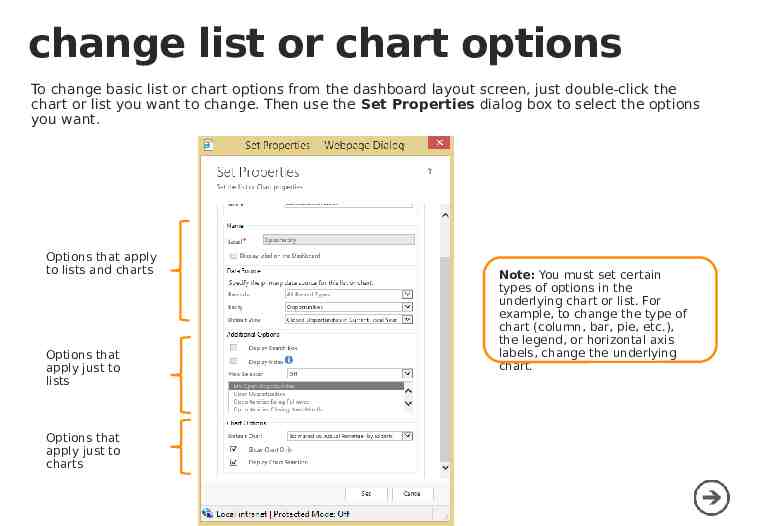
change list or chart options To change basic list or chart options from the dashboard layout screen, just double-click the chart or list you want to change. Then use the Set Properties dialog box to select the options you want. Options that apply to lists and charts Options that apply just to lists Options that apply just to charts Note: You must set certain types of options in the underlying chart or list. For example, to change the type of chart (column, bar, pie, etc.), the legend, or horizontal axis labels, change the underlying chart.
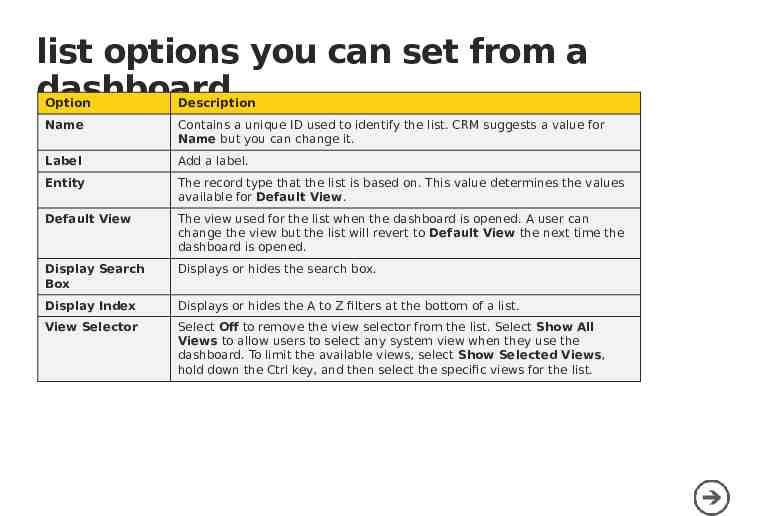
list options you can set from a dashboard Option Description Name Contains a unique ID used to identify the list. CRM suggests a value for Name but you can change it. Label Add a label. Entity The record type that the list is based on. This value determines the values available for Default View. Default View The view used for the list when the dashboard is opened. A user can change the view but the list will revert to Default View the next time the dashboard is opened. Display Search Box Displays or hides the search box. Display Index Displays or hides the A to Z filters at the bottom of a list. View Selector Select Off to remove the view selector from the list. Select Show All Views to allow users to select any system view when they use the dashboard. To limit the available views, select Show Selected Views, hold down the Ctrl key, and then select the specific views for the list.
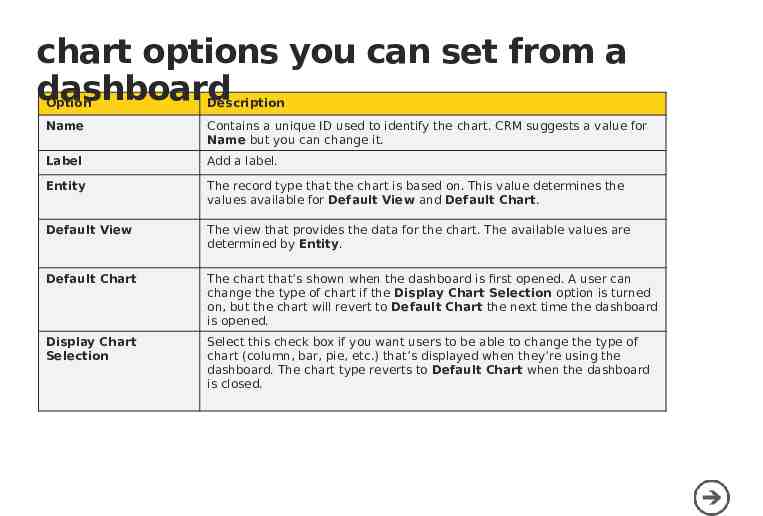
chart options you can set from a dashboard Option Description Name Contains a unique ID used to identify the chart. CRM suggests a value for Name but you can change it. Label Add a label. Entity The record type that the chart is based on. This value determines the values available for Default View and Default Chart. Default View The view that provides the data for the chart. The available values are determined by Entity. Default Chart The chart that’s shown when the dashboard is first opened. A user can change the type of chart if the Display Chart Selection option is turned on, but the chart will revert to Default Chart the next time the dashboard is opened. Display Chart Selection Select this check box if you want users to be able to change the type of chart (column, bar, pie, etc.) that’s displayed when they’re using the dashboard. The chart type reverts to Default Chart when the dashboard is closed.
what else can you do with dashboards? It’s easy to add lists and charts to your CRM dashboards, but what if you want to go beyond standard lists and charts? CRM provides flexible tools that enable you to do many amazing things with your dashboards.
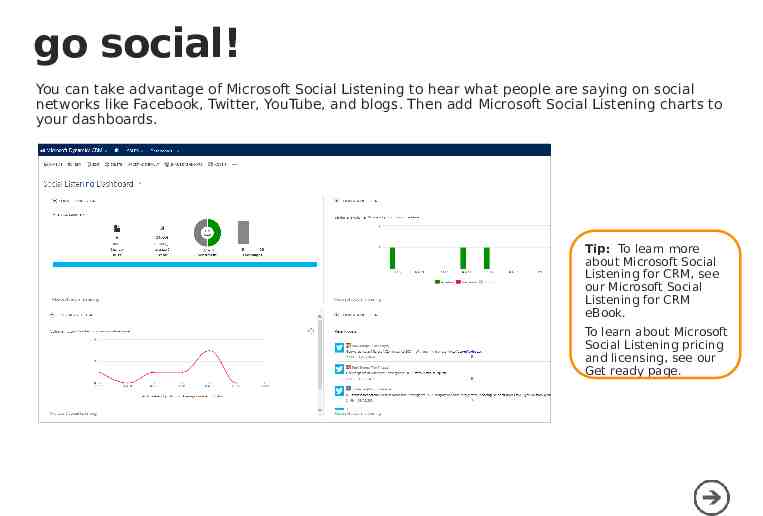
go social! You can take advantage of Microsoft Social Listening to hear what people are saying on social networks like Facebook, Twitter, YouTube, and blogs. Then add Microsoft Social Listening charts to your dashboards. Tip: To learn more about Microsoft Social Listening for CRM, see our Microsoft Social Listening for CRM eBook. To learn about Microsoft Social Listening pricing and licensing, see our Get ready page.
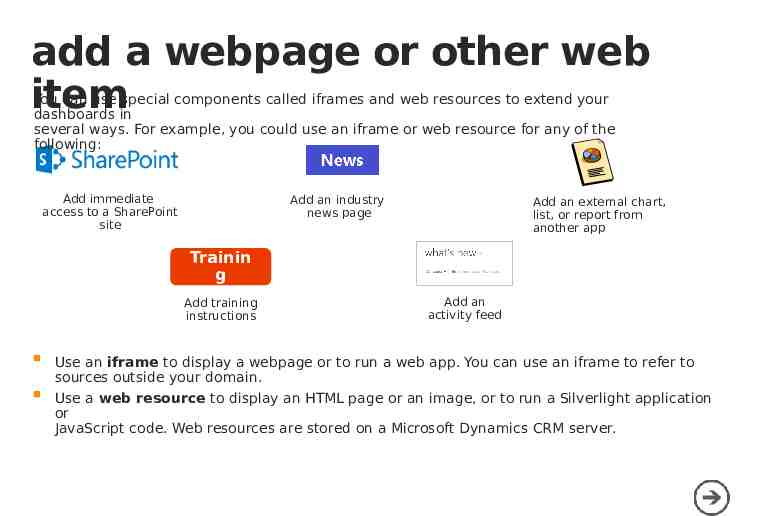
add a webpage or other web item You can use special components called iframes and web resources to extend your dashboards in several ways. For example, you could use an iframe or web resource for any of the following: Add immediate access to a SharePoint site Add an industry news page Add an external chart, list, or report from another app Trainin g Add training instructions Add an activity feed Use an iframe to display a webpage or to run a web app. You can use an iframe to refer to sources outside your domain. Use a web resource to display an HTML page or an image, or to run a Silverlight application or JavaScript code. Web resources are stored on a Microsoft Dynamics CRM server.
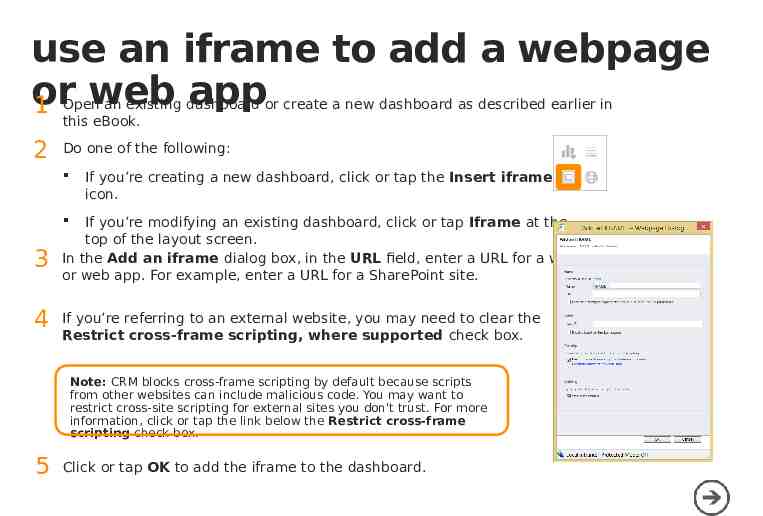
use an iframe to add a webpage or web app 1 Open an existing dashboard or create a new dashboard as described earlier in this eBook. 2 Do one of the following: If you’re creating a new dashboard, click or tap the Insert iframe icon. If you’re modifying an existing dashboard, click or tap Iframe at the top of the layout screen. In the Add an iframe dialog box, in the URL field, enter a URL for a webpage or web app. For example, enter a URL for a SharePoint site. 3 4 If you’re referring to an external website, you may need to clear the Restrict cross-frame scripting, where supported check box. Note: CRM blocks cross-frame scripting by default because scripts from other websites can include malicious code. You may want to restrict cross-site scripting for external sites you don't trust. For more information, click or tap the link below the Restrict cross-frame scripting check box. 5 Click or tap OK to add the iframe to the dashboard.
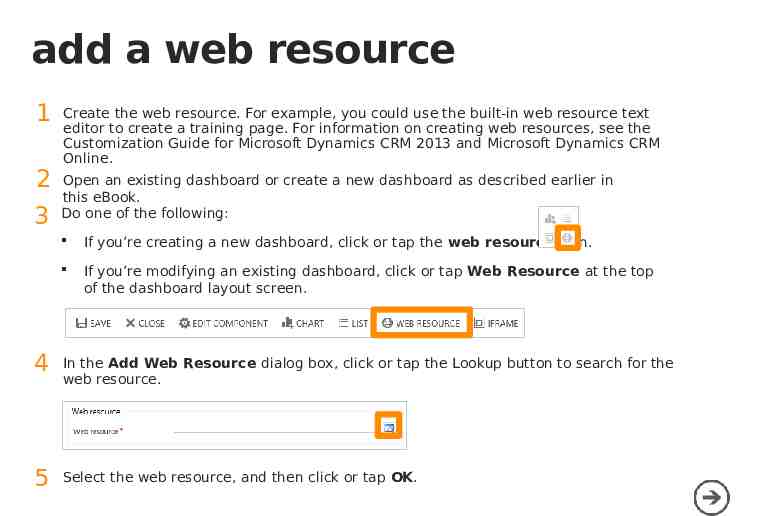
add a web resource 1 2 3 Create the web resource. For example, you could use the built-in web resource text editor to create a training page. For information on creating web resources, see the Customization Guide for Microsoft Dynamics CRM 2013 and Microsoft Dynamics CRM Online. Open an existing dashboard or create a new dashboard as described earlier in this eBook. Do one of the following: If you’re creating a new dashboard, click or tap the web resource icon. If you’re modifying an existing dashboard, click or tap Web Resource at the top of the dashboard layout screen. 4 In the Add Web Resource dialog box, click or tap the Lookup button to search for the web resource. 5 Select the web resource, and then click or tap OK.
Thanks for reading! Did this eBook help you? Send us a quick note. We’d love to know what you think. Customer Center Version 6.0.1