Cluster analysis Presented by Dr.Chayada Bhadrakom Agricultural and

56 Slides5.93 MB
Cluster analysis Presented by Dr.Chayada Bhadrakom Agricultural and Resource Economics, Kasetsart University
Cluster analysis Lecture / Tutorial outline Cluster analysis Example of cluster analysis Work on SPSS
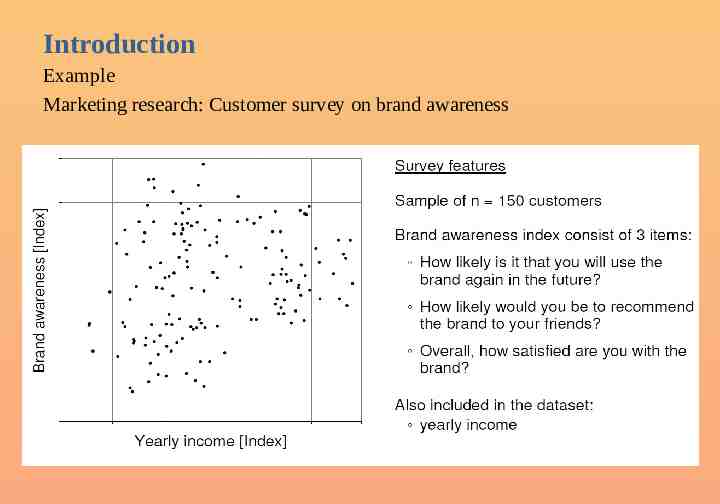
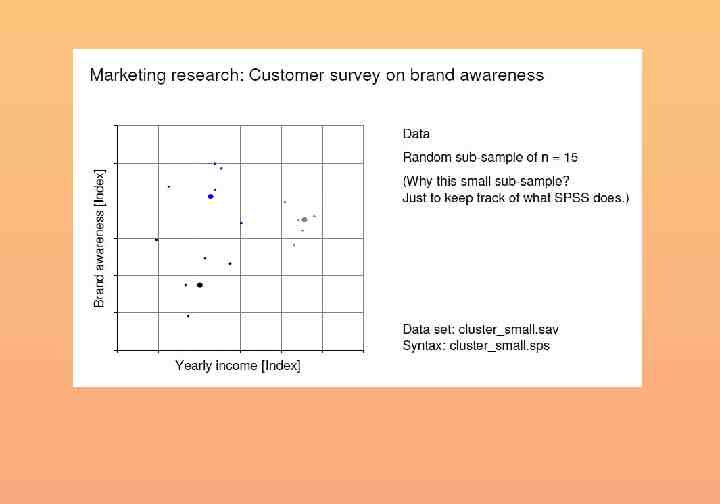
Introduction Example Marketing research: Customer survey on brand awareness
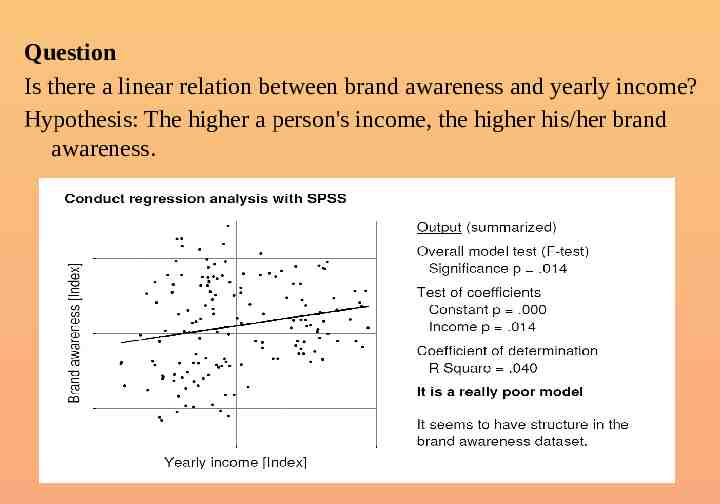
Question Is there a linear relation between brand awareness and yearly income? Hypothesis: The higher a person's income, the higher his/her brand awareness.
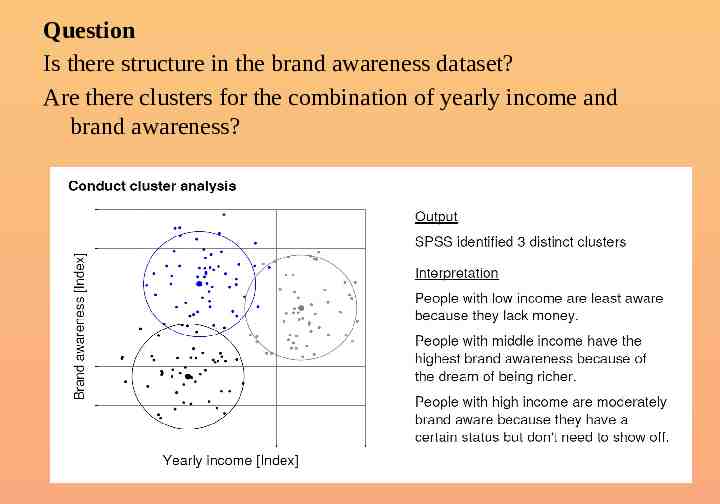
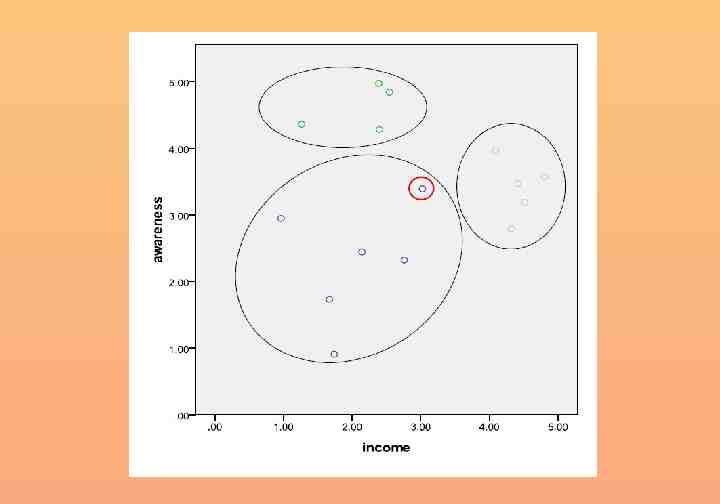
Question Is there structure in the brand awareness dataset? Are there clusters for the combination of yearly income and brand awareness?
Cluster Analysis It is a class of techniques used to classify cases into groups that are relatively homogeneous within themselves and heterogeneous between each other, on the basis of a defined set of variables. These groups are called clusters.
Cluster Analysis and marketing research Market segmentation. E.g. clustering of consumers according to their attribute preferences Understanding buyers behaviours. Consumers with similar behaviours/characteristics are clustered Identifying new product opportunities. Clusters of similar brands/products can help identifying competitors / market opportunities Reducing data. E.g. in preference mapping
Steps to conduct a Cluster Analysis 1. 2. 3. 4. 5. Formulate the problem Select a distance measure Select a clustering algorithm Determine the number of clusters Validate the analysis
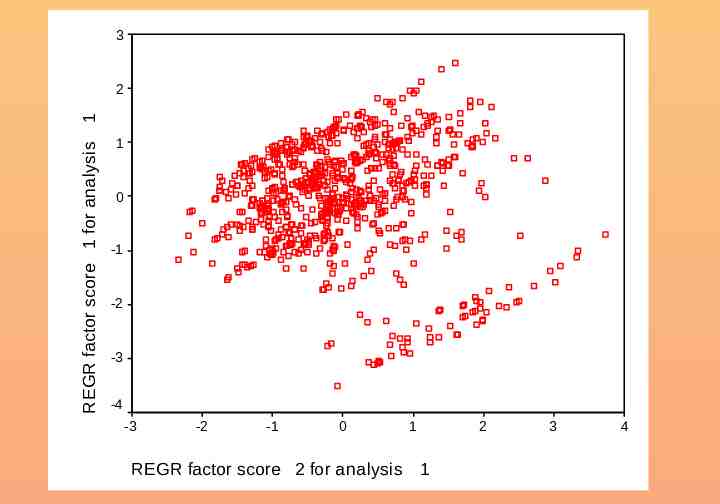
3 REGR factor score 1 for analysis 1 2 1 0 -1 -2 -3 -4 -3 -2 -1 0 REGR factor score 2 for analysis 1 2 1 3 4
Problem Formulation Perhaps the most important part of formulating the clustering problem is selecting the variables on which the clustering is based Basically, the set of variables selected should describe the similarity between objects in terms that are relevant to the marketing research problem The variables should be selected based on past research, theory, or a consideration of the hypotheses being tested. In exploratory research, the researcher should exercise judgment and intuition
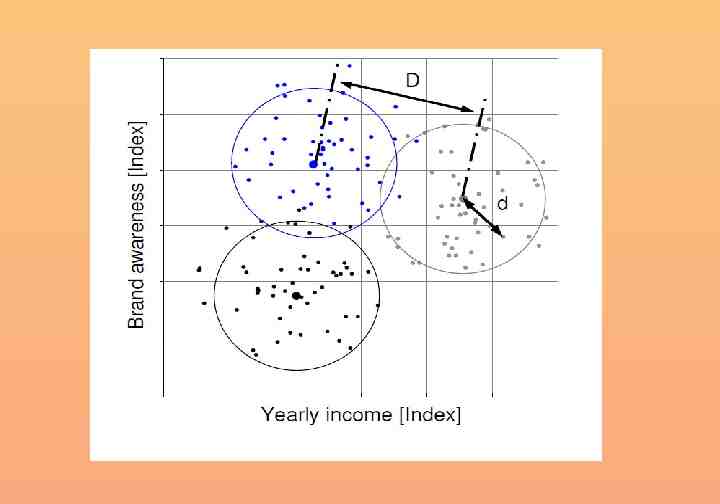
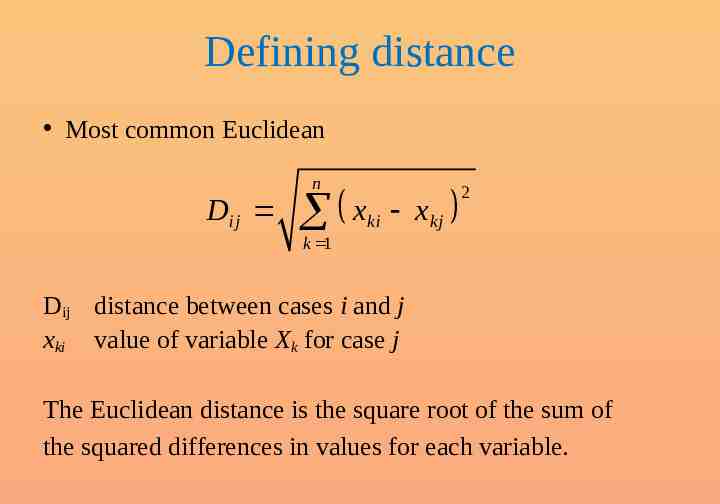
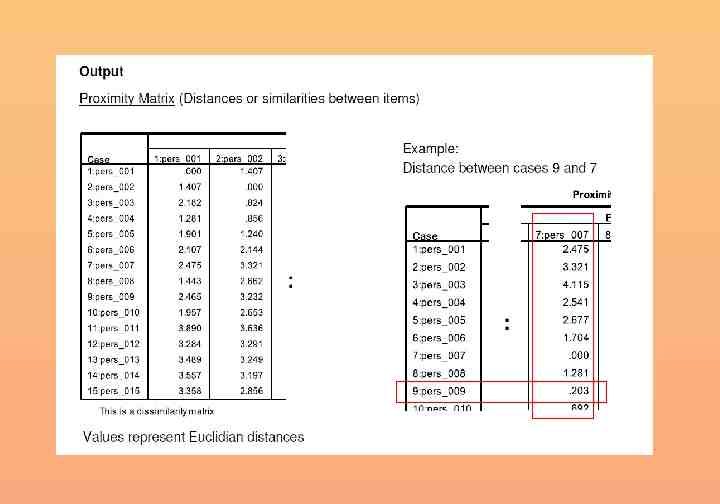
Defining distance Most common Euclidean n Dij x k 1 ki x kj 2 Dij distance between cases i and j xki value of variable Xk for case j The Euclidean distance is the square root of the sum of the squared differences in values for each variable.
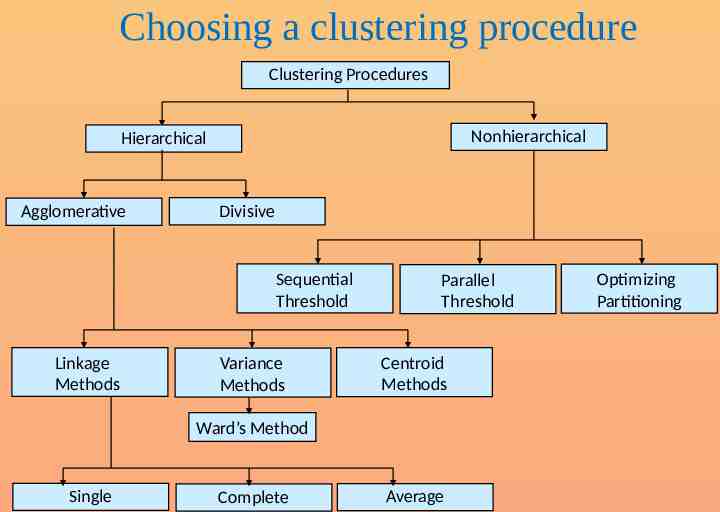
Choosing a clustering procedure Clustering Procedures Nonhierarchical Hierarchical Agglomerative Divisive Sequential Threshold Linkage Methods Variance Methods Parallel Threshold Centroid Methods Ward’s Method Single Complete Average Optimizing Partitioning
Clustering procedures Hierarchical procedures – Agglomerative (start from n clusters, to get to 1 cluster) – Divisive (start from 1 cluster, to get to n cluster) Non hierarchical procedures – K-means clustering
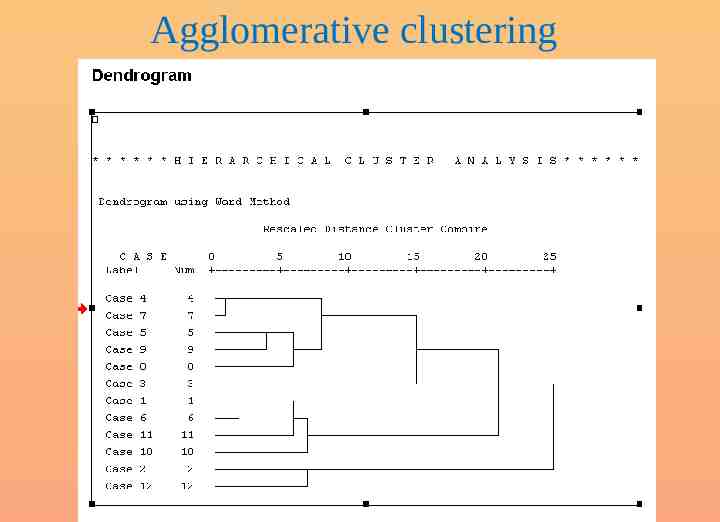
Agglomerative clustering
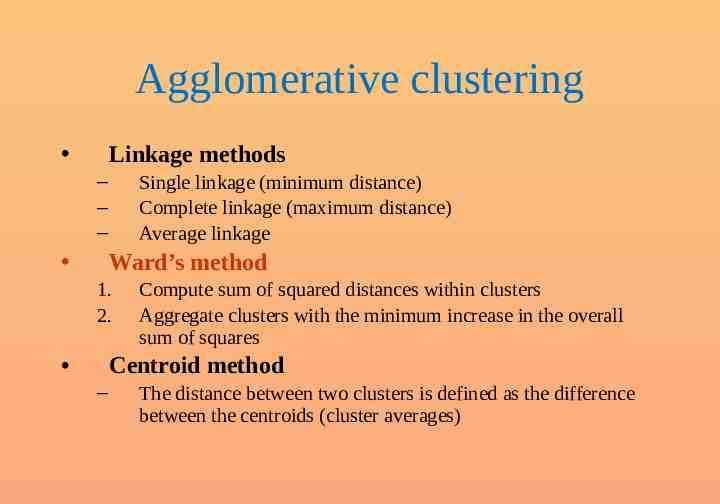
Agglomerative clustering Linkage methods – – – Single linkage (minimum distance) Complete linkage (maximum distance) Average linkage Ward’s method 1. 2. Compute sum of squared distances within clusters Aggregate clusters with the minimum increase in the overall sum of squares Centroid method – The distance between two clusters is defined as the difference between the centroids (cluster averages)
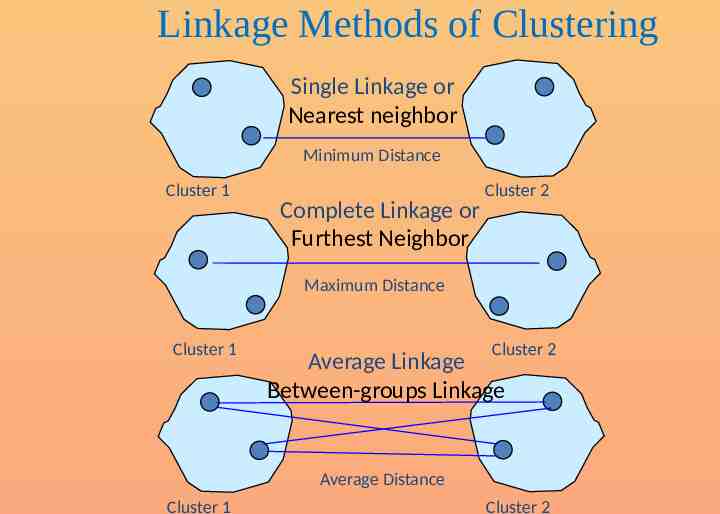
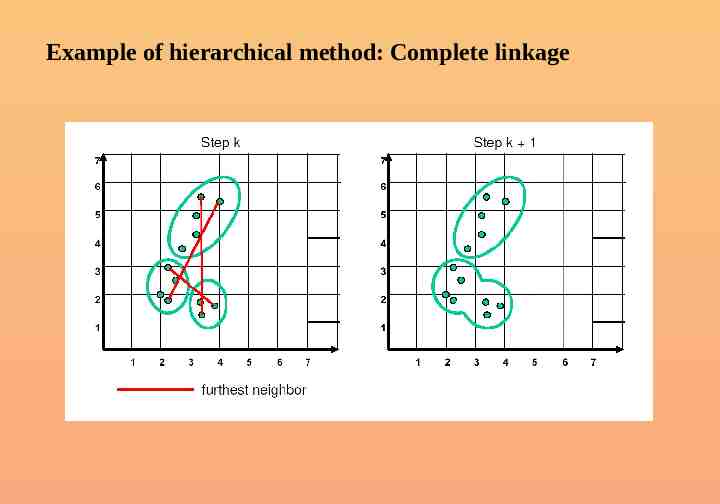
Linkage Methods of Clustering Single Linkage or Nearest neighbor Minimum Distance Cluster 1 Complete Linkage or Furthest Neighbor Cluster 2 Maximum Distance Cluster 1 Cluster 2 Average Linkage Between-groups Linkage Average Distance Cluster 1 Cluster 2
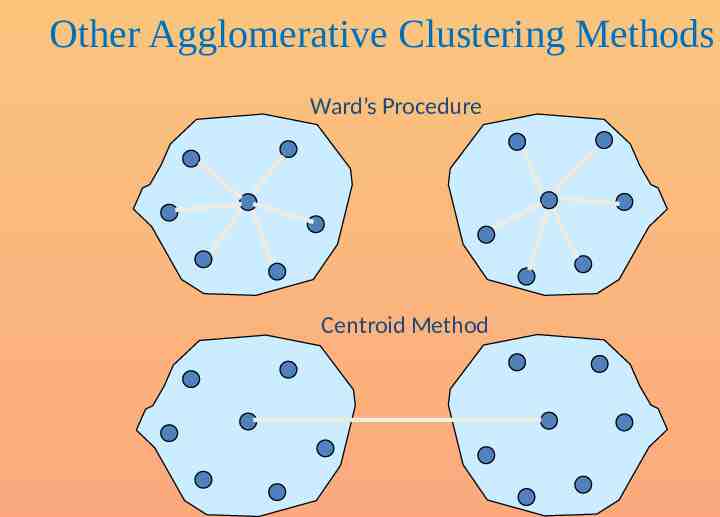
Other Agglomerative Clustering Methods Ward’s Procedure Centroid Method
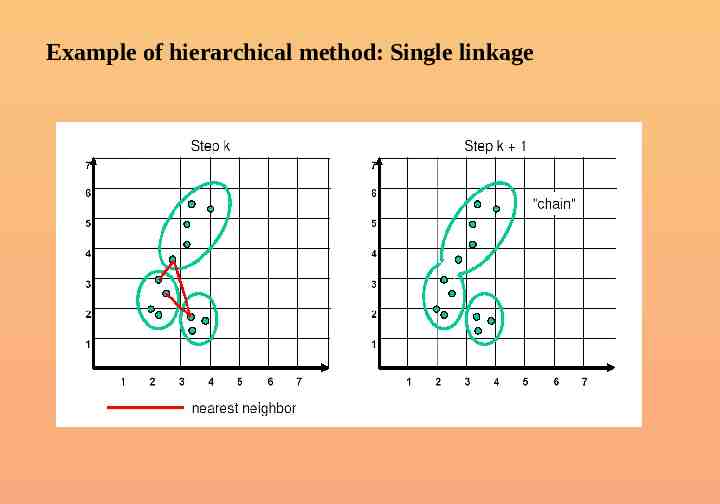
Example of hierarchical method: Single linkage
Example of hierarchical method: Complete linkage
K-means clustering 1. 2. The number k of cluster is fixed An initial set of k “seeds” (aggregation centres) is provided First k elements Other seeds 3. Given a certain treshold, all units are assigned to the nearest cluster seed 4. New seeds are computed 5. Go back to step 3 until no reclassification is necessary Units can be reassigned in successive steps (optimising partioning)
Hierarchical vs Non hierarchical methods Hierarchical clustering No decision about the number of clusters Problems when data contain a high level of error Can be very slow Initial decision are more influential (one-step only) Non hierarchical clustering Faster, more reliable Need to specify the number of clusters (arbitrary) Need to set the initial seeds (arbitrary)
Suggested approach 1. First perform a hierarchical method to define the number of clusters 2. Then use the k-means procedure to actually form the clusters
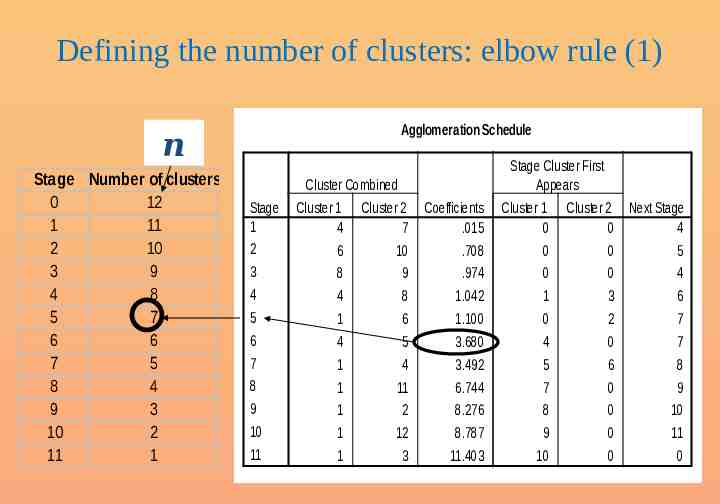
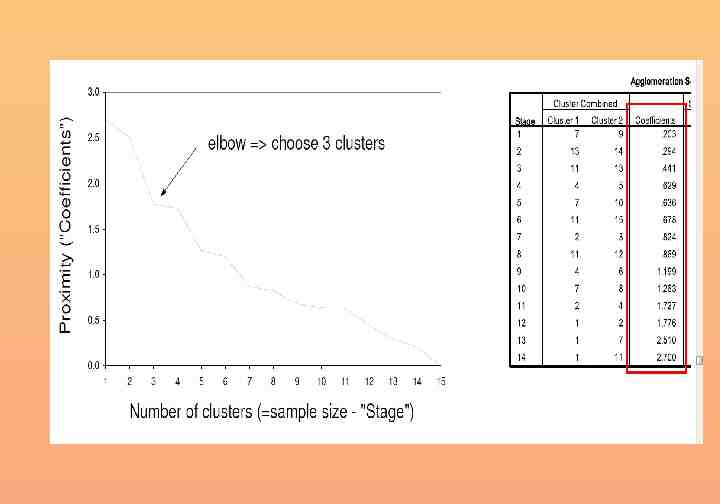
Defining the number of clusters: elbow rule (1) Agglomeration Schedule n Stage Number of clusters 0 12 1 11 2 10 3 9 4 8 5 7 6 6 7 5 8 4 9 3 10 2 11 1 Stage 1 2 3 4 5 6 7 8 9 10 11 Cluster Combined Cluster 1 Cluster 2 Coefficients 4 7 .015 6 10 .708 8 9 .974 4 8 1.042 1 6 1.100 4 5 3.680 1 4 3.492 1 11 6.744 1 2 8.276 1 12 8.787 1 3 11.403 Stage Cluster First Appears Cluster 1 Cluster 2 Next Stage 0 0 4 0 0 5 0 0 4 1 3 6 0 2 7 4 0 7 5 6 8 7 0 9 8 0 10 9 0 11 10 0 0
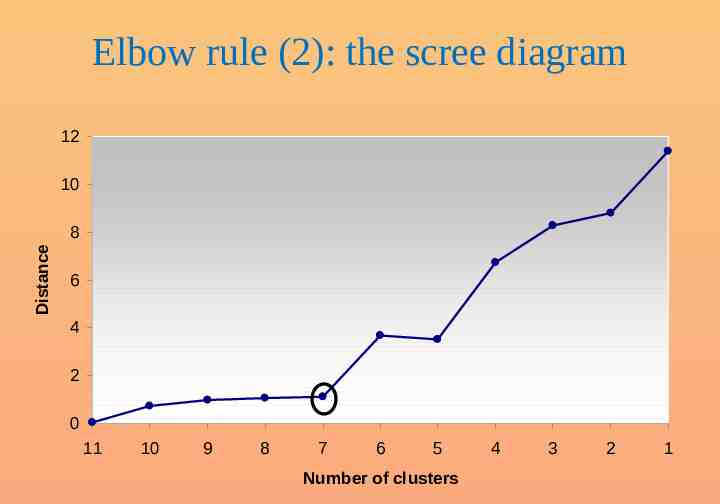
Elbow rule (2): the scree diagram 12 10 Distance 8 6 4 2 0 11 10 9 8 7 6 5 Number of clusters 4 3 2 1
Validating the analysis Impact of initial seeds / order of cases Impact of the selected method Consider the relevance of the chosen set of variables
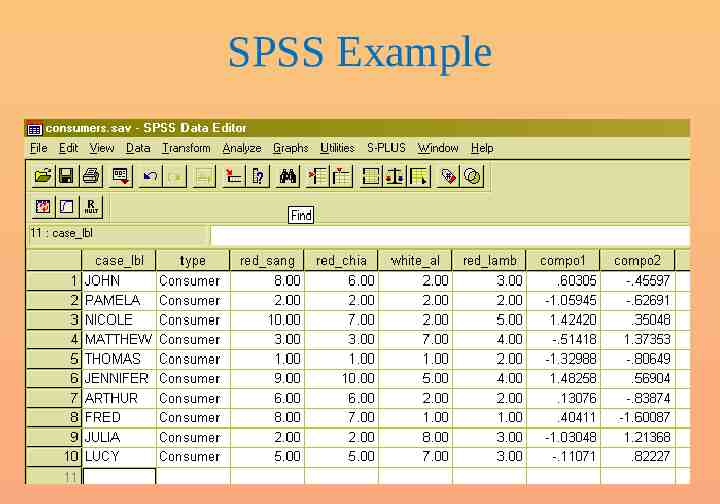
SPSS Example
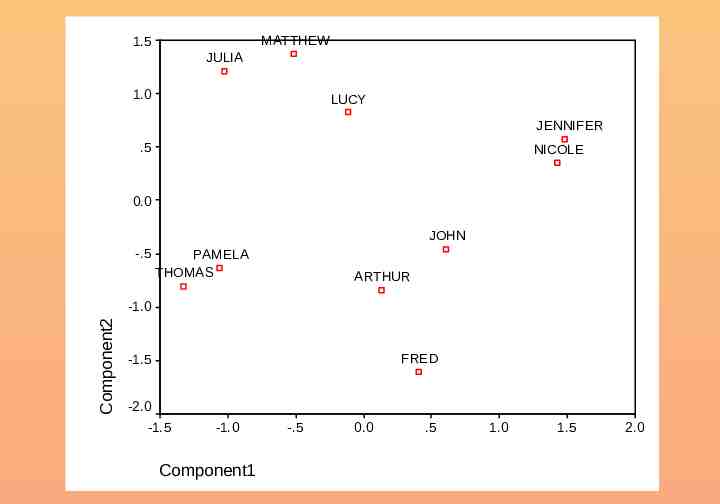
MATTHEW 1.5 JULIA 1.0 LUCY JENNIFER .5 NICOLE 0.0 JOHN -.5 PAMELA THOMAS ARTHUR Component2 -1.0 FRED -1.5 -2.0 -1.5 -1.0 Component1 -.5 0.0 .5 1.0 1.5 2.0
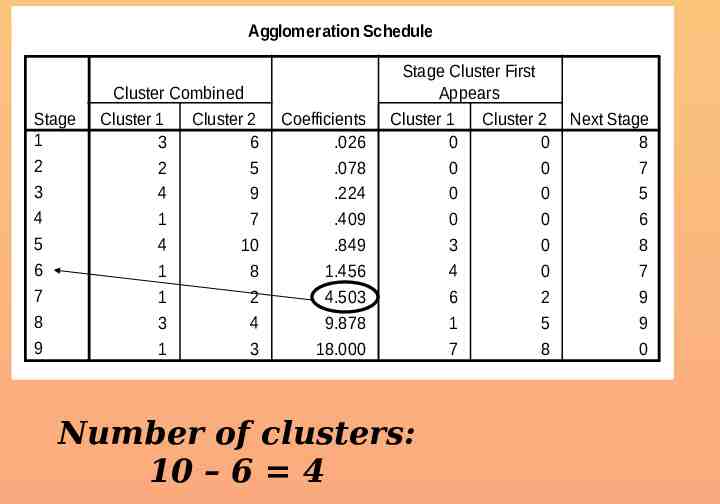
Agglomeration Schedule Stage 1 2 3 4 5 6 7 8 9 Cluster Combined Cluster 1 Cluster 2 3 6 2 5 4 9 1 7 4 10 1 8 1 2 3 4 1 3 Coefficients .026 .078 .224 .409 .849 1.456 4.503 9.878 18.000 Stage Cluster First Appears Cluster 1 Cluster 2 0 0 0 0 0 0 0 0 3 0 4 0 6 2 1 5 7 8 Number of clusters: 10 – 6 4 Next Stage 8 7 5 6 8 7 9 9 0
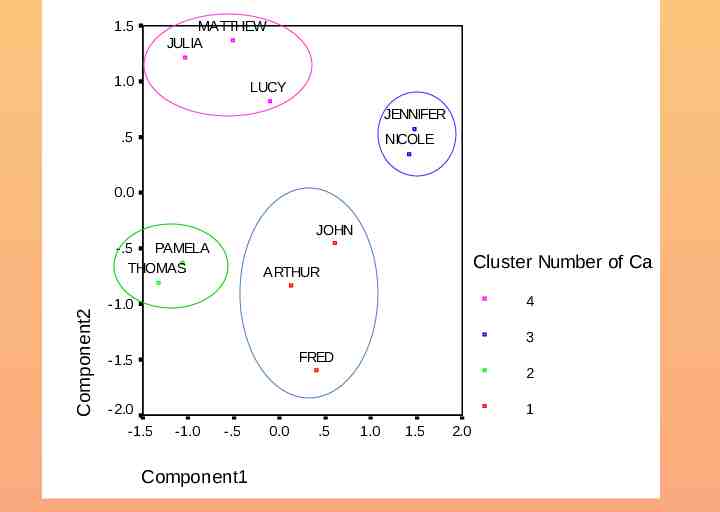
1.5 MATTHEW JULIA 1.0 LUCY JENNIFER .5 NICOLE 0.0 JOHN Component2 -.5 PAMELA THOMAS Cluster Number of Ca ARTHUR 4 -1.0 3 FRED -1.5 2 -2.0 1 -1.5 -1.0 -.5 Component1 0.0 .5 1.0 1.5 2.0
Open the dataset Cluster small.sav
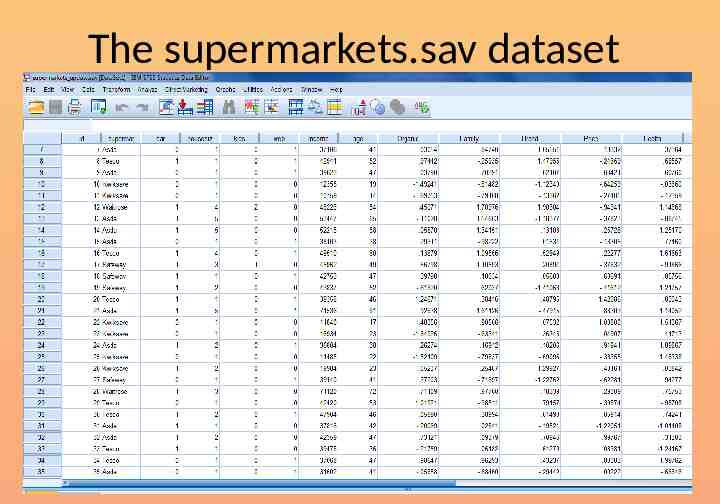
Open the dataset supermarkets update.sav
The supermarkets.sav dataset
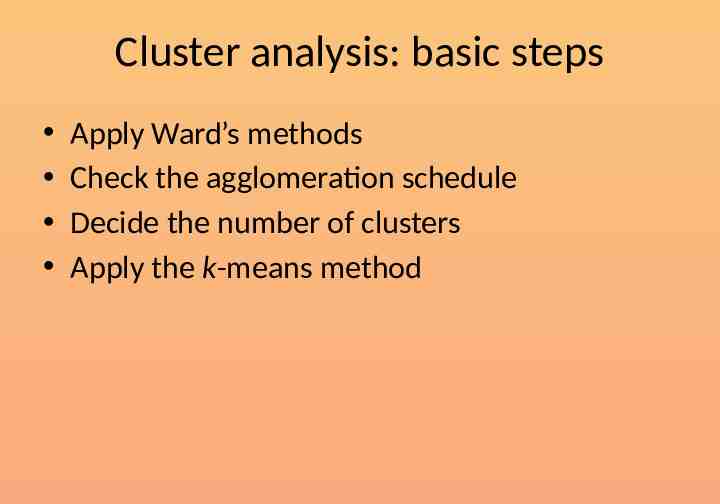
Cluster analysis: basic steps Apply Ward’s methods Check the agglomeration schedule Decide the number of clusters Apply the k-means method
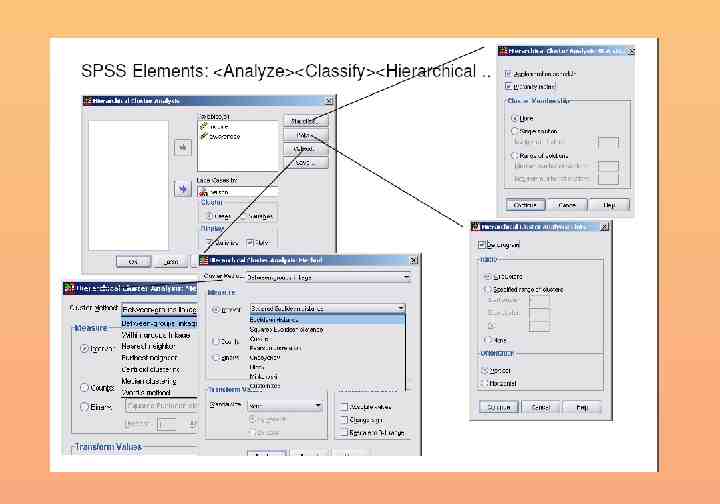
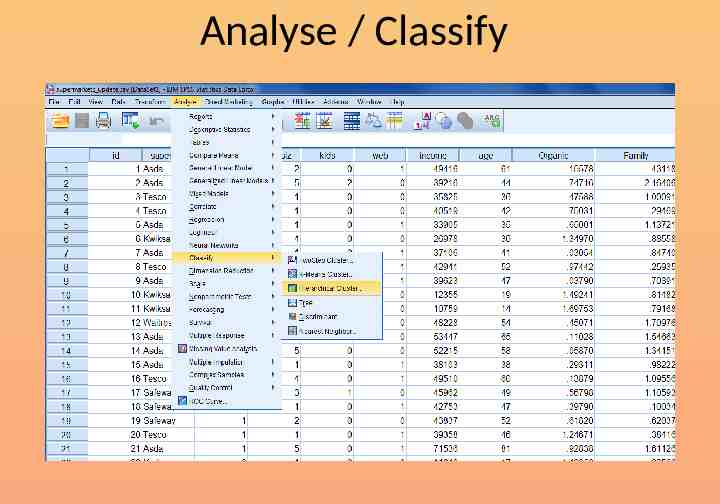
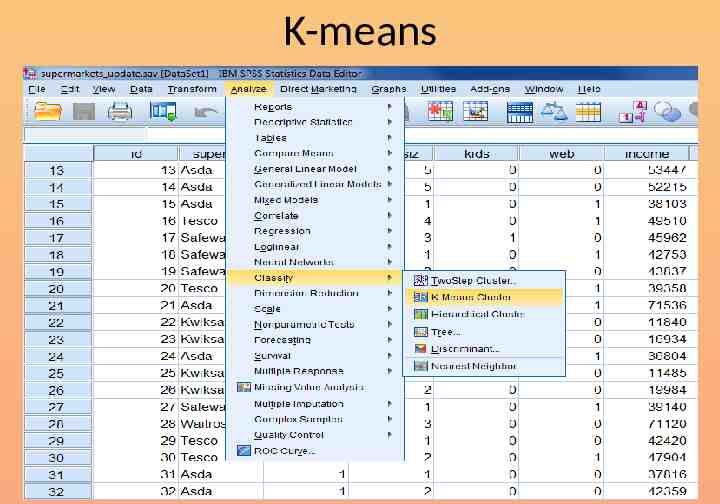
Analyse / Classify
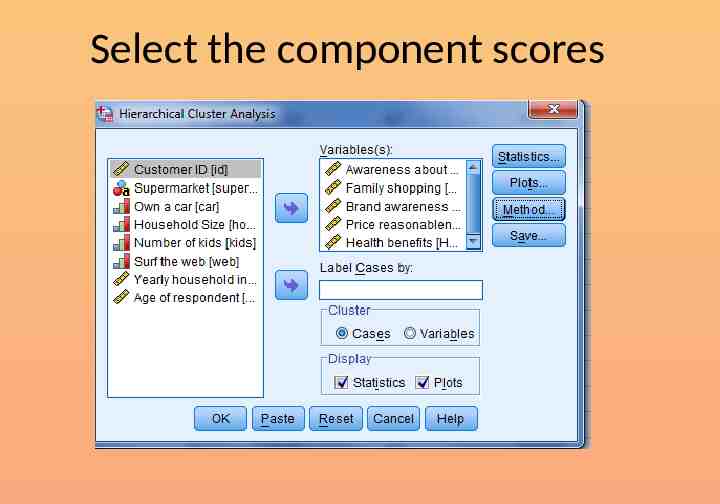
Select the component scores
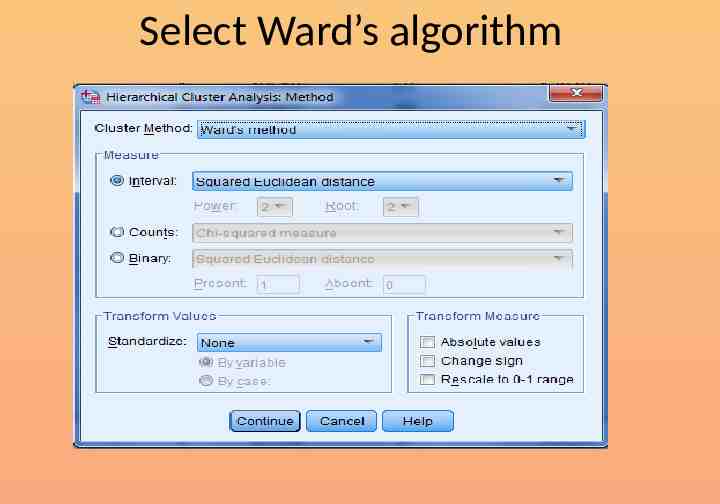
Select Ward’s algorithm
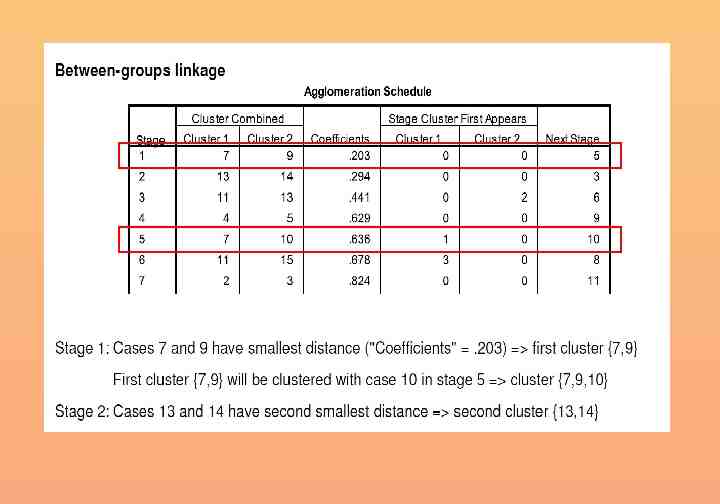
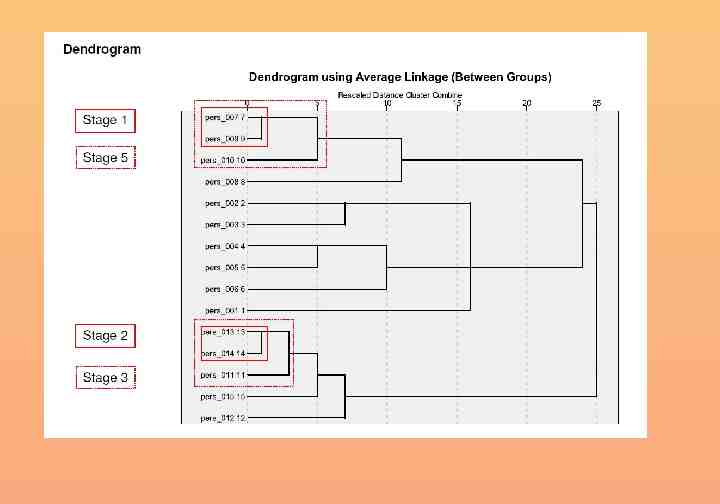
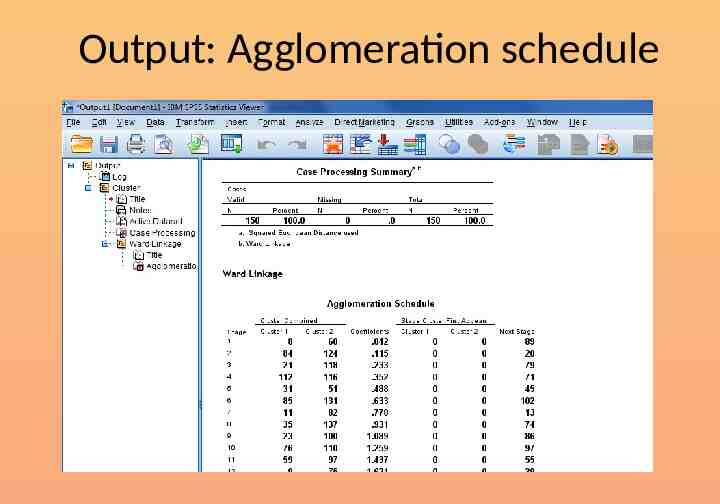
Output: Agglomeration schedule
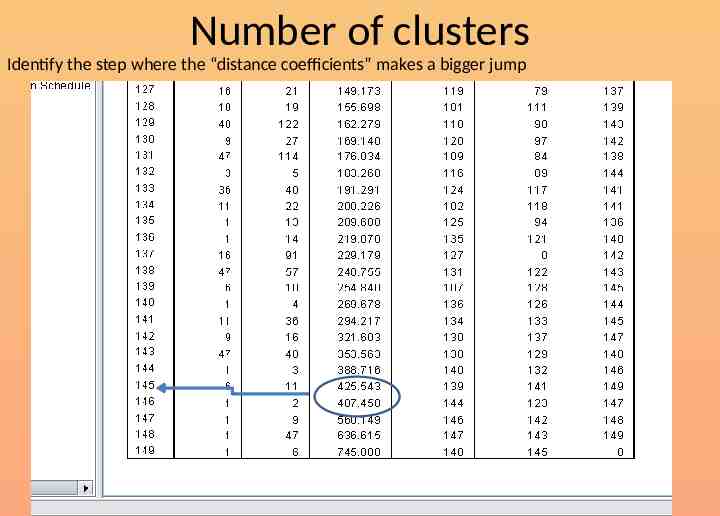
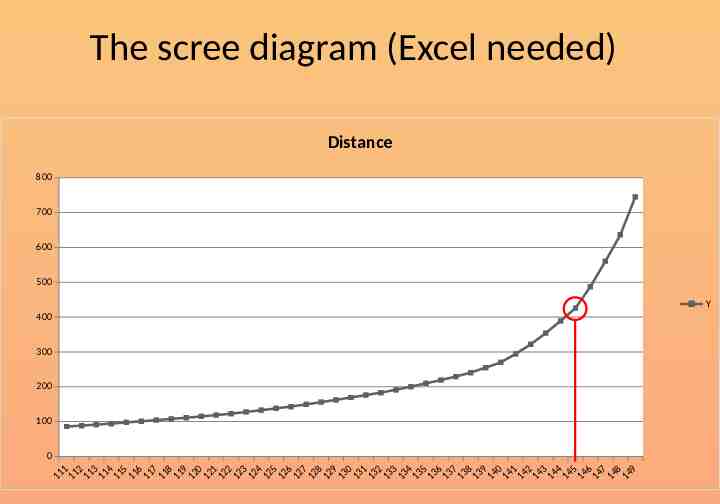
Number of clusters Identify the step where the “distance coefficients” makes a bigger jump
The scree diagram (Excel needed) Distance 800 700 600 500 Y 400 300 200 100 0 1 2 3 4 5 6 7 8 9 0 1 2 3 4 5 6 7 8 9 0 1 2 3 4 5 6 7 8 9 0 1 2 3 4 5 6 7 8 9 11 11 11 11 11 11 11 1 1 11 12 1 2 12 12 1 2 12 12 12 12 12 13 13 13 1 3 1 3 13 13 1 3 13 13 1 4 14 14 14 14 14 1 4 14 14 1 4
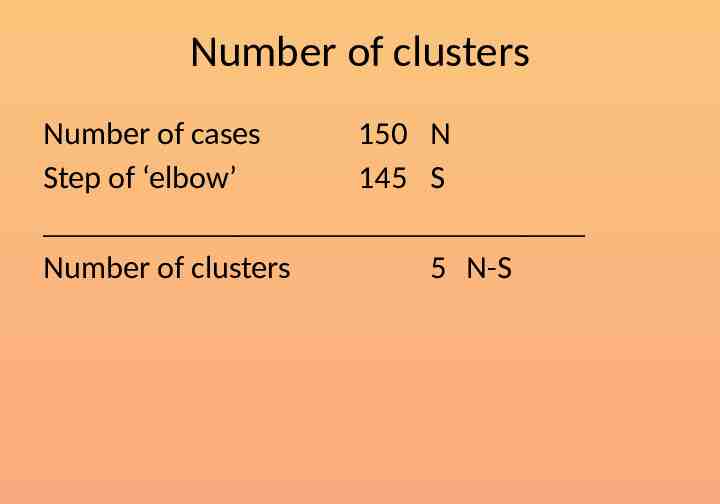
Number of clusters Number of cases 150 N Step of ‘elbow’ 145 S Number of clusters 5 N-S
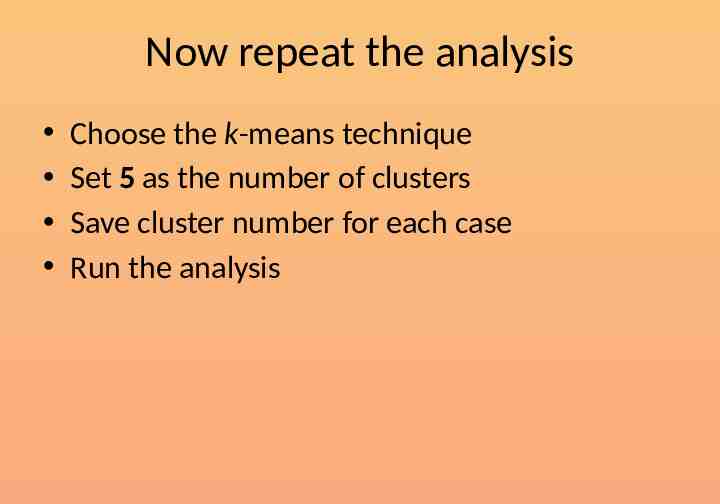
Now repeat the analysis Choose the k-means technique Set 5 as the number of clusters Save cluster number for each case Run the analysis
K-means
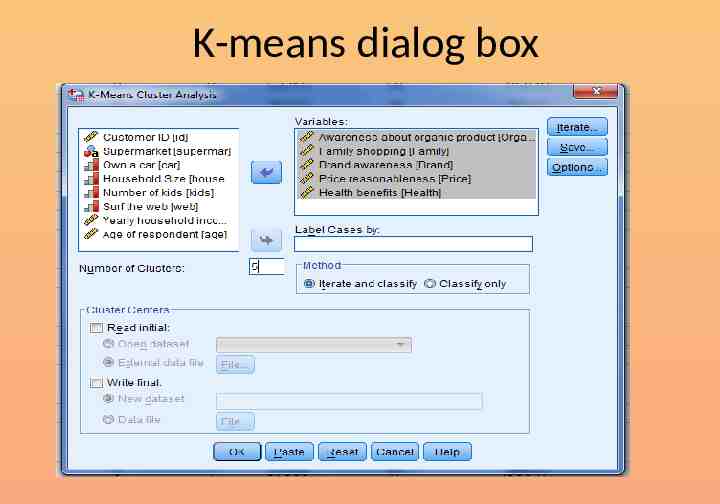
K-means dialog box
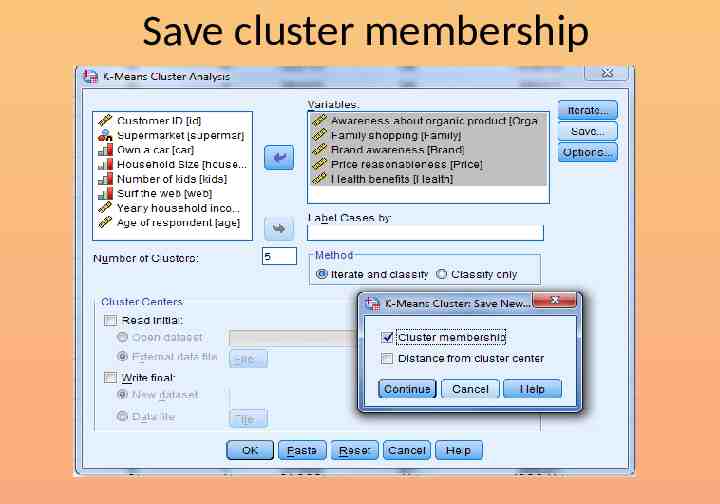
Save cluster membership
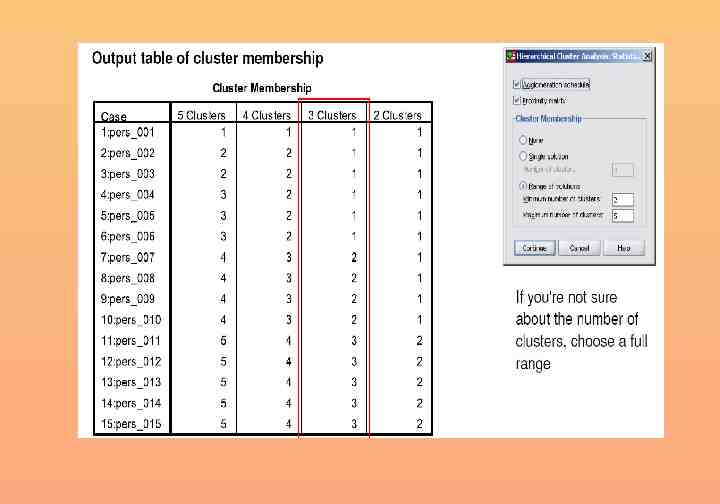
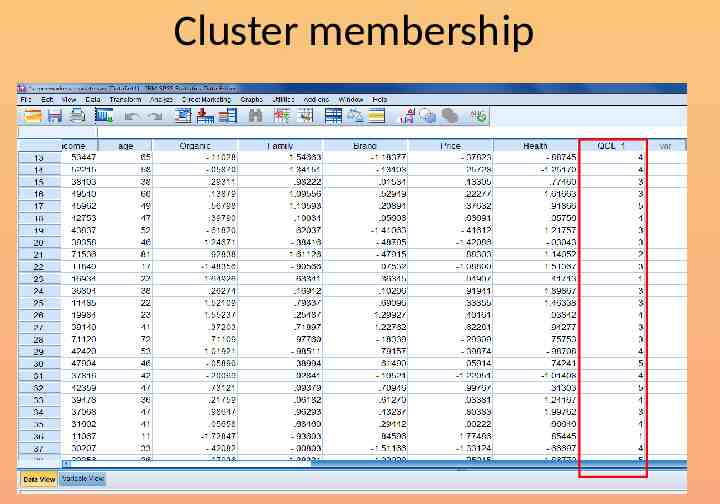
Cluster membership
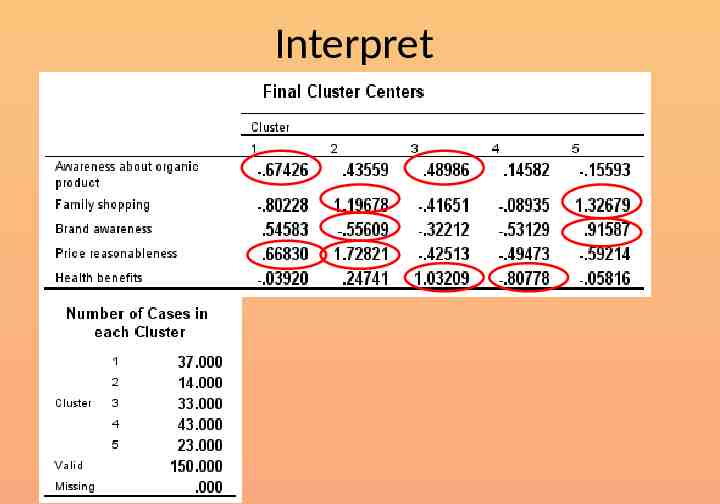
Interpret