CC Continuing Education Divisions Provide Adult


38 Slides4.26 MB
CC Continuing Education Divisions Provide Adult Education Opportunities 2018 National Policy Summit “Addressing the Adult Learner” Lou Guthrie Director National Higher Education Benchmarking Institute
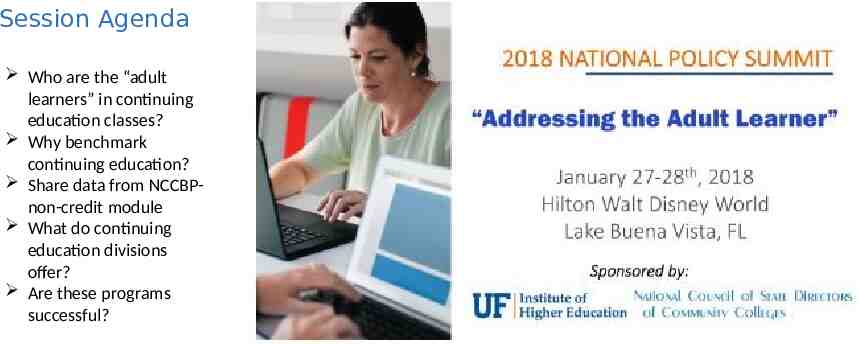
Session Agenda Who are the “adult learners” in continuing education classes? Why benchmark continuing education? Share data from NCCBPnon-credit module What do continuing education divisions offer? Are these programs successful?
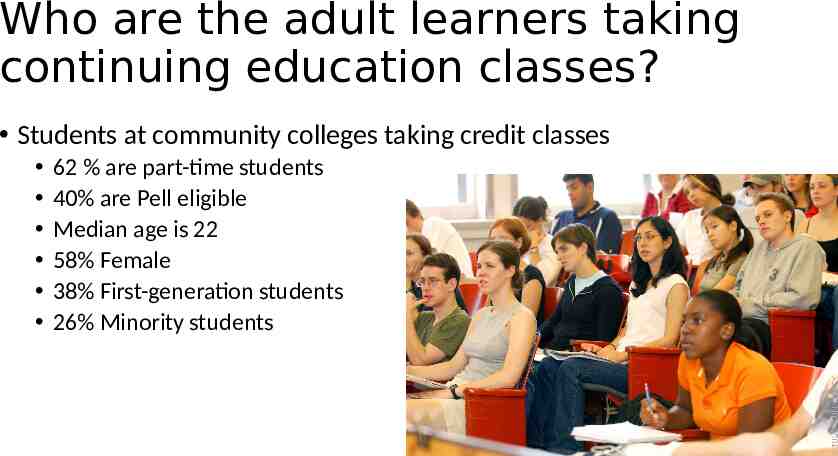
Who are the adult learners taking continuing education classes? Students at community colleges taking credit classes 62 % are part-time students 40% are Pell eligible Median age is 22 58% Female 38% First-generation students 26% Minority students
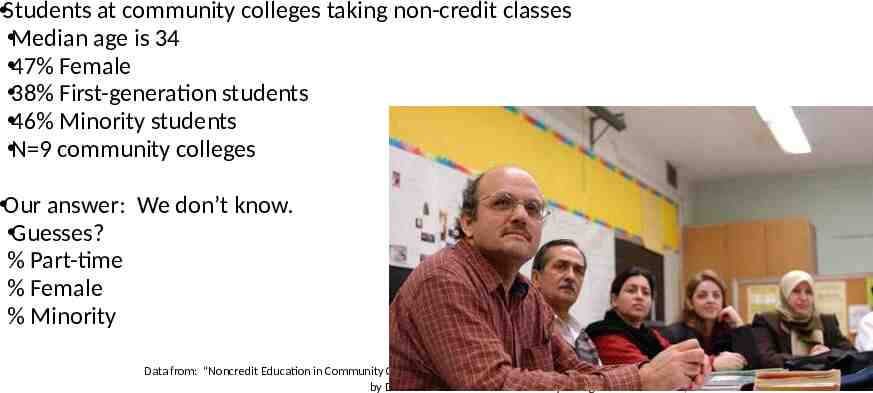
Students at community colleges taking non-credit classes Median age is 34 47% Female 38% First-generation students 46% Minority students N 9 community colleges Our answer: We don’t know. Guesses? % Part-time % Female % Minority Data from: “Noncredit Education in Community College: Students, Course Enrollments, and Academic Outcomes” by Di Xu and Xiaotao Ran. Community College Research Center, 2015
Why Benchmark Continuing Education? To get data you can use to improve your programs and inform your decision-making To provide continuing education programs with results that show their effectiveness vis-à-vis other continuing education programs To establish national norms or KPIs for continuing education To provide data for the numerous grants available to college’s continuing education programs
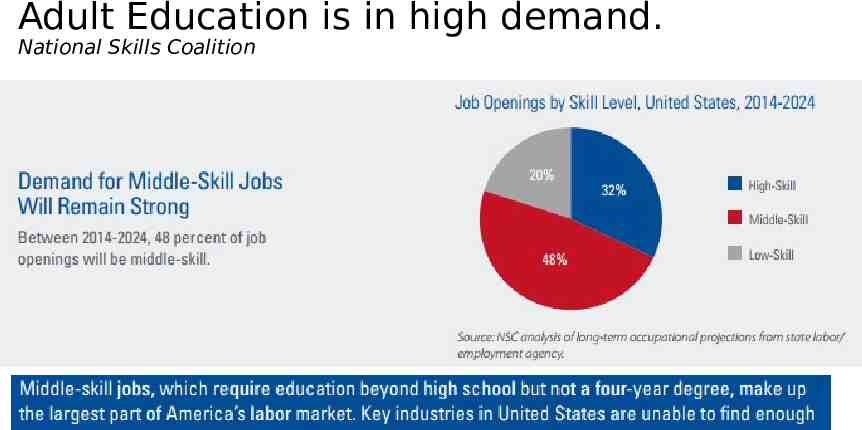
Adult Education is in high demand. National Skills Coalition
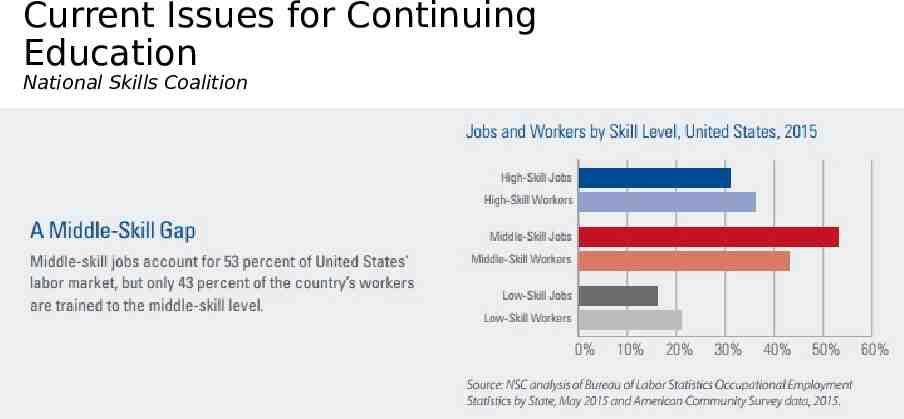
Current Issues for Continuing Education National Skills Coalition
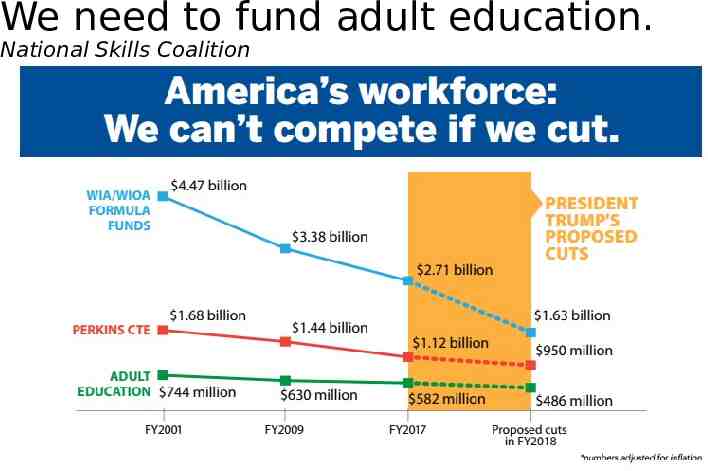
We need to fund adult education. National Skills Coalition
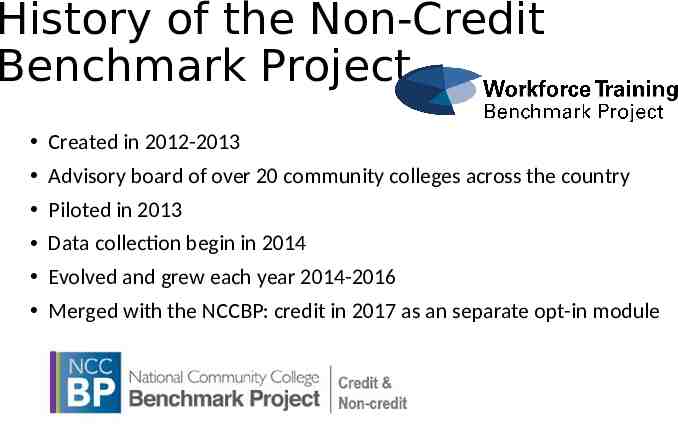
History of the Non-Credit Benchmark Project Created in 2012-2013 Advisory board of over 20 community colleges across the country Piloted in 2013 Data collection begin in 2014 Evolved and grew each year 2014-2016 Merged with the NCCBP: credit in 2017 as an separate opt-in module
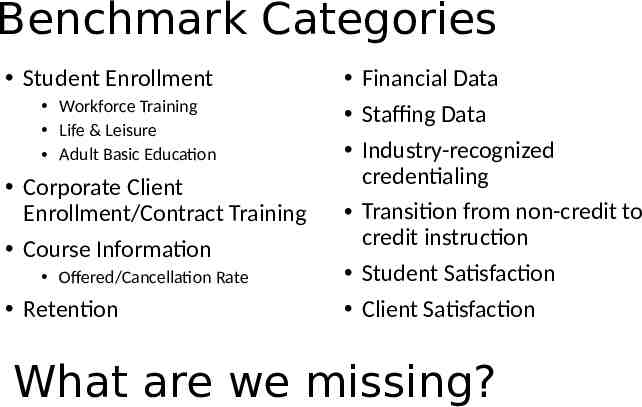
Benchmark Categories Student Enrollment Workforce Training Life & Leisure Adult Basic Education Corporate Client Enrollment/Contract Training Course Information Offered/Cancellation Rate Retention Financial Data Staffing Data Industry-recognized credentialing Transition from non-credit to credit instruction Student Satisfaction Client Satisfaction What are we missing?
As we look at NCCBP results I want you to share how continuing education programs might use the data.
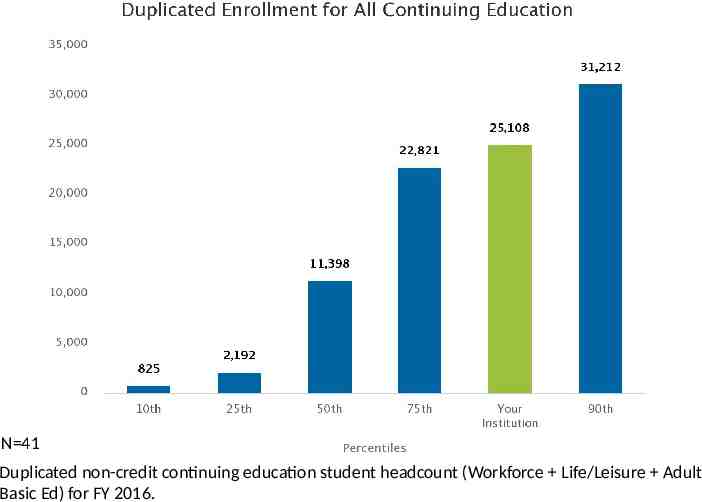
N 41 Duplicated non-credit continuing education student headcount (Workforce Life/Leisure Adult Basic Ed) for FY 2016.
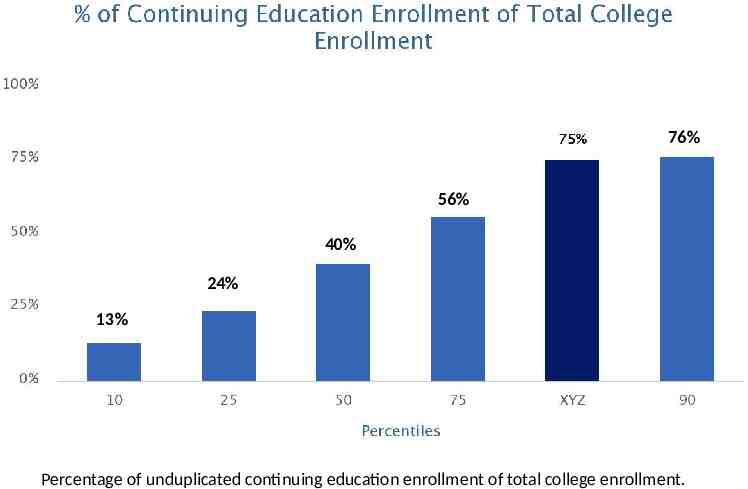
76% 56% 40% 24% 13% Percentage of unduplicated continuing education enrollment of total college enrollment.
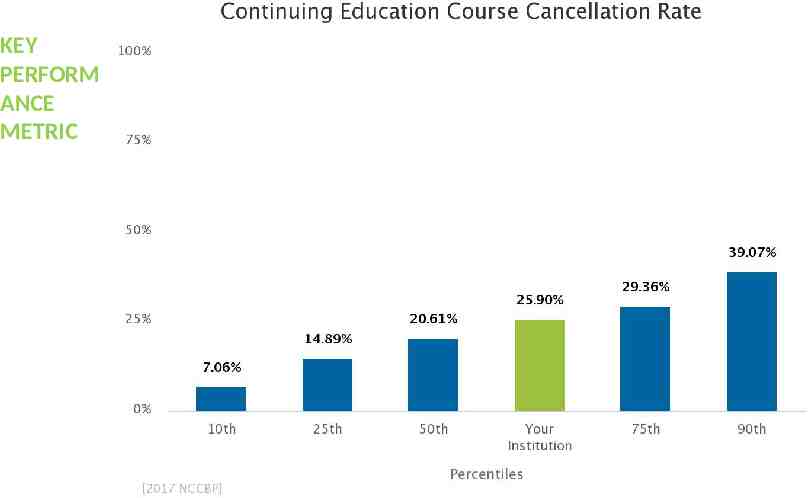
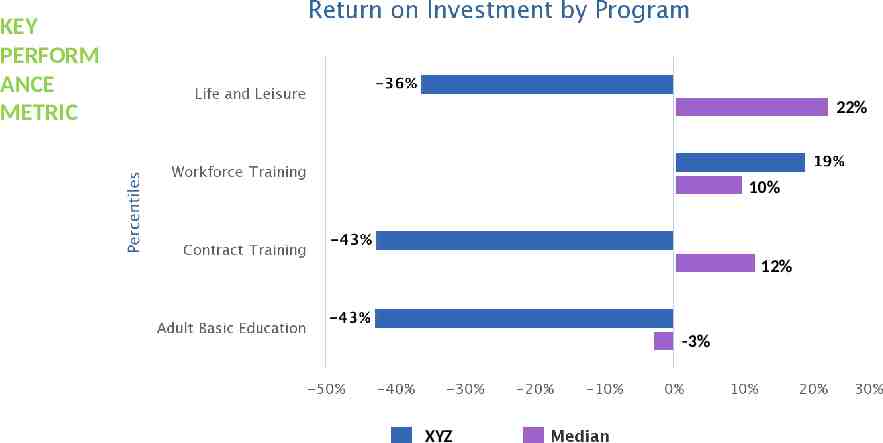
KEY PERFORM ANCE METRIC
What do continuing education divisions offer? Credit vs Non-credit Credit: Courses that apply towards an Associate degree or certificate Noncredit Students are taking courses for personal or professional interest. These courses do not offer college credit, but in some cases students can earn continuing education units, certification or other evidence of class completion to meet personal or professional requirements. Non-credit courses typically have lower tuition and fees than credit classes. Mission: Lifelong learning, professional development, GED
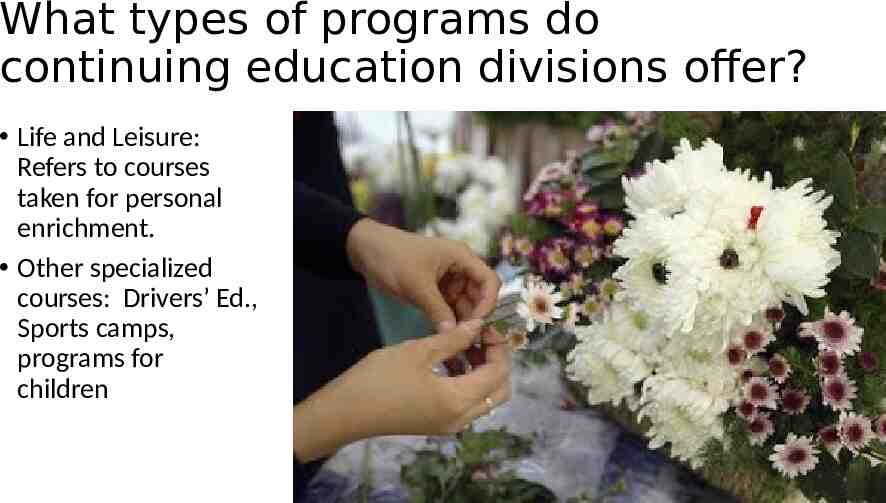
What types of programs do continuing education divisions offer? Life and Leisure: Refers to courses taken for personal enrichment. Other specialized courses: Drivers’ Ed., Sports camps, programs for children
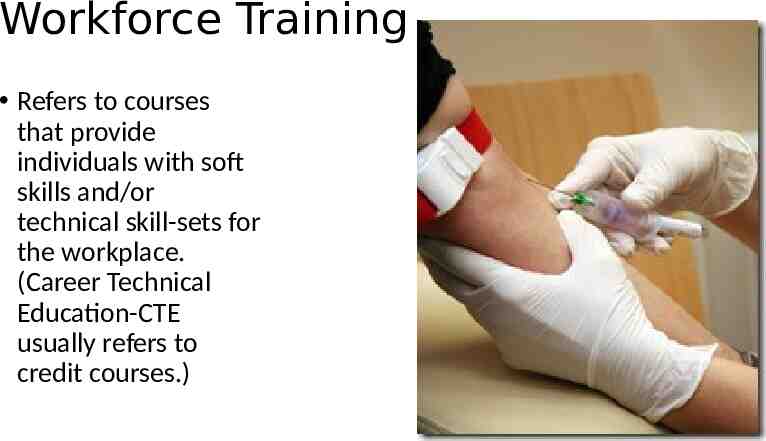
Workforce Training Refers to courses that provide individuals with soft skills and/or technical skill-sets for the workplace. (Career Technical Education-CTE usually refers to credit courses.)
Adult Basic Education - ABE Refers to GED and other high school equivalency programs, including English as a Second Language and other basic education courses.)
Contract Training Refers to courses commissioned by a local business or industry for their employees.
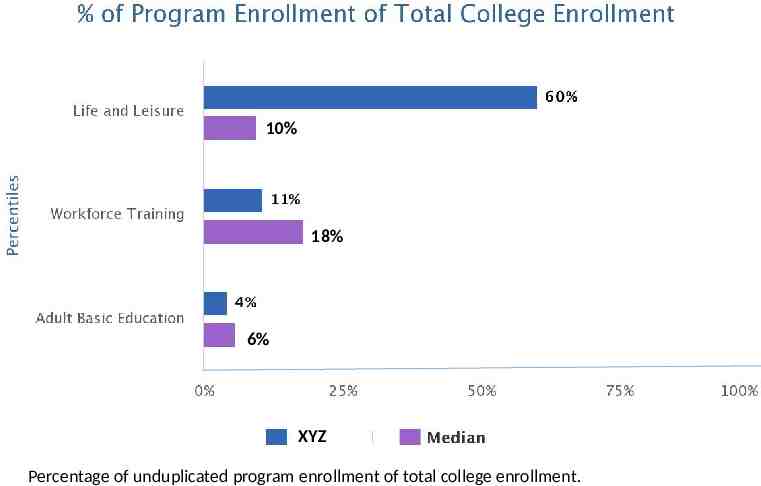
10% 18% 6% XYZ Percentage of unduplicated program enrollment of total college enrollment.
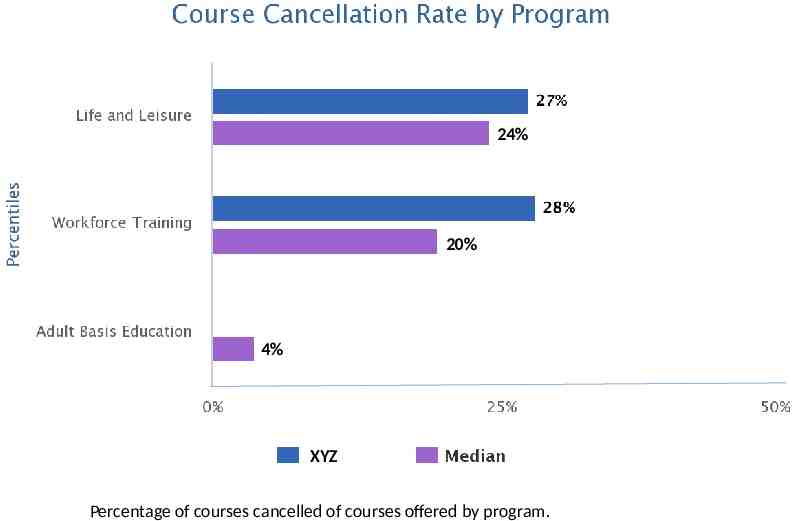
24% 20% 4% XYZ Percentage of courses cancelled of courses offered by program.
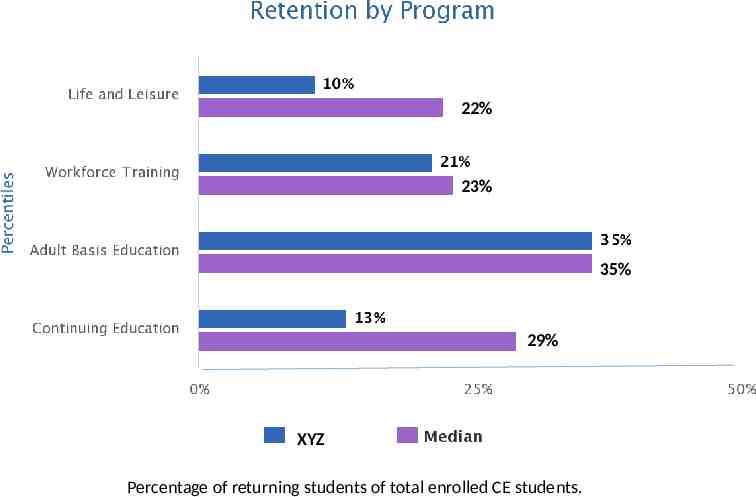
22% 23% 35% 29% XYZ Percentage of returning students of total enrolled CE students.
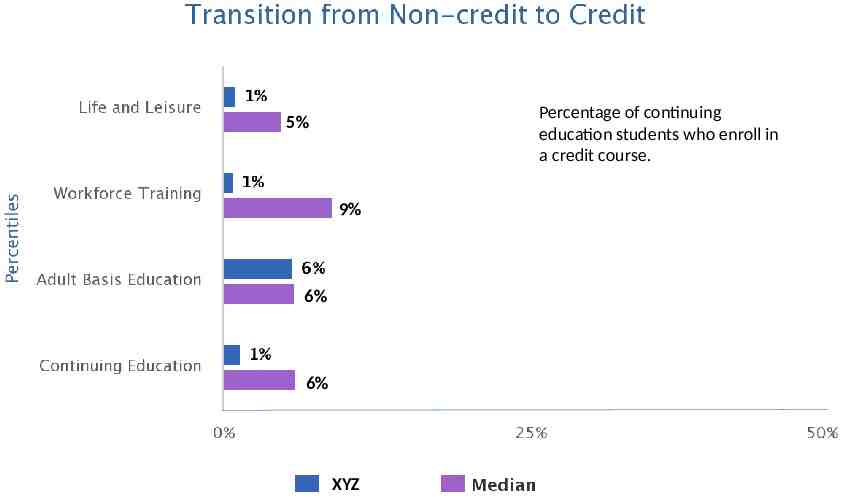
Percentage of continuing education students who enroll in a credit course. 5% 9% 6% 6% XYZ
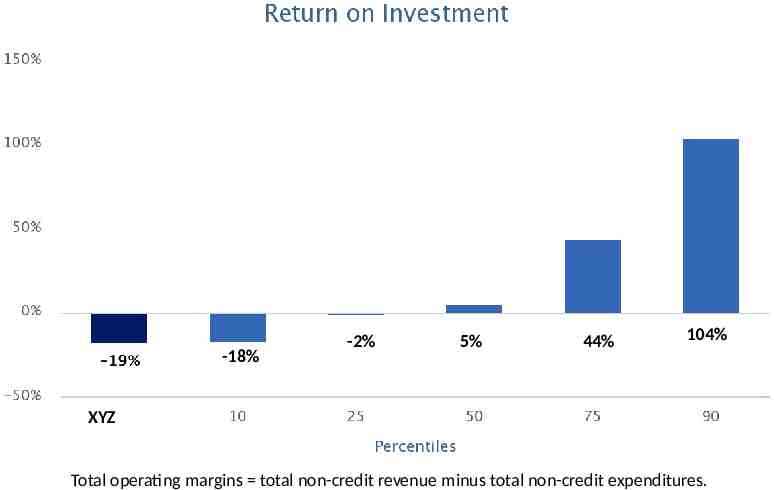
-18% -2% 5% 44% 104% XYZ Total operating margins total non-credit revenue minus total non-credit expenditures.
KEY PERFORM ANCE METRIC 22% 10% 12% -3% XYZ
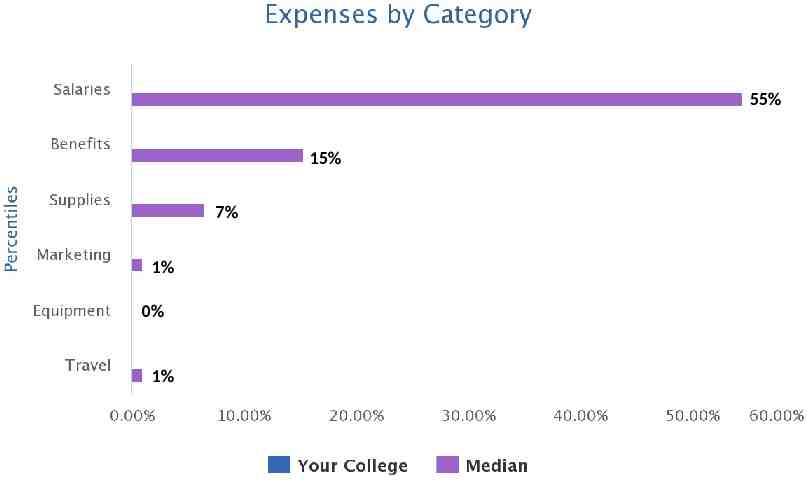
55% 15% 7% 1% 0% 1%
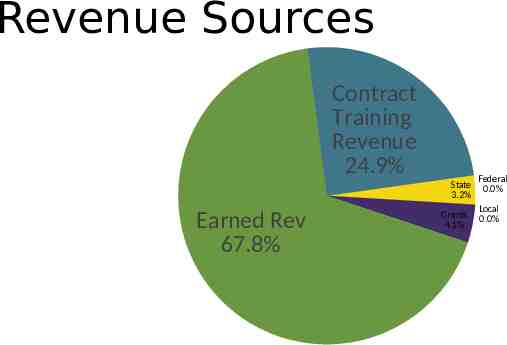
Revenue Sources Contract Training Revenue 24.9% State 3.2% Earned Rev 67.8% Grants 4.1% Federal 0.0% Local 0.0%
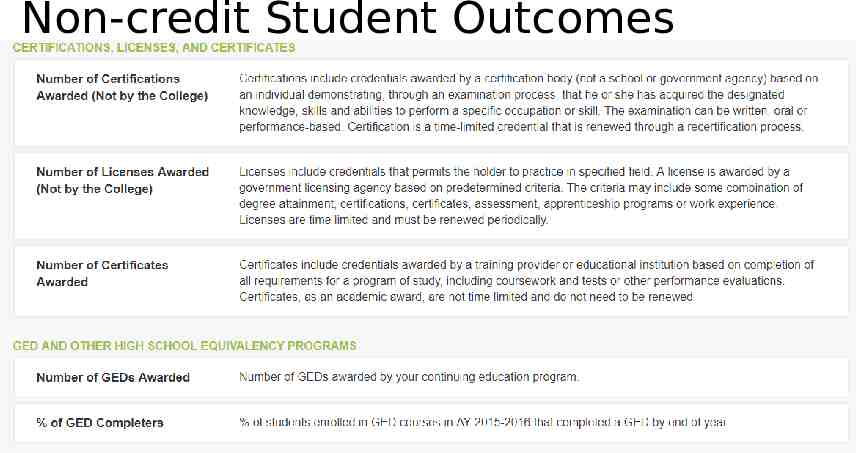
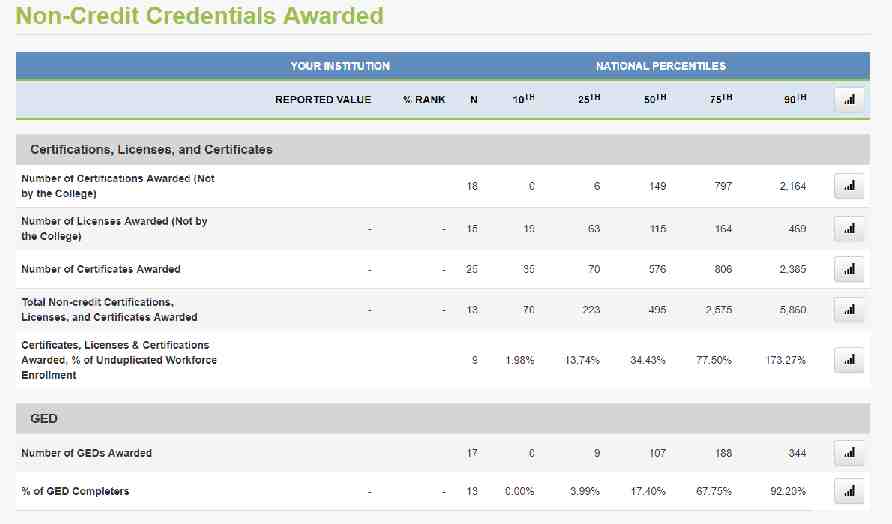
Non-credit Student Outcomes
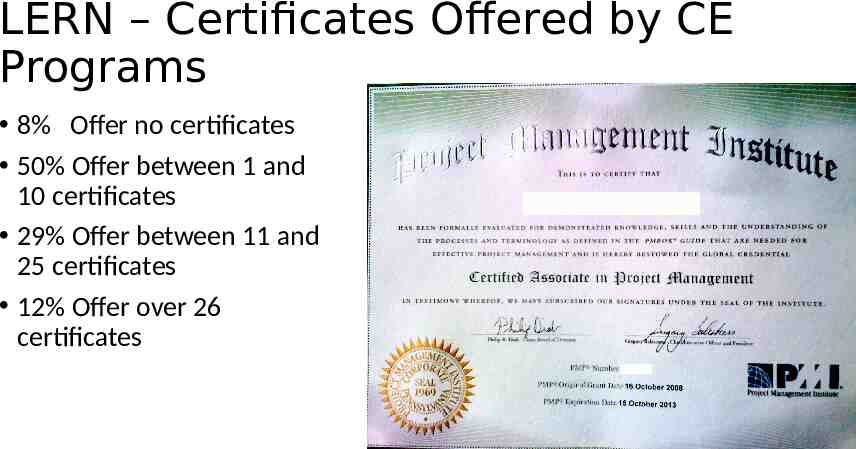
LERN – Certificates Offered by CE Programs 8% Offer no certificates 50% Offer between 1 and 10 certificates 29% Offer between 11 and 25 certificates 12% Offer over 26 certificates
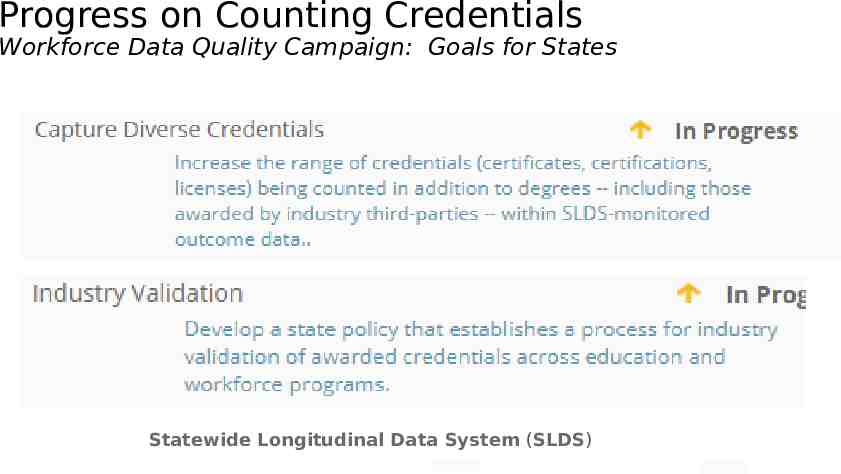
Progress on Counting Credentials Workforce Data Quality Campaign: Goals for States Statewide Longitudinal Data System (SLDS)
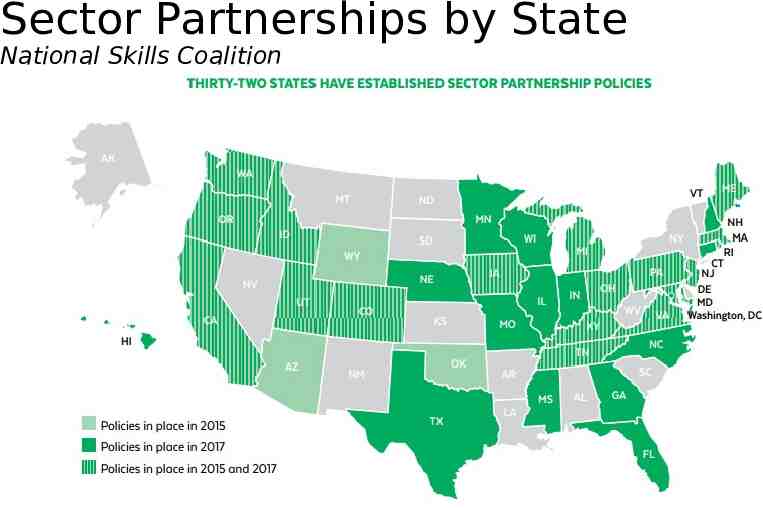
Sector Partnerships by State National Skills Coalition
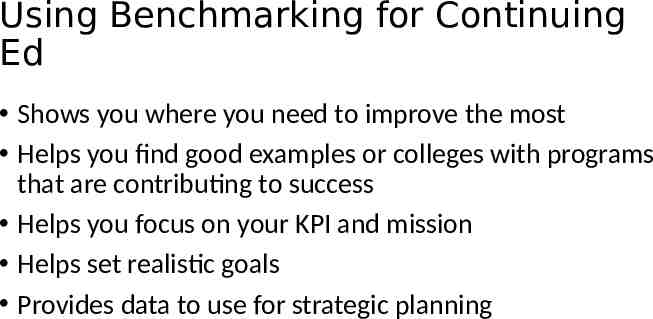
Using Benchmarking for Continuing Ed Shows you where you need to improve the most Helps you find good examples or colleges with programs that are contributing to success Helps you focus on your KPI and mission Helps set realistic goals Provides data to use for strategic planning
Conclusion: We need more and better continuing education data to help give a complete picture of adult education.
Keep up with the Benchmarking Institute and all of our projects by joining us on LinkedIn and following us on Twitter. @EdBenchmark Join the National Higher Education Benchmarking Institute Group
Lou Guthrie 913-469-8500, ext. 4019 [email protected]