California Standards SDAP1.1 Know various forms of display for data
24 Slides1.56 MB
California Standards SDAP1.1 Know various forms of display for data sets, including a stem-and-leaf plot or box-andwhisker plot; use the forms to display a single set of data or to compare two sets of data. SDAP1.3 Understand the meaning of, and be able to compute, the minimum, the lower quartile, the median, the upper quartile, and the maximum of a
Objective: Today we will display and analyze data in box-andwhisker plots.
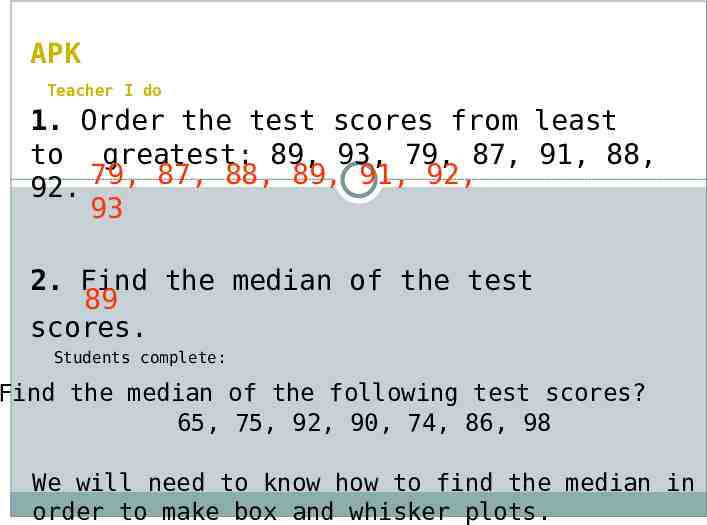
APK Teacher I do 1. Order the test scores from least to greatest: 89, 93, 79, 87, 91, 88, 79, 87, 88, 89, 91, 92, 92. 93 2. Find the median of the test 89 scores. Students complete: Find the median of the following test scores? 65, 75, 92, 90, 74, 86, 98 We will need to know how to find the median in order to make box and whisker plots.
Vocabulary lower quartile upper quartile box-and-whisker plot minimum maximum
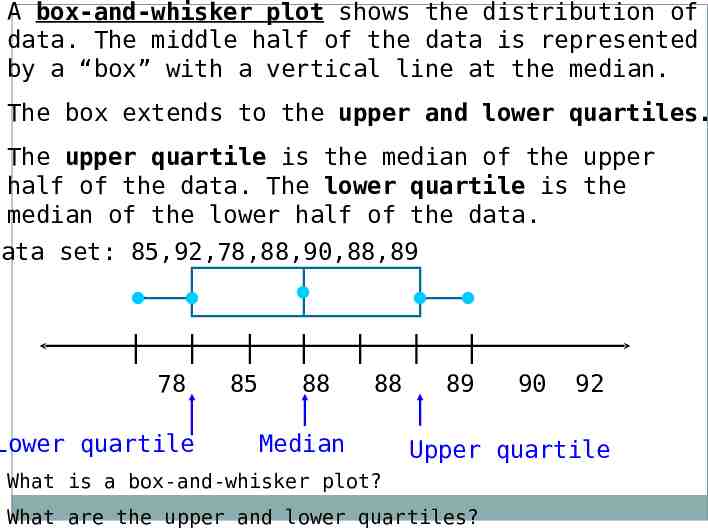
A box-and-whisker plot shows the distribution of data. The middle half of the data is represented by a “box” with a vertical line at the median. The box extends to the upper and lower quartiles. The upper quartile is the median of the upper half of the data. The lower quartile is the median of the lower half of the data. Data set: 85,92,78,88,90,88,89 78 Lower quartile 85 88 88 Median 89 90 92 Upper quartile What is a box-and-whisker plot? What are the upper and lower quartiles?
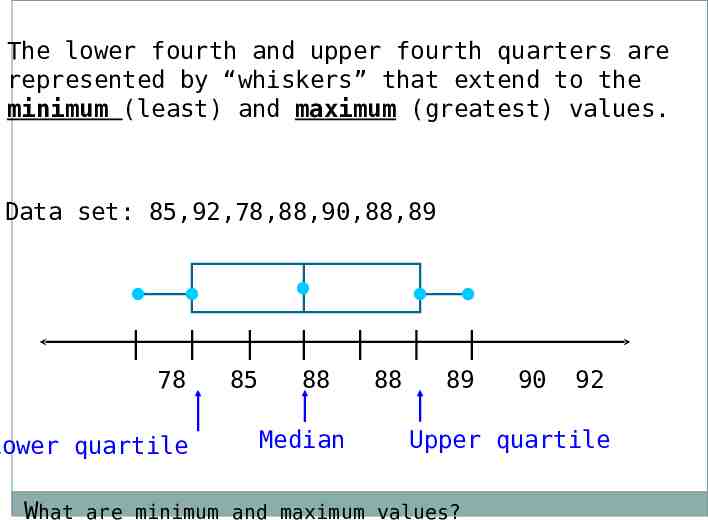
The lower fourth and upper fourth quarters are represented by “whiskers” that extend to the minimum (least) and maximum (greatest) values. Data set: 85,92,78,88,90,88,89 78 Lower quartile 85 88 Median 88 89 90 92 Upper quartile What are minimum and maximum values?
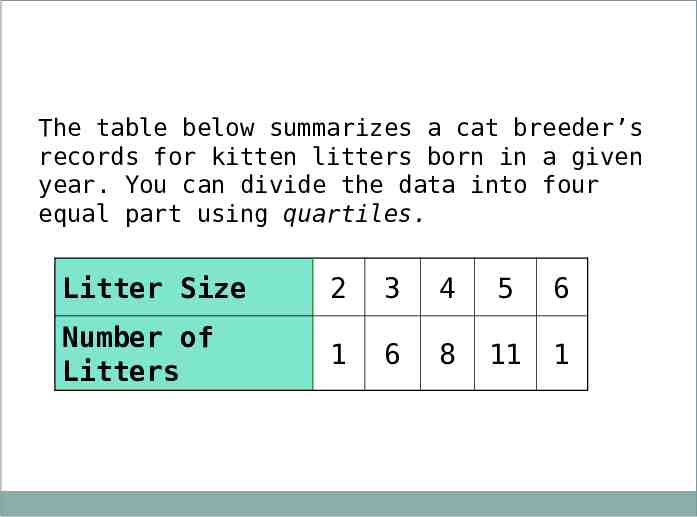
The table below summarizes a cat breeder’s records for kitten litters born in a given year. You can divide the data into four equal part using quartiles. Litter Size 2 3 4 5 6 Number of Litters 1 6 8 11 1
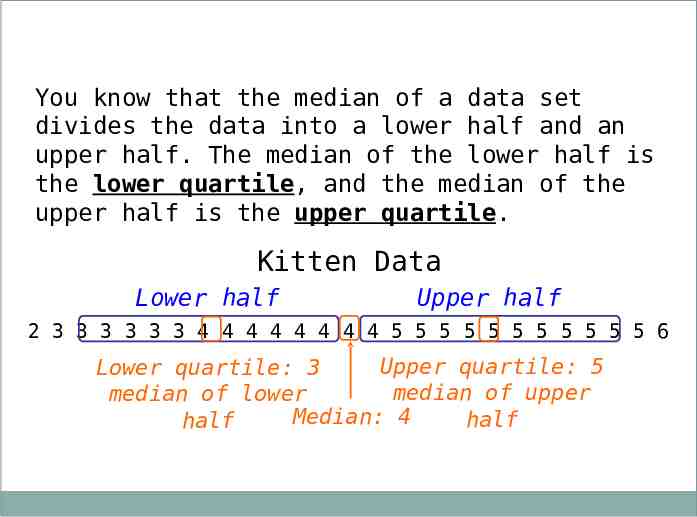
You know that the median of a data set divides the data into a lower half and an upper half. The median of the lower half is the lower quartile, and the median of the upper half is the upper quartile. Kitten Data Lower half Upper half 2 3 3 3 3 3 3 4 4 4 4 4 4 4 4 5 5 5 5 5 5 5 5 5 5 5 6 Upper quartile: 5 Lower quartile: 3 median of upper median of lower Median: 4 half half
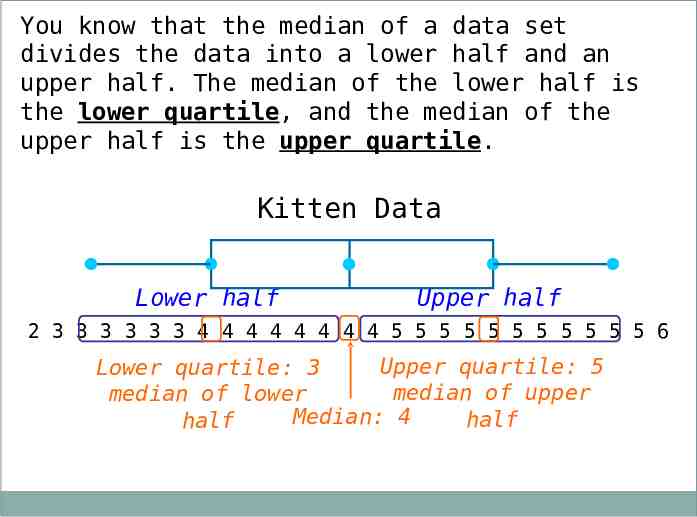
You know that the median of a data set divides the data into a lower half and an upper half. The median of the lower half is the lower quartile, and the median of the upper half is the upper quartile. Kitten Data Lower half Upper half 2 3 3 3 3 3 3 4 4 4 4 4 4 4 4 5 5 5 5 5 5 5 5 5 5 5 6 Upper quartile: 5 Lower quartile: 3 median of upper median of lower Median: 4 half half
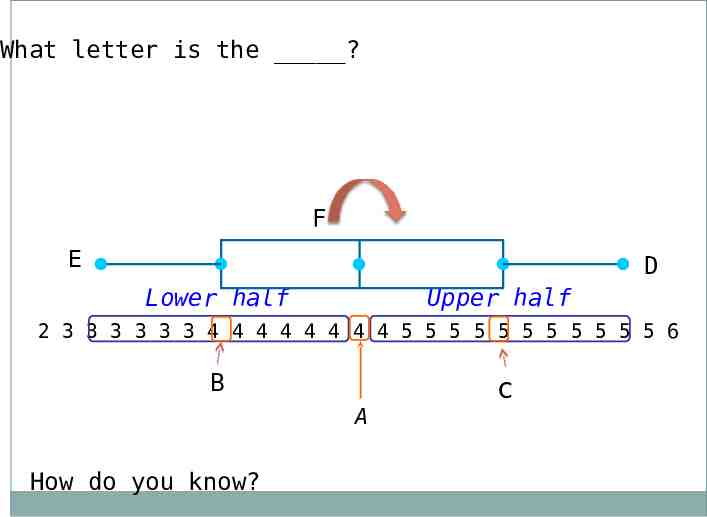
What letter is the ? F E D Lower half Upper half 2 3 3 3 3 3 3 4 4 4 4 4 4 4 4 5 5 5 5 5 5 5 5 5 5 5 6 B A How do you know? c
Importance Why do we need to know how to display and analyze data in box-and-whisker plots ? *It helps you to interpret and represent data. *It gives a visual representation of data. Tell your partner which reason is most important to you. You can use one of mine or one of your own. p/s - volunteers
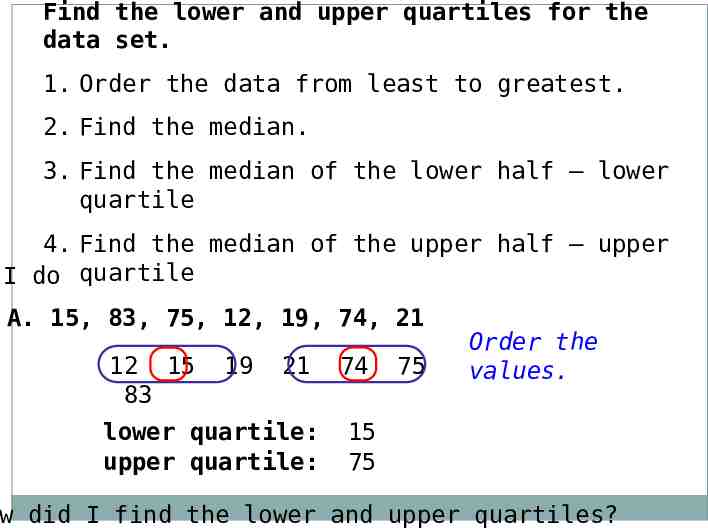
Find the lower and upper quartiles for the data set. 1. Order the data from least to greatest. 2. Find the median. 3. Find the median of the lower half – lower quartile 4. Find the median of the upper half – upper I do quartile A. 15, 83, 75, 12, 19, 74, 21 12 15 83 19 21 lower quartile: upper quartile: 74 75 Order the values. 15 75 w did I find the lower and upper quartiles?
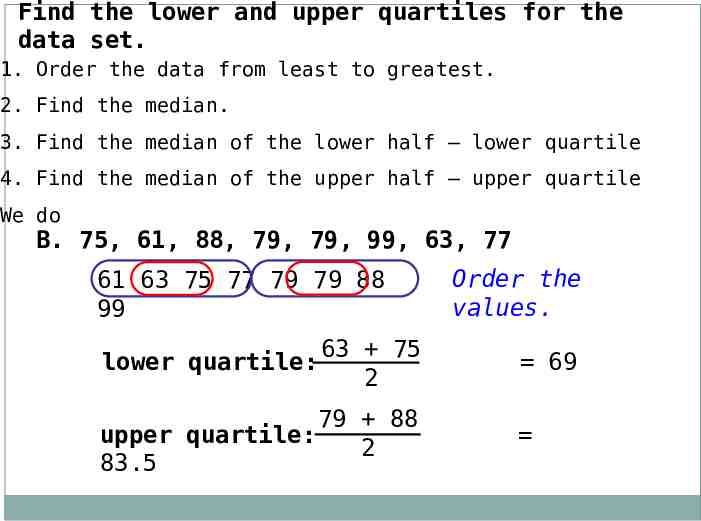
Find the lower and upper quartiles for the data set. 1. Order the data from least to greatest. 2. Find the median. 3. Find the median of the lower half – lower quartile 4. Find the median of the upper half – upper quartile We do B. 75, 61, 88, 79, 79, 99, 63, 77 61 63 75 77 79 79 88 99 lower quartile: 63 75 2 79 88 upper quartile: 2 83.5 Order the values. 69
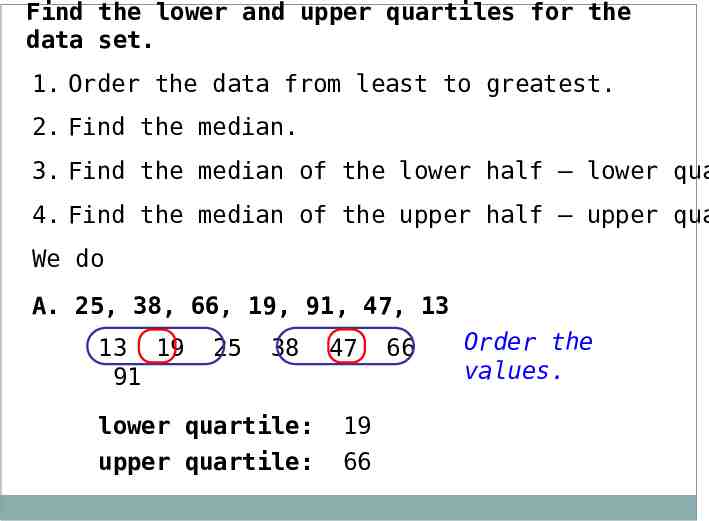
Find the lower and upper quartiles for the data set. 1. Order the data from least to greatest. 2. Find the median. 3. Find the median of the lower half – lower qua 4. Find the median of the upper half – upper qua We do A. 25, 38, 66, 19, 91, 47, 13 13 19 91 25 38 lower quartile: upper quartile: 47 19 66 66 Order the values.
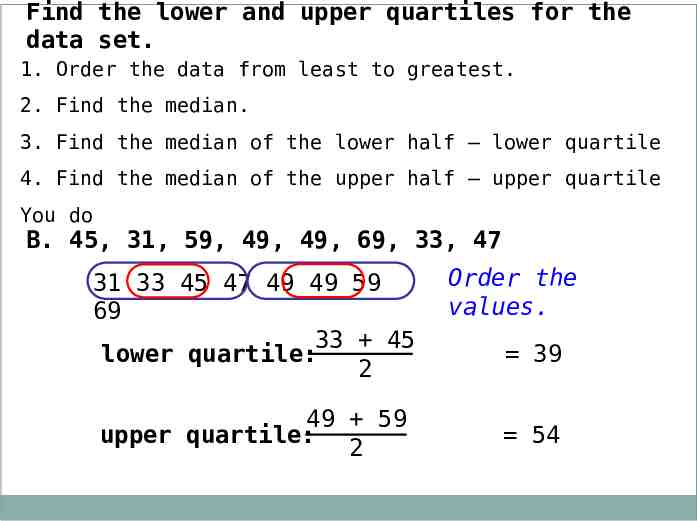
Find the lower and upper quartiles for the data set. 1. Order the data from least to greatest. 2. Find the median. 3. Find the median of the lower half – lower quartile 4. Find the median of the upper half – upper quartile You do B. 45, 31, 59, 49, 49, 69, 33, 47 31 33 45 47 49 49 59 69 33 45 lower quartile: 2 49 59 upper quartile: 2 Order the values. 39 54
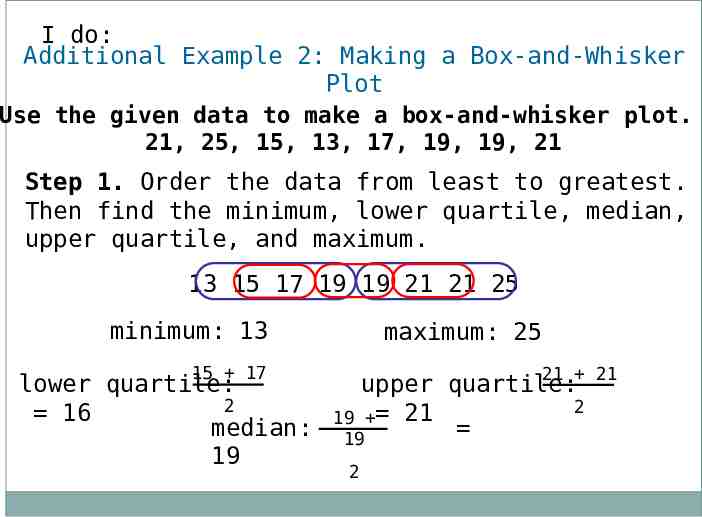
I do: Additional Example 2: Making a Box-and-Whisker Plot Use the given data to make a box-and-whisker plot. 21, 25, 15, 13, 17, 19, 19, 21 Step 1. Order the data from least to greatest. Then find the minimum, lower quartile, median, upper quartile, and maximum. 13 15 17 19 19 21 21 25 minimum: 13 15 17 lower quartile: 2 16 median: 19 maximum: 25 21 21 upper quartile: 2 19 21 19 2
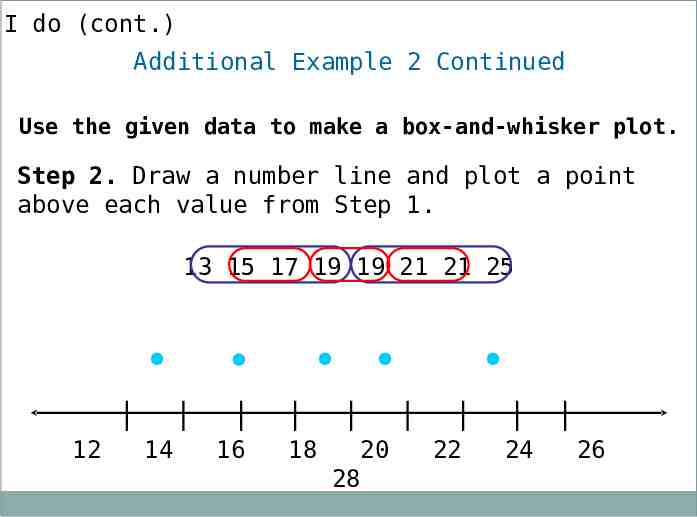
I do (cont.) Additional Example 2 Continued Use the given data to make a box-and-whisker plot. Step 2. Draw a number line and plot a point above each value from Step 1. 13 15 17 19 19 21 21 25 12 14 16 18 20 28 22 24 26
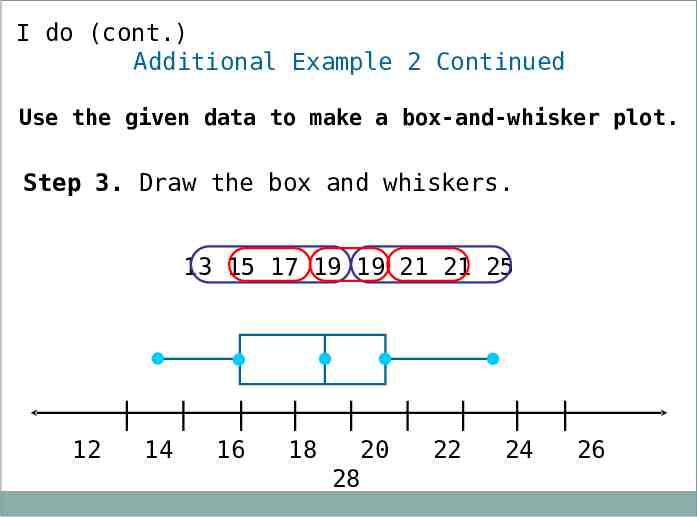
I do (cont.) Additional Example 2 Continued Use the given data to make a box-and-whisker plot. Step 3. Draw the box and whiskers. 13 15 17 19 19 21 21 25 12 14 16 18 20 28 22 24 26
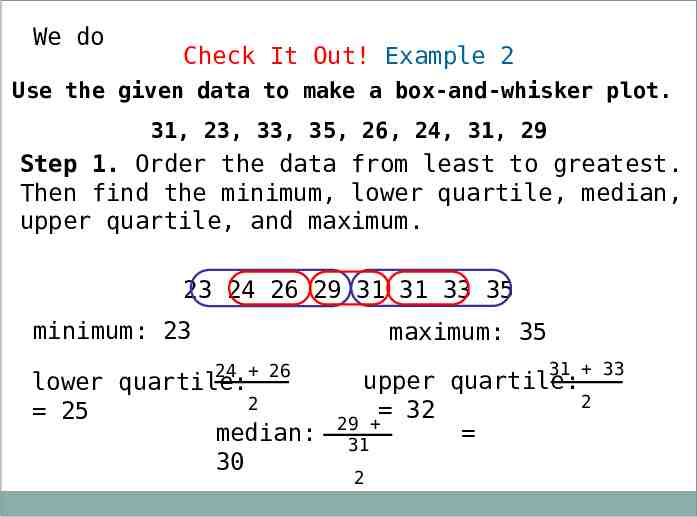
We do Check It Out! Example 2 Use the given data to make a box-and-whisker plot. 31, 23, 33, 35, 26, 24, 31, 29 Step 1. Order the data from least to greatest. Then find the minimum, lower quartile, median, upper quartile, and maximum. 23 24 26 29 31 31 33 35 minimum: 23 maximum: 35 24 26 lower quartile: 2 25 median: 30 31 33 upper quartile: 2 32 29 31 2
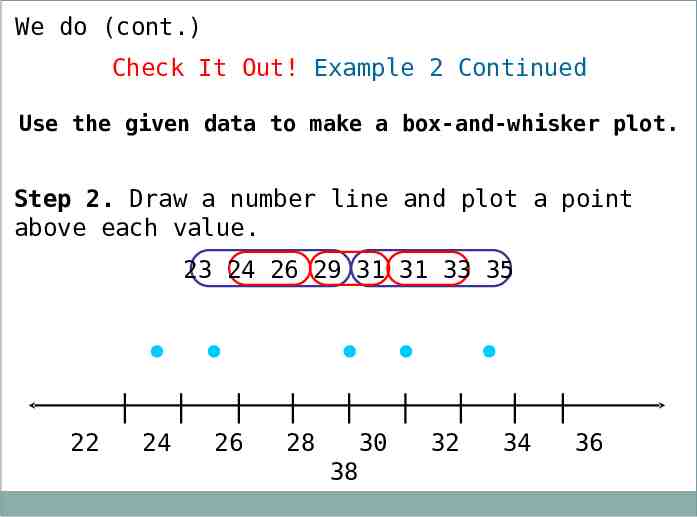
We do (cont.) Check It Out! Example 2 Continued Use the given data to make a box-and-whisker plot. Step 2. Draw a number line and plot a point above each value. 23 24 26 29 31 31 33 35 22 24 26 28 30 38 32 34 36
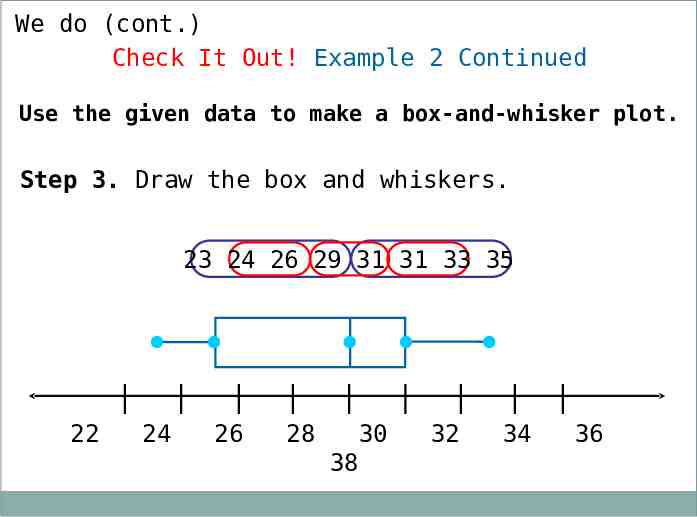
We do (cont.) Check It Out! Example 2 Continued Use the given data to make a box-and-whisker plot. Step 3. box and whiskers. 2. Draw the a number line and plot a point above each value. 23 24 26 29 31 31 33 35 22 24 26 28 30 38 32 34 36
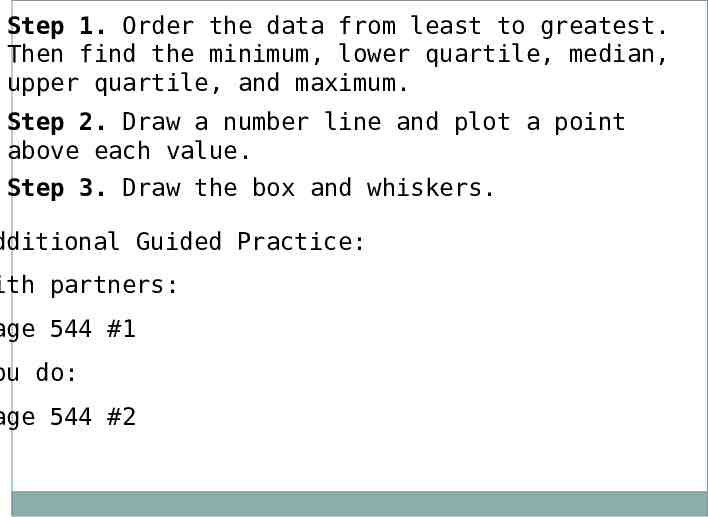
Step 1. Order the data from least to greatest. Then find the minimum, lower quartile, median, upper quartile, and maximum. Step 2. Draw a number line and plot a point above each value. Step 3. Draw the box and whiskers. dditional Guided Practice: ith partners: age 544 #1 ou do: age 544 #2
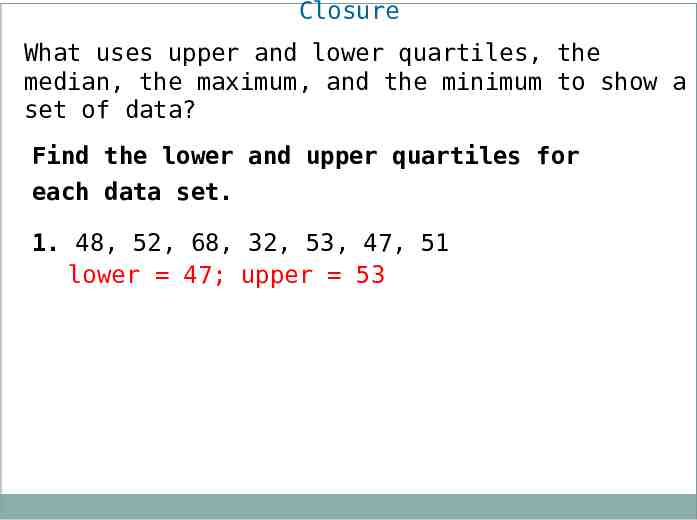
Closure What uses upper and lower quartiles, the median, the maximum, and the minimum to show a set of data? Find the lower and upper quartiles for each data set. 1. 48, 52, 68, 32, 53, 47, 51 lower 47; upper 53
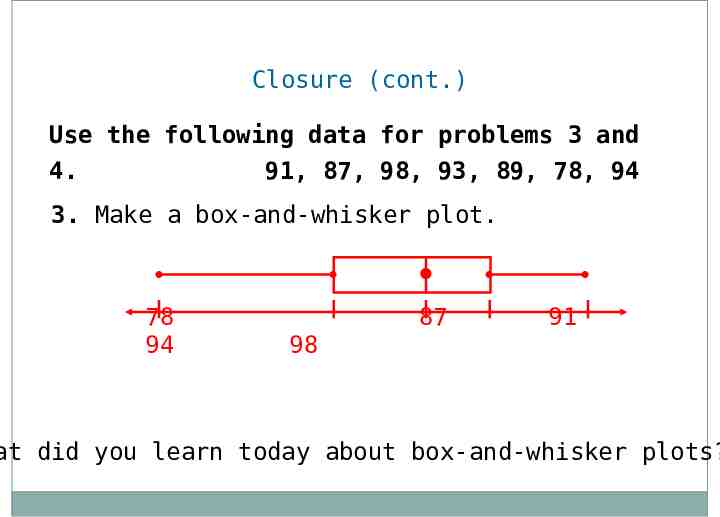
Closure (cont.) Use the following data for problems 3 and 4. 91, 87, 98, 93, 89, 78, 94 3. Make a box-and-whisker plot. 78 94 87 91 98 at did you learn today about box-and-whisker plots?