Budget Management


49 Slides626.50 KB
Budget Management
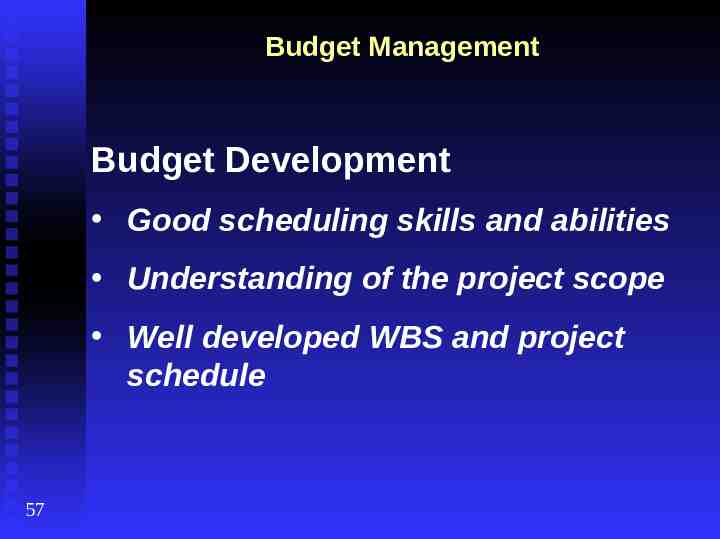
Budget Management Budget Development Good scheduling skills and abilities Understanding of the project scope Well developed WBS and project schedule 57
Budget Management Key reasons for overspending Bad Luck Overly optimistic initial estimates Poor communication Poor cost/time estimating practices 57
Budget Management Three methods of estimating 1. Analogous Estimating Uses values from previous, similar projects as the basis for estimating the same values for future activities or projects. Also called “Top-down” estimating. 57
Budget Management Three methods of estimating 2. Parametric Estimating Uses statistical relationship between historical data and other variables to calculate an estimate for an activity or project. 57
Budget Management Three methods of estimating 3. Bottom-up Estimating Decomposition of the work into smaller packages or more detail. Estimates are made at the lowest level and then summarizes, or aggregated, into the higher level activities. 58
Budget Management Cost Budgeting The planning process that involves summarizing, or aggregating, the estimated costs for individual activities to establish a total cost baseline for the project. 58
Budget Management Cost Baseline Time based budget that is used as a basis for measuring, monitoring, and controlling the overall cost performance of the project. Also represents “Planned Value” 58
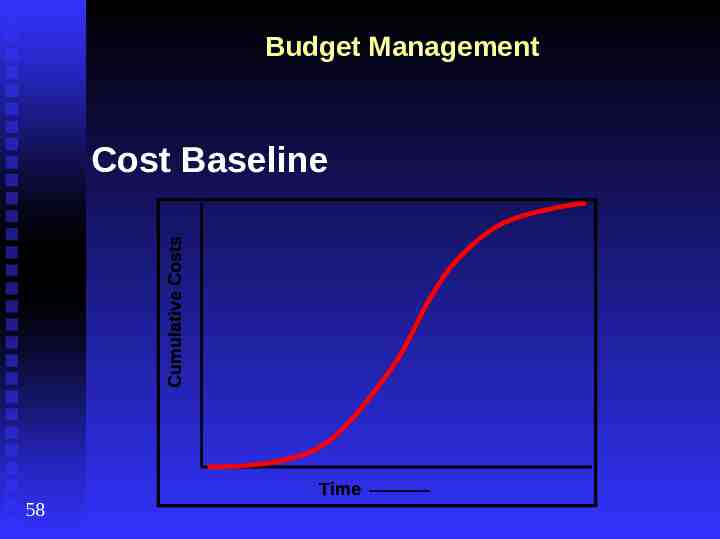
Budget Management Cumulative Costs Cost Baseline 58 Time
Budget Management Cost Control The process of influencing factors that create variances, and controlling changes to the project budget. 58
Budget Management Project cost control includes: Ensuring changes are agreed upon Managing changes when they occur Assure potential cost overruns do not exceed authorized funding Monitor cost performance and understand variances 58
Budget Management Project cost control includes: Recording all appropriate changes against the cost baseline Preventing incorrect, inappropriate, or unapproved changes Inform stakeholders of approved changes 59 Acting to bring overruns within limits
Budget Management Cost Change Control System Defines the procedures by which the cost baseline can be changed. WSDOT policy found in the Project Control & Reporting Guide Also documented in the Project Management Plan 59
Earned Value Management What is Earned Value Management (EVM)? A method of integrating scope, schedule, and resources, and for measuring project performance. 59 It compares the amount of work that was planned with what was actually earned with what was actually spent to determine if cost and schedule performance are as planned.
Earned Value Management What is needed for EVM? A baseline plan A project budget (BAC – Budget at Completion) A project end date 59 Tasks are identified & scheduled Each task has a budget or effort (resource loaded / weighting) Actuals tracked
Earned Value Management To perform EVM, three values need to be determined Planned Value (PV or BCWS) Actual Costs (AC or ACWP) Earned Value (EV or BCWP) 59
Earned Value Management Planned Value (PV) What are the budgeted costs of the work scheduled? Time phased based on baseline budget Only changes when baseline is changed Also referred as “BCWS” & “BAC” 60
Earned Value Management Actual Costs (AC) What are the actual costs of the work performed? Based on the actual completion of work packages Actual costs for reported work Also referred as “ACWP” 60
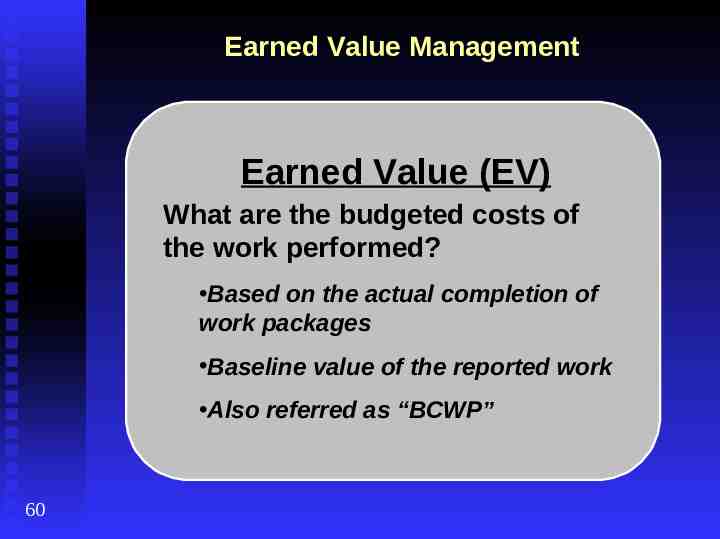
Earned Value Management Earned Value (EV) What are the budgeted costs of the work performed? Based on the actual completion of work packages Baseline value of the reported work Also referred as “BCWP” 60
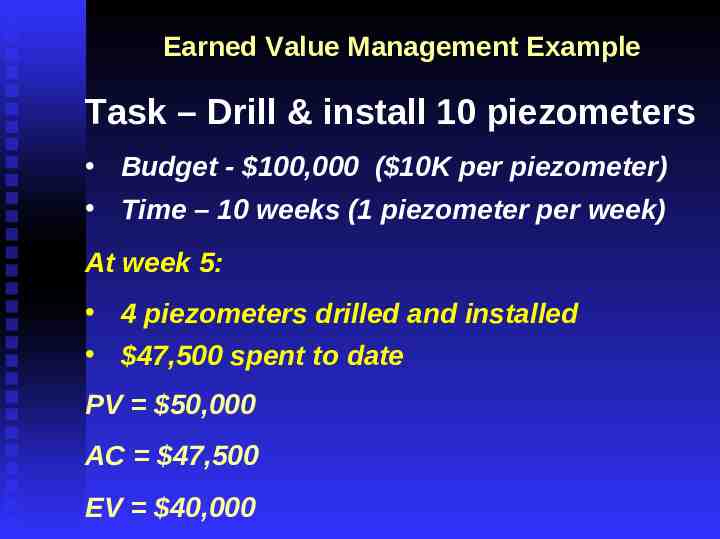
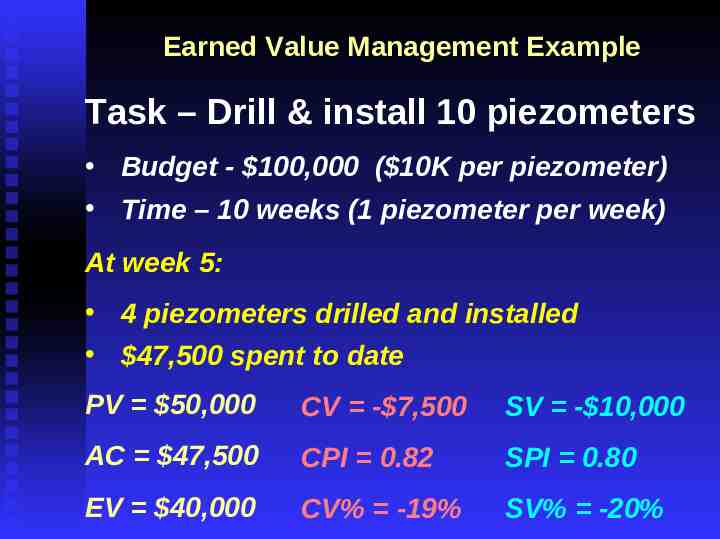
Earned Value Management Example Task – Drill & install 10 piezometers Budget - 100,000 ( 10K per piezometer) Time – 10 weeks (1 piezometer per week) At week 5: 4 piezometers drilled and installed 47,500 spent to date PV 50,000 AC 47,500 EV 40,000
Earned Value Management Calculating Earned Value and interpreting results to measure the progress of the project help identify trends forecast costs and identify ways to correct/mitigate project pitfalls. 60
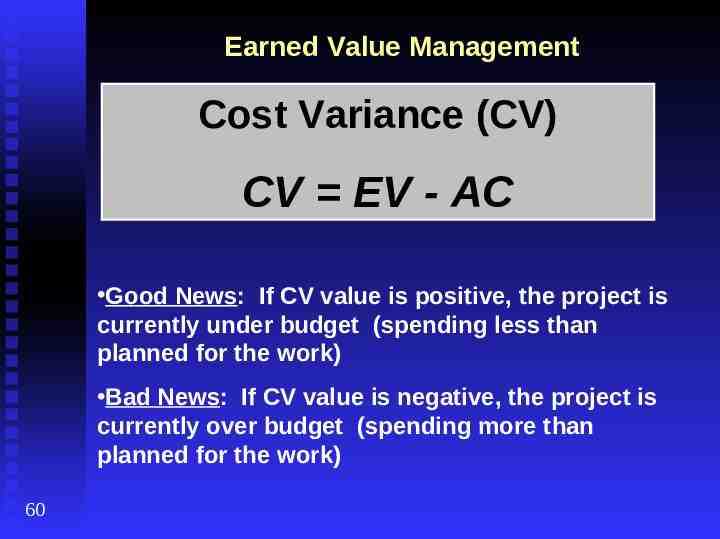
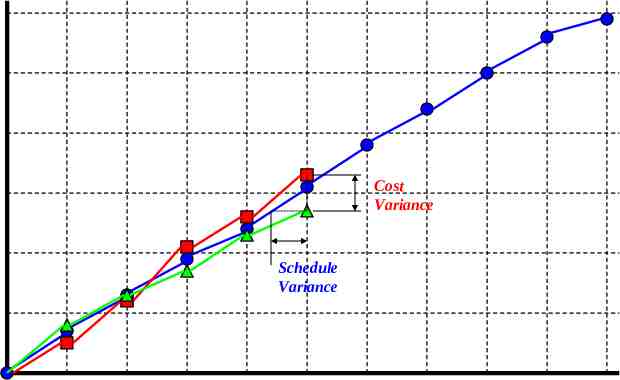
Earned Value Management Cost Variance (CV) CV EV - AC Good News: If CV value is positive, the project is currently under budget (spending less than planned for the work) Bad News: If CV value is negative, the project is currently over budget (spending more than planned for the work) 60
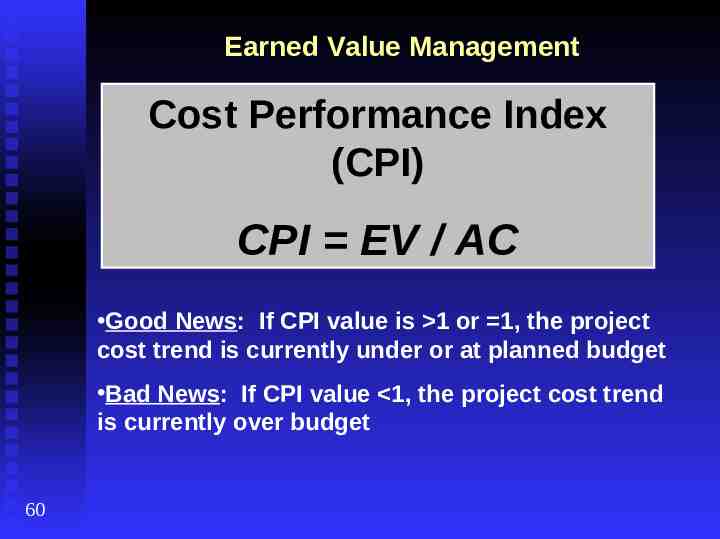
Earned Value Management Cost Performance Index (CPI) CPI EV / AC Good News: If CPI value is 1 or 1, the project cost trend is currently under or at planned budget Bad News: If CPI value 1, the project cost trend is currently over budget 60
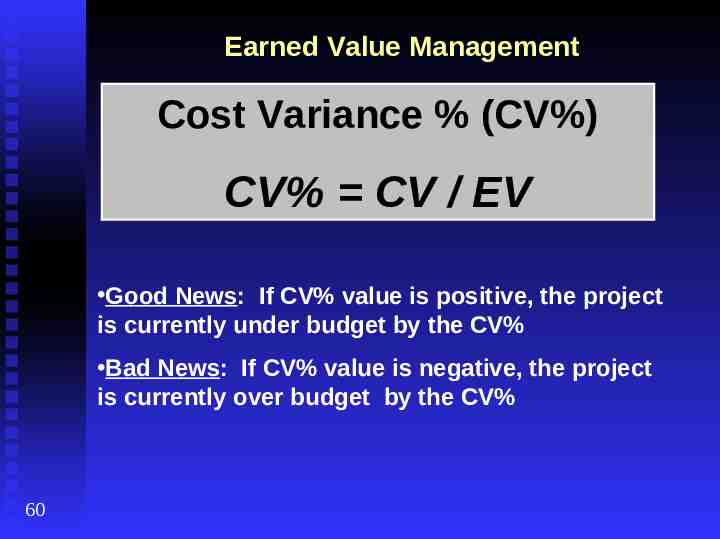
Earned Value Management Cost Variance % (CV%) CV% CV / EV Good News: If CV% value is positive, the project is currently under budget by the CV% Bad News: If CV% value is negative, the project is currently over budget by the CV% 60
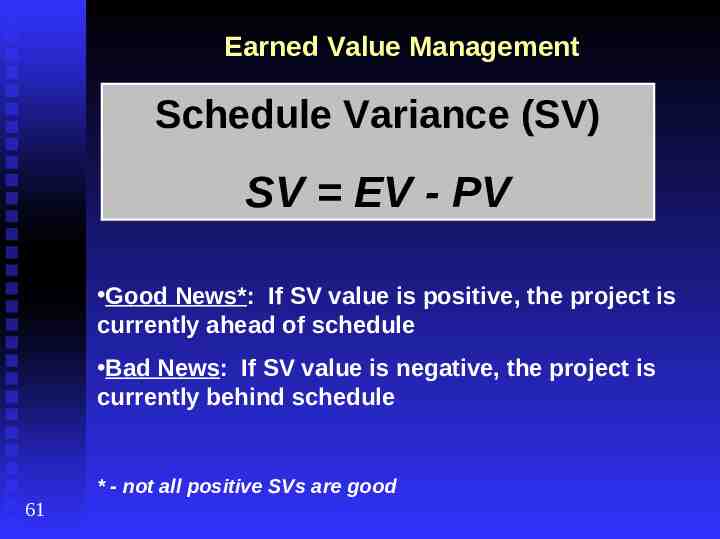
Earned Value Management Schedule Variance (SV) SV EV - PV Good News*: If SV value is positive, the project is currently ahead of schedule Bad News: If SV value is negative, the project is currently behind schedule * - not all positive SVs are good 61
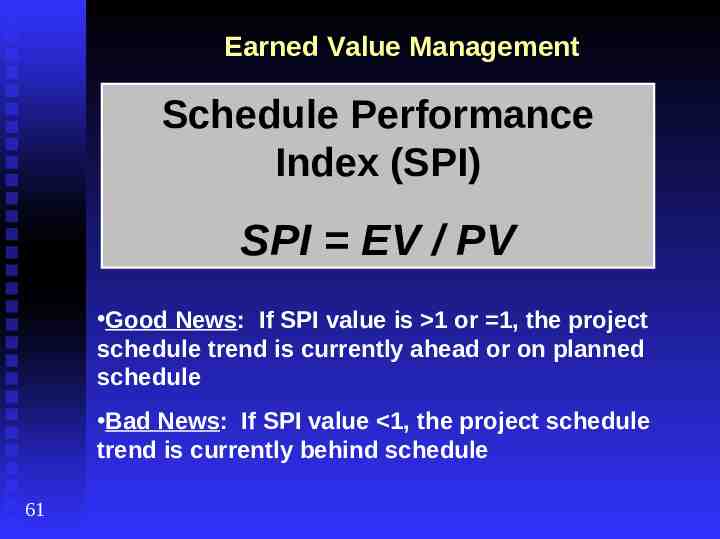
Earned Value Management Schedule Performance Index (SPI) SPI EV / PV Good News: If SPI value is 1 or 1, the project schedule trend is currently ahead or on planned schedule Bad News: If SPI value 1, the project schedule trend is currently behind schedule 61
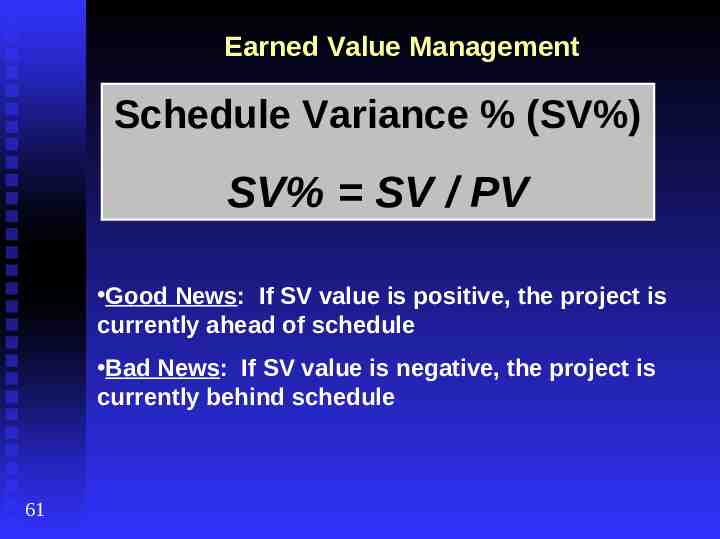
Earned Value Management Schedule Variance % (SV%) SV% SV / PV Good News: If SV value is positive, the project is currently ahead of schedule Bad News: If SV value is negative, the project is currently behind schedule 61
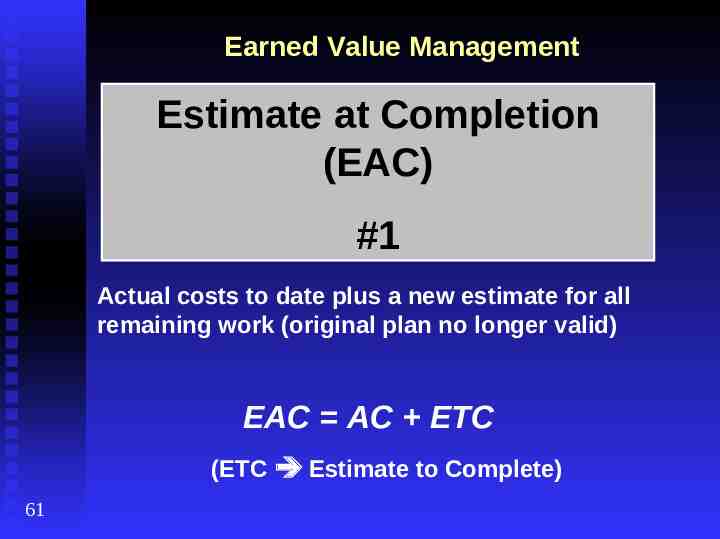
Earned Value Management Estimate at Completion (EAC) #1 Actual costs to date plus a new estimate for all remaining work (original plan no longer valid) EAC AC ETC (ETC Estimate to Complete) 61
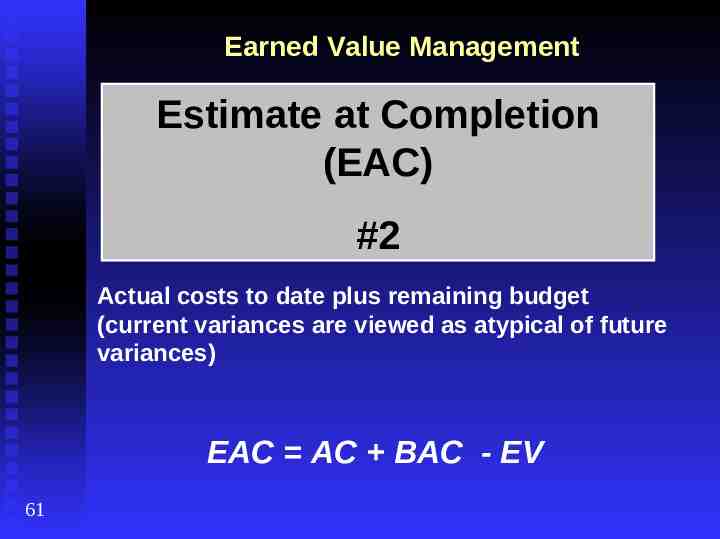
Earned Value Management Estimate at Completion (EAC) #2 Actual costs to date plus remaining budget (current variances are viewed as atypical of future variances) EAC AC BAC - EV 61
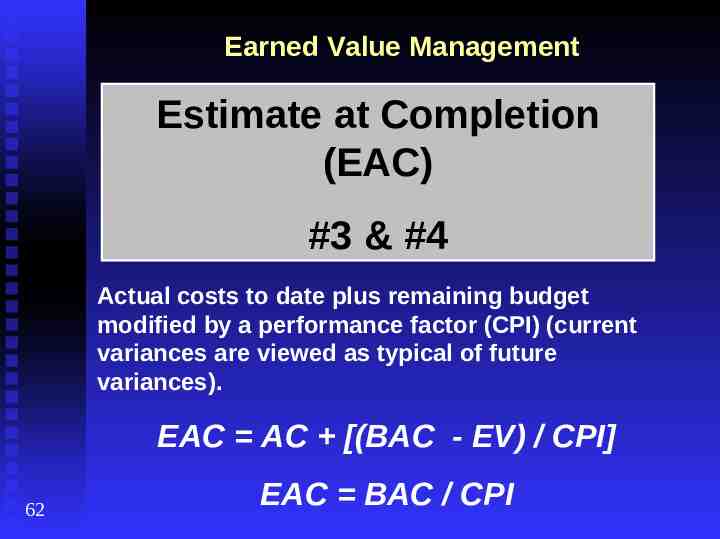
Earned Value Management Estimate at Completion (EAC) #3 & #4 Actual costs to date plus remaining budget modified by a performance factor (CPI) (current variances are viewed as typical of future variances). EAC AC [(BAC - EV) / CPI] 62 EAC BAC / CPI
Earned Value Management Example Task – Drill & install 10 piezometers Budget - 100,000 ( 10K per piezometer) Time – 10 weeks (1 piezometer per week) At week 5: 4 piezometers drilled and installed 47,500 spent to date PV 50,000 CV - 7,500 SV - 10,000 AC 47,500 CPI 0.82 SPI 0.80 EV 40,000 CV% -19% SV% -20%
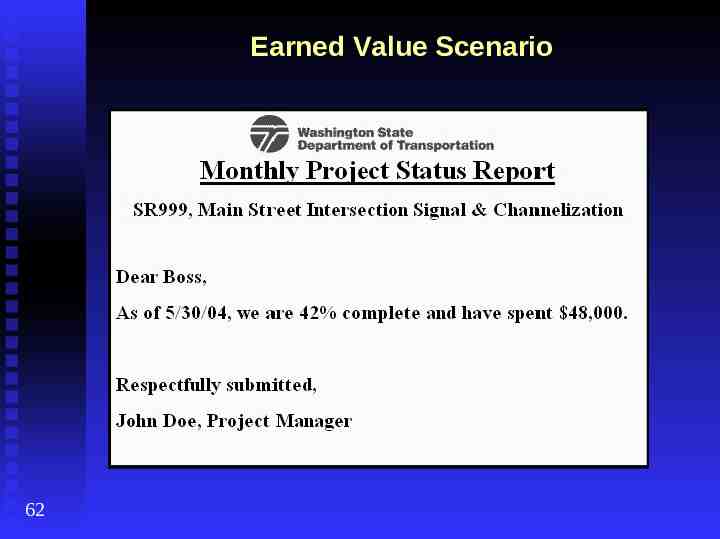
Earned Value Scenario 62
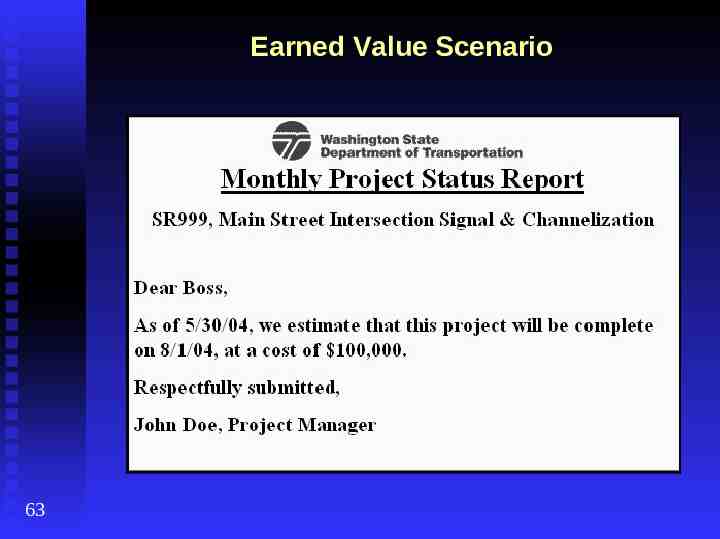
Earned Value Scenario 63
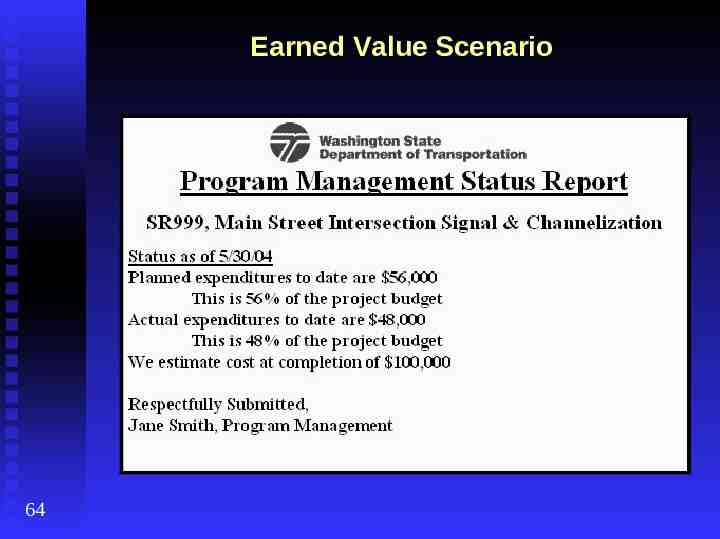
Earned Value Scenario 64
Earned Value Scenario 65
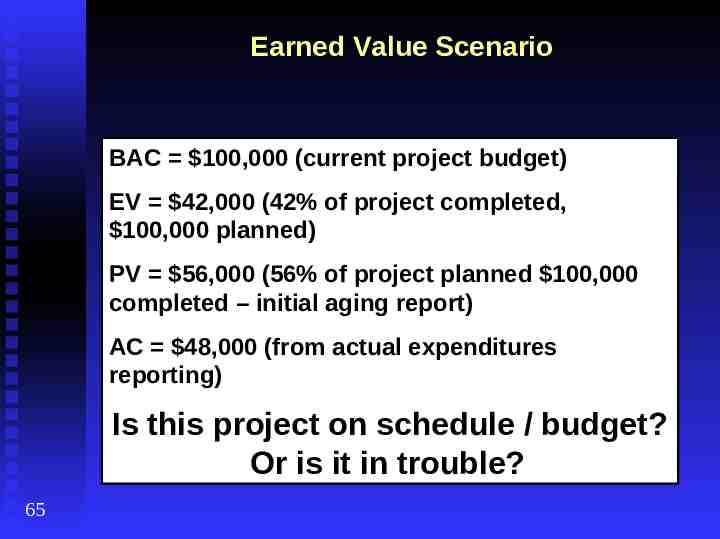
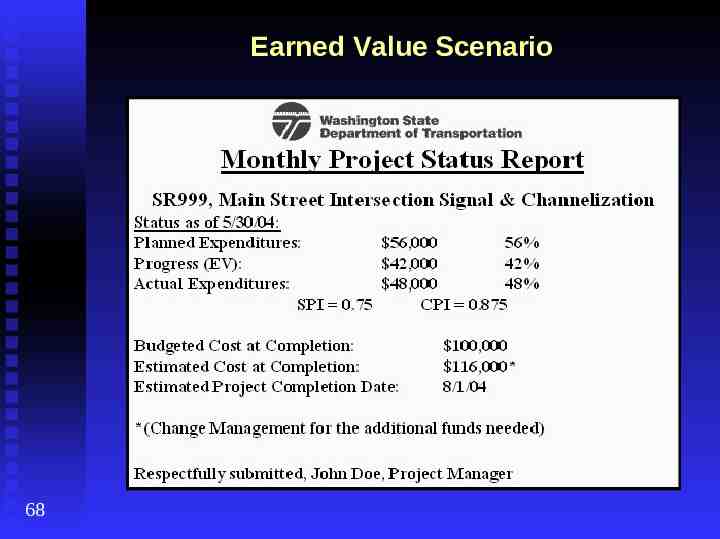
Earned Value Scenario BAC 100,000 (current project budget) EV 42,000 (42% of project completed, 100,000 planned) PV 56,000 (56% of project planned 100,000 completed – initial aging report) AC 48,000 (from actual expenditures reporting) Is this project on schedule / budget? Or is it in trouble? 65
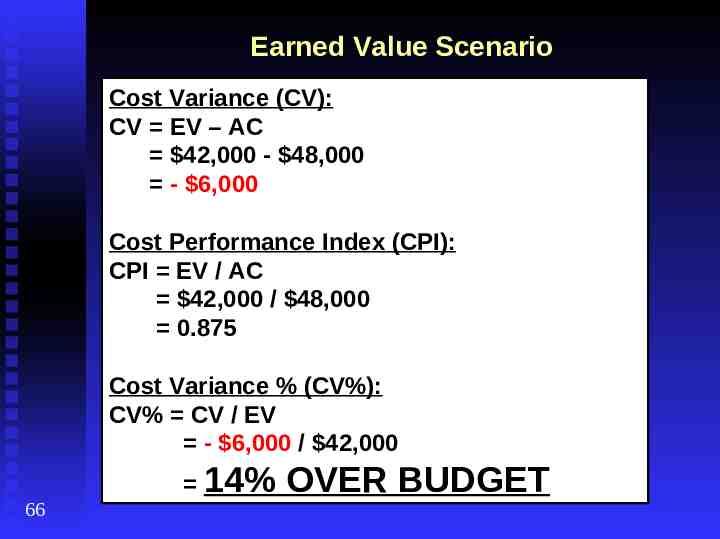
Earned Value Scenario Cost Variance (CV): CV EV – AC 42,000 - 48,000 - 6,000 Cost Performance Index (CPI): CPI EV / AC 42,000 / 48,000 0.875 Cost Variance % (CV%): CV% CV / EV - 6,000 / 42,000 66 14% OVER BUDGET
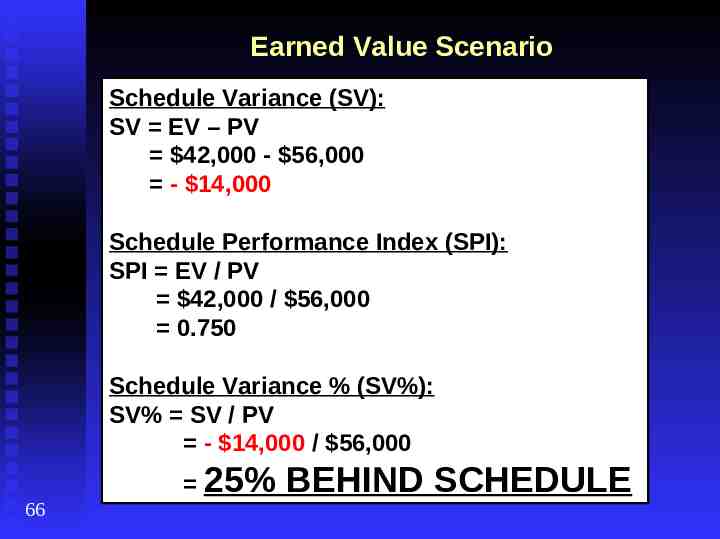
Earned Value Scenario Schedule Variance (SV): SV EV – PV 42,000 - 56,000 - 14,000 Schedule Performance Index (SPI): SPI EV / PV 42,000 / 56,000 0.750 Schedule Variance % (SV%): SV% SV / PV - 14,000 / 56,000 66 25% BEHIND SCHEDULE
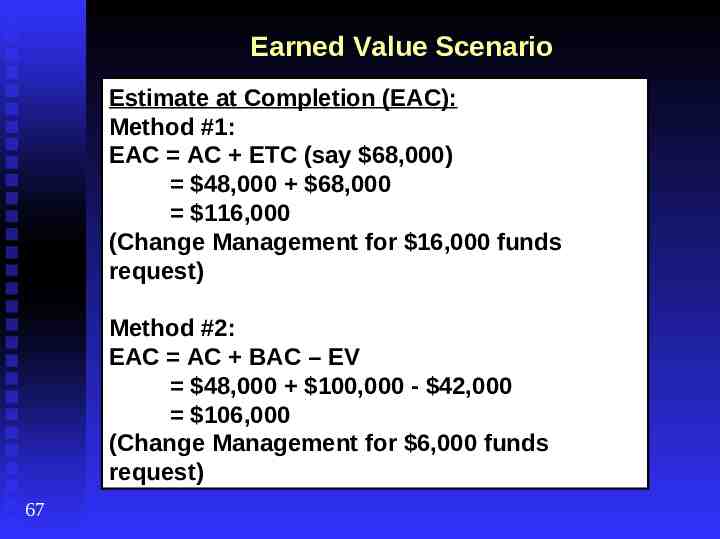
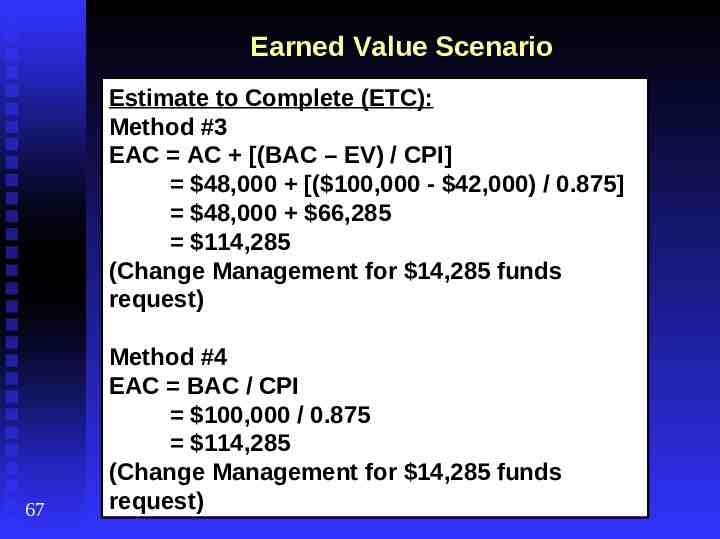
Earned Value Scenario Estimate at Completion (EAC): Method #1: EAC AC ETC (say 68,000) 48,000 68,000 116,000 (Change Management for 16,000 funds request) Method #2: EAC AC BAC – EV 48,000 100,000 - 42,000 106,000 (Change Management for 6,000 funds request) 67
Earned Value Scenario Estimate to Complete (ETC): Method #3 EAC AC [(BAC – EV) / CPI] 48,000 [( 100,000 - 42,000) / 0.875] 48,000 66,285 114,285 (Change Management for 14,285 funds request) 67 Method #4 EAC BAC / CPI 100,000 / 0.875 114,285 (Change Management for 14,285 funds request)
Earned Value Scenario 68
Budget Management Module 6 Exercise Work as a team to perform EVM on assigned project on page 69. Prepare a report similar to the module scenario reporting project progress. 69 Brief class on methods of recovery, if needed, for project.
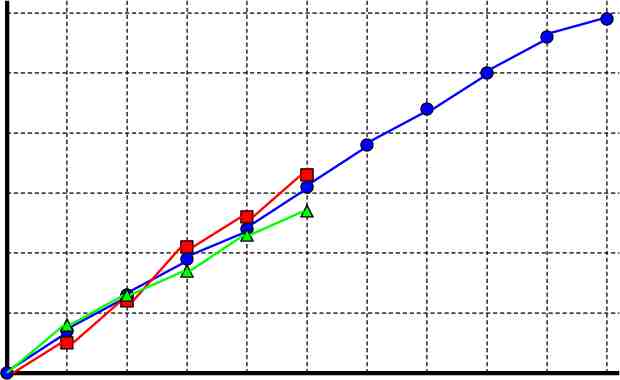
Budget Management Graphing Earned Value exercise Gantt chart baseline (report) EVM graph Task information Cost distribution EVM worksheets
Budget Management Graphing Earned Value exercise Planned Value (PV) is always shown in blue with circle nodes Actual Cost (AC) is always shown in red with square nodes Earned Value (EV) is always shown in green with triangle nodes
Budget Management Graphing Earned Value exercise Work together as a team to calculate the task cost (task budget) for each task Record these values on the worksheet with the total (BAC) calculated Warning: Wait to plot on the EVM graph as a class – we will use the Cost Distribution Report
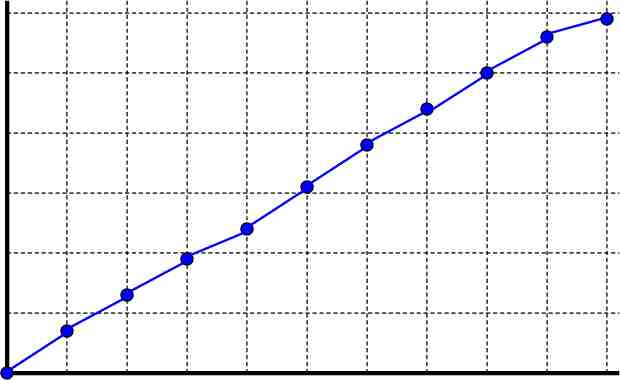
60K 50K 40K 30K 20K 10K 1w 2w 3w 4w 5w 6w 7w 8w 9w 10w
Budget Management Graphing Earned Value – week 1 Task A started on time – 30% complete Task B started 2 days late – 30% complete Task C started 1 day late – 25% complete Tasks D, E, F, G, H, and J have not started Project Management is on-going Actual Costs reported for week 1 5000
60K 50K 40K 30K 20K 10K 1w 2w 3w 4w 5w 6w 7w 8w 9w 10w
60K 50K 40K Cost Variance 30K 20K Schedule Variance 10K 1w 2w 3w 4w 5w 6w 7w 8w 9w 10w