Bronx Community Health Dashboard: Diabetes Last Updated: 4/19/2019

17 Slides5.86 MB
Bronx Community Health Dashboard: Diabetes Last Updated: 4/19/2019 See last slide for more information about this project. 1
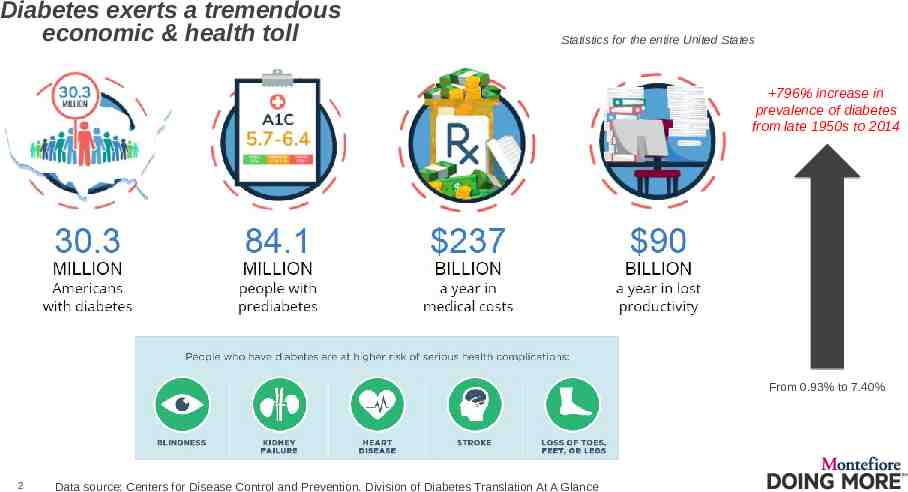
Diabetes exerts a tremendous economic & health toll Statistics for the entire United States 796% increase in prevalence of diabetes from late 1950s to 2014 From 0.93% to 7.40% 2 Data source: Centers for Disease Control and Prevention. Division of Diabetes Translation At A Glance
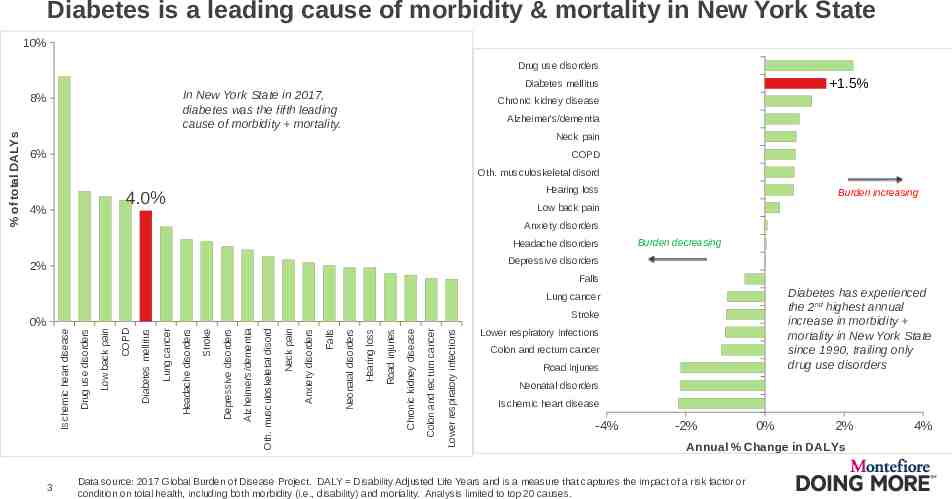
Diabetes is a leading cause of morbidity & mortality in New York State 10% Drug use disorders Chronic kidney disease Alzheimer's/dementia Neck pain 6% COPD Oth. musculoskeletal disord Hearing loss 4.0% 4% Burden increasing Low back pain Anxiety disorders Headache disorders Burden decreasing Depressive disorders 2% Falls Diabetes has experienced the 2nd highest annual increase in morbidity mortality in New York State since 1990, trailing only drug use disorders Lung cancer 3 Lower respiratory infections Colon and rectum cancer Chronic kidney disease Road injuries Hearing loss Neonatal disorders Falls Anxiety disorders Neck pain Oth. musculoskeletal disord Alzheimer's/dementia Depressive disorders Stroke Headache disorders Lung cancer Diabetes mellitus Low back pain Drug use disorders COPD Stroke 0% Ischemic heart disease % of total DALYs 8% 1.5% Diabetes mellitus In New York State in 2017, diabetes was the fifth leading cause of morbidity mortality. Lower respiratory infections Colon and rectum cancer Road injuries Neonatal disorders Ischemic heart disease -4% -2% 0% 2% Annual % Change in DALYs Data source: 2017 Global Burden of Disease Project. DALY Disability Adjusted Life Years and is a measure that captures the impact of a risk factor or condition on total health, including both morbidity (i.e., disability) and mortality. Analysis limited to top 20 causes. 4%
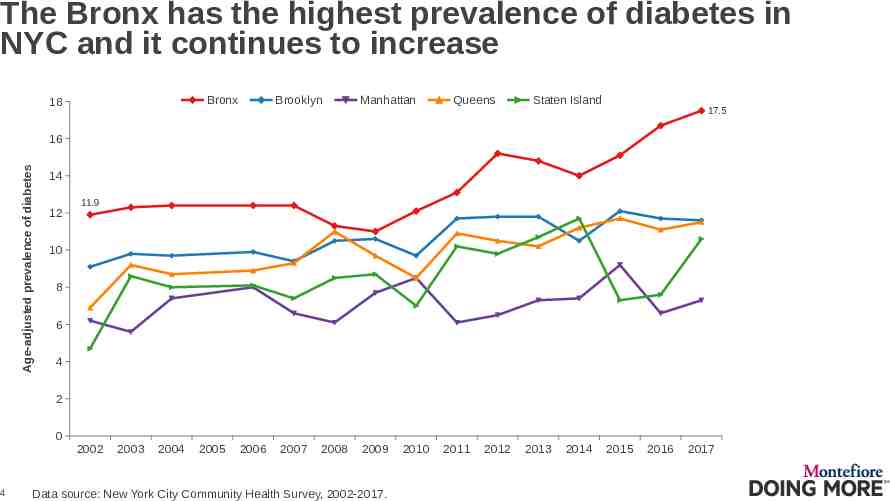
The Bronx has the highest prevalence of diabetes in NYC and it continues to increase Bronx 18 Brooklyn Manhattan Queens Staten Island 17.5 Age-adjusted prevalence of diabetes 16 14 12 11.9 10 8 6 4 2 0 4 2002 2003 2004 2005 2006 2007 2008 2009 Data source: New York City Community Health Survey, 2002-2017. 2010 2011 2012 2013 2014 2015 2016 2017
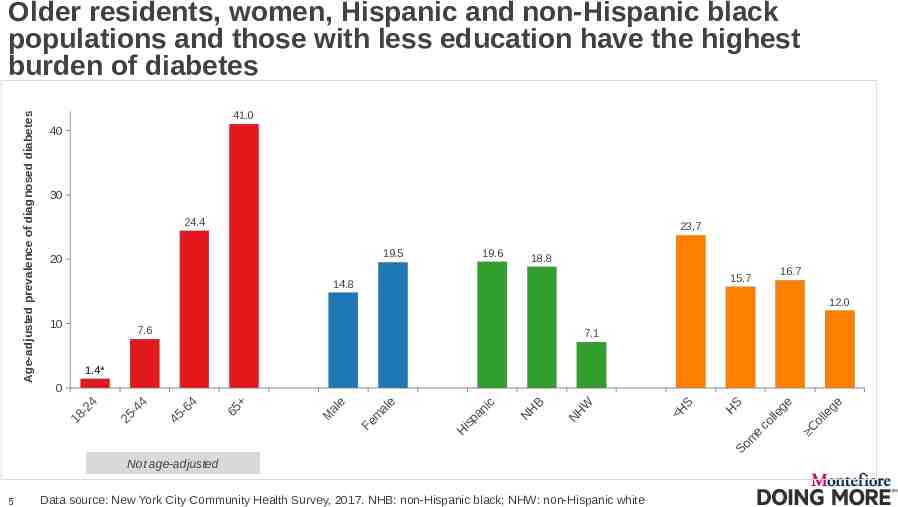
Age-adjusted prevalence of diagnosed diabetes Older residents, women, Hispanic and non-Hispanic black populations and those with less education have the highest burden of diabetes 41.0 40 30 24.4 23.7 19.6 19.5 20 18.8 12.0 10 7.6 7.1 1.4* 0 4 -2 8 1 4 -4 5 2 4 -6 5 4 65 al M e F e al em H c ni a p is N H B N H W Not age-adjusted 5 16.7 15.7 14.8 Data source: New York City Community Health Survey, 2017. NHB: non-Hispanic black; NHW: non-Hispanic white H S H S S e om co ll e ge C o lle ge
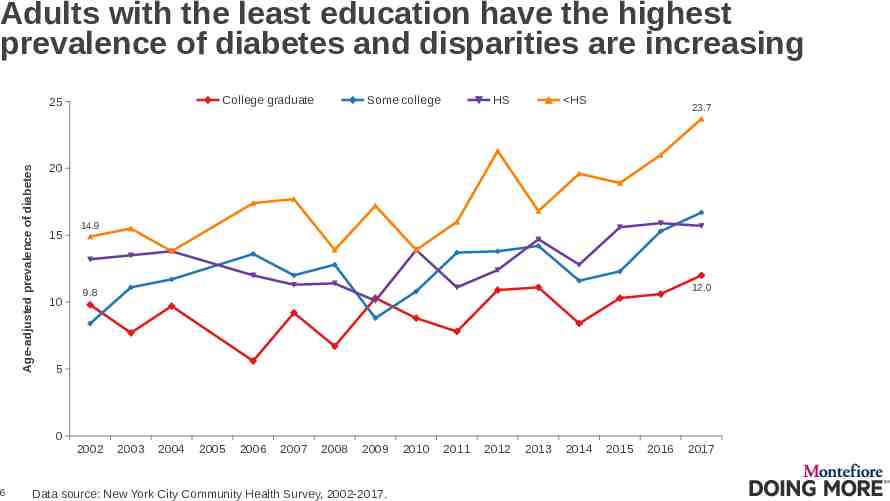
Adults with the least education have the highest prevalence of diabetes and disparities are increasing College graduate Age-adjusted prevalence of diabetes 25 HS HS 23.7 20 15 10 14.9 12.0 9.8 5 0 6 Some college 2002 2003 2004 2005 2006 2007 2008 2009 Data source: New York City Community Health Survey, 2002-2017. 2010 2011 2012 2013 2014 2015 2016 2017
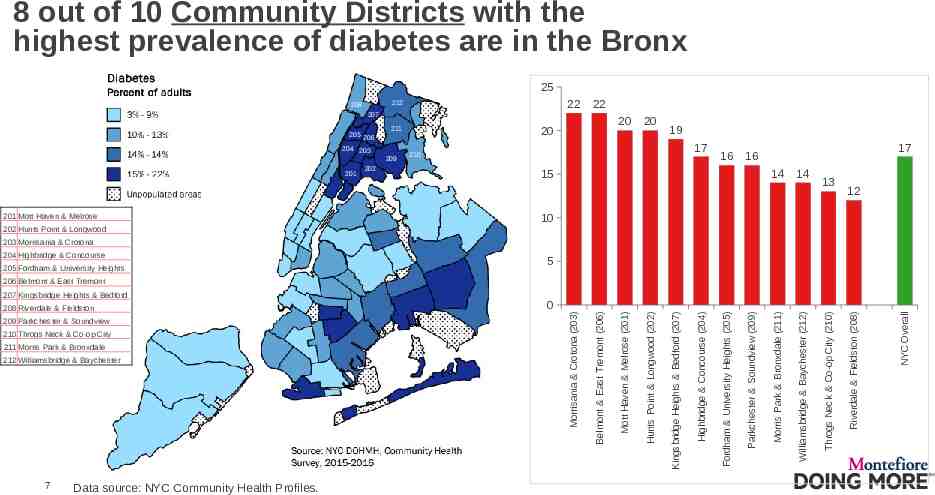
8 out of 10 Community Districts with the highest prevalence of diabetes are in the Bronx 25 22 212 208 22 207 205 206 204 203 209 201 201 Mott Haven & Melrose 202 20 20 211 20 19 17 210 16 17 16 14 15 14 13 12 10 202 Hunts Point & Longwood 203 Morrisania & Crotona 204 Highbridge & Concourse 205 Fordham & University Heights 5 206 Belmont & East Tremont 7 Data source: NYC Community Health Profiles. NYC Overall Riverdale & Fieldston (208) Throgs Neck & Co-op City (210) Williamsbridge & Baychester (212) Morris Park & Bronxdale (211) Parkchester & Soundview (209) Fordham & University Heights (205) Highbridge & Concourse (204) Kingsbridge Heights & Bedford (207) 211 Morris Park & Bronxdale 212 Williamsbridge & Baychester Hunts Point & Longwood (202) 210 Throgs Neck & Co-op City 0 Mott Haven & Melrose (201) 209 Parkchester & Soundview Belmont & East Tremont (206) 208 Riverdale & Fieldston Morrisania & Crotona (203) 207 Kingsbridge Heights & Bedford
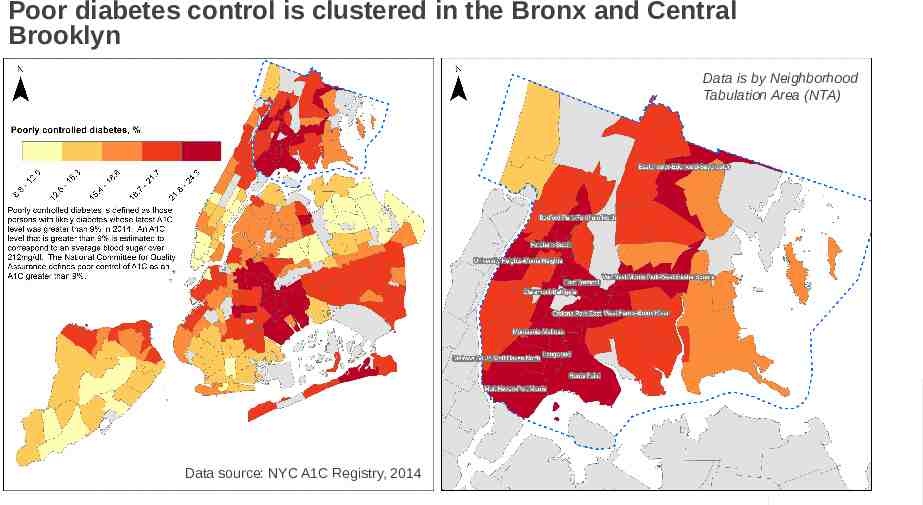
Poor diabetes control is clustered in the Bronx and Central Brooklyn Data is by Neighborhood Tabulation Area (NTA) 8 Data source: NYC A1C Registry, 2014
Diabetes Hospitalizations 9
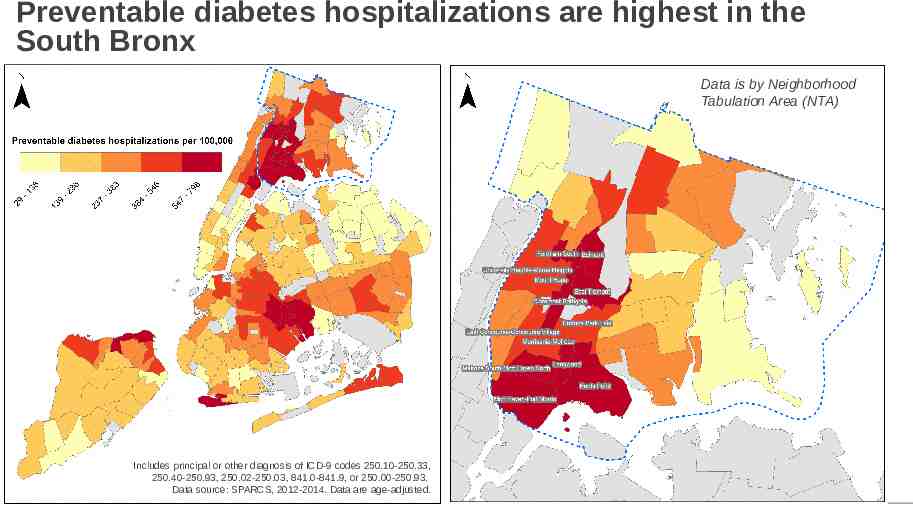
Preventable diabetes hospitalizations are highest in the South Bronx Data is by Neighborhood Tabulation Area (NTA) 10 Includes principal or other diagnosis of ICD-9 codes 250.10-250.33, 250.40-250.93, 250.02-250.03, 841.0-841.9, or 250.00-250.93. Data source: SPARCS, 2012-2014. Data are age-adjusted.
Diabetes Mortality 11
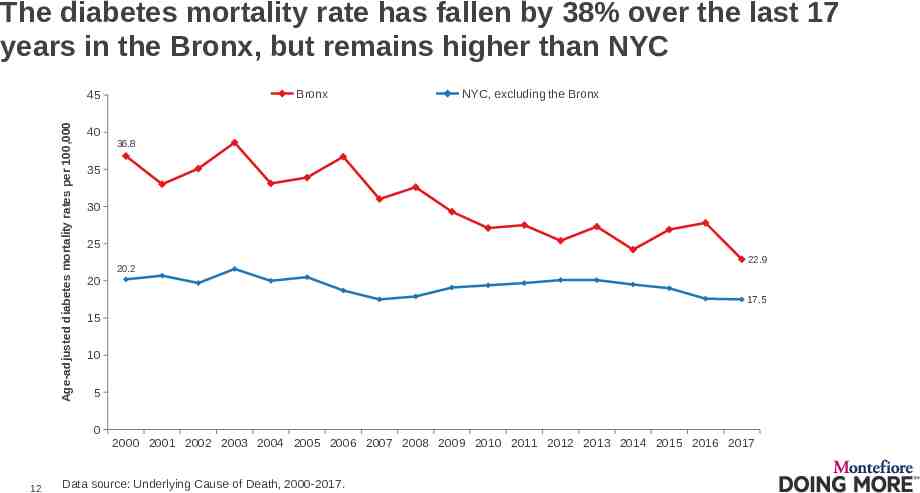
The diabetes mortality rate has fallen by 38% over the last 17 years in the Bronx, but remains higher than NYC Bronx Age-adjusted diabetes mortality rates per 100,000 45 40 NYC, excluding the Bronx 36.8 35 30 25 20.2 22.9 20 17.5 15 10 5 0 2000 2001 2002 2003 2004 2005 2006 2007 2008 2009 2010 2011 2012 2013 2014 2015 2016 2017 12 Data source: Underlying Cause of Death, 2000-2017.
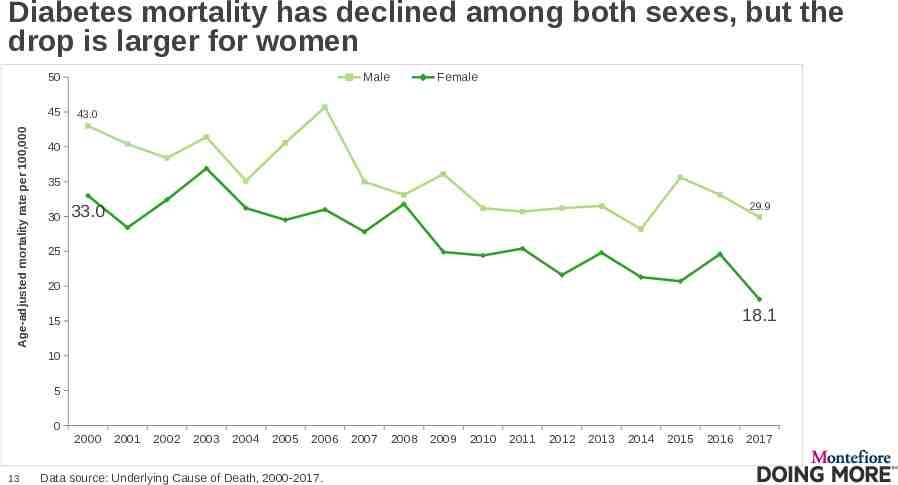
Diabetes mortality has declined among both sexes, but the drop is larger for women 50 Age-adjusted mortality rate per 100,000 45 Male Female 43.0 40 35 30 29.9 33.0 25 20 18.1 15 10 5 0 2000 13 2001 2002 2003 2004 2005 2006 Data source: Underlying Cause of Death, 2000-2017. 2007 2008 2009 2010 2011 2012 2013 2014 2015 2016 2017
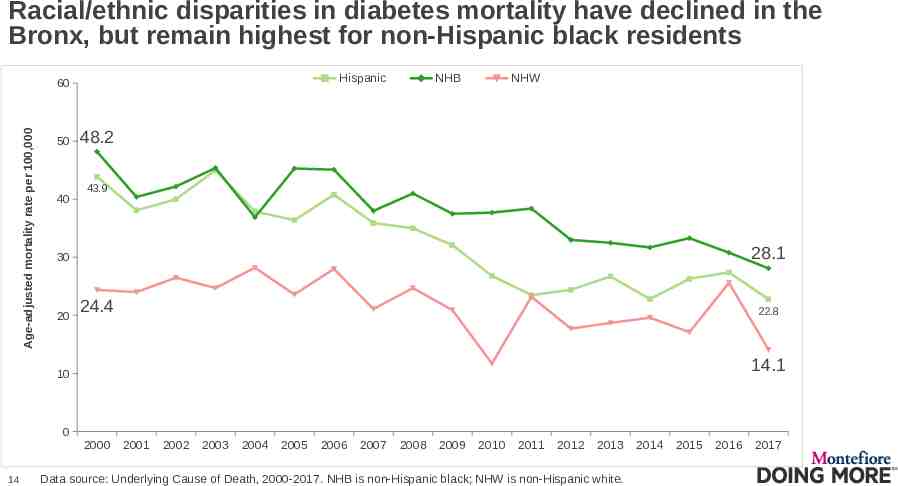
Racial/ethnic disparities in diabetes mortality have declined in the Bronx, but remain highest for non-Hispanic black residents Hispanic Age-adjusted mortality rate per 100,000 60 50 40 NHB NHW 48.2 43.9 28.1 30 20 24.4 22.8 14.1 10 0 14 2000 2001 2002 2003 2004 2005 2006 2007 2008 2009 2010 2011 2012 2013 Data source: Underlying Cause of Death, 2000-2017. NHB is non-Hispanic black; NHW is non-Hispanic white. 2014 2015 2016 2017
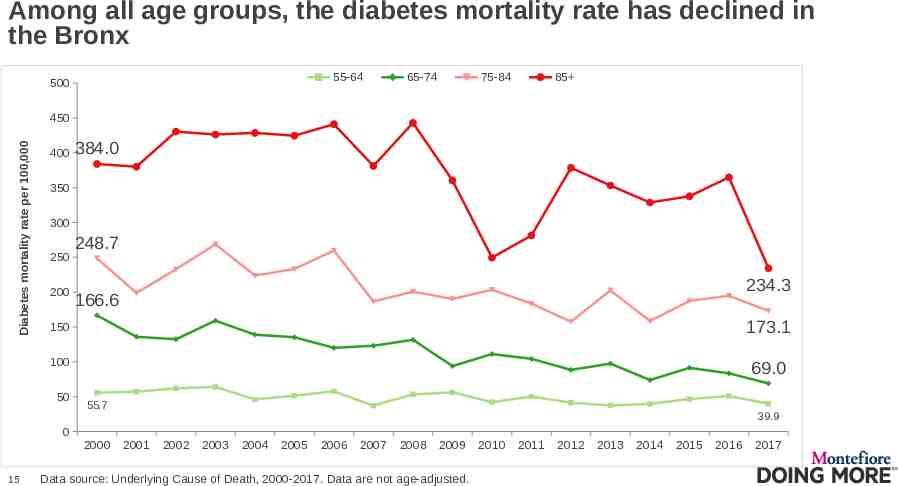
Among all age groups, the diabetes mortality rate has declined in the Bronx 55-64 500 65-74 75-84 85 Diabetes mortality rate per 100,000 450 400 350 300 250 200 248.7 234.3 166.6 150 173.1 100 69.0 50 0 15 384.0 55.7 2000 39.9 2001 2002 2003 2004 2005 2006 2007 2008 2009 Data source: Underlying Cause of Death, 2000-2017. Data are not age-adjusted. 2010 2011 2012 2013 2014 2015 2016 2017
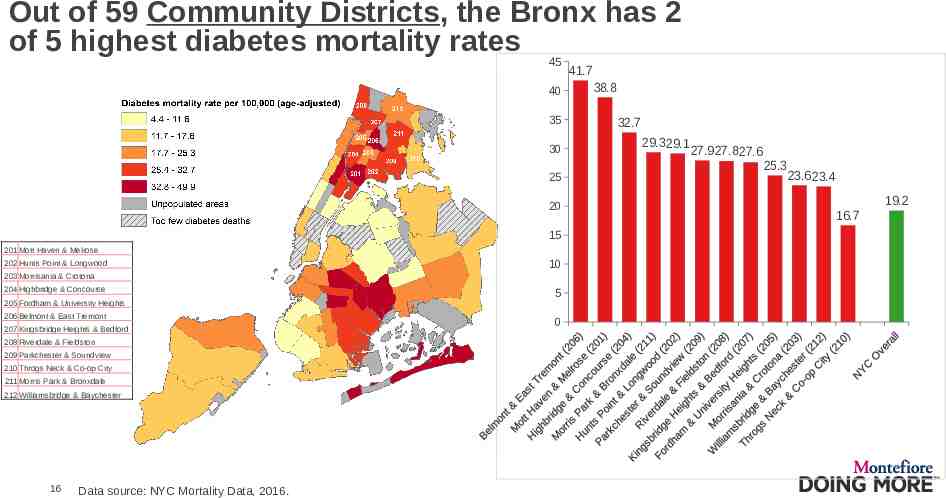
Out of 59 Community Districts, the Bronx has 2 of 5 highest diabetes mortality rates 45 40 35 30 25 20 15 201 Mott Haven & Melrose 202 Hunts Point & Longwood 10 203 Morrisania & Crotona 204 Highbridge & Concourse 205 Fordham & University Heights 206 Belmont & East Tremont 207 Kingsbridge Heights & Bedford 208 Riverdale & Fieldston 209 Parkchester & Soundview 210 Throgs Neck & Co-op City 211 Morris Park & Bronxdale 212 Williamsbridge & Baychester 16 Data source: NYC Mortality Data, 2016. 5 0 41.7 38.8 32.7 29.3 29.1 27.9 27.8 27.6 25.3 23.6 23.4 16.7 19.2
About the Community Health Dashboard Project The goal of the project is to provide Bronx-specific data on risk factors and health outcomes with an emphasis on presenting data on trends, socio-demographic differences (e.g., by age, sex, race/ethnicity, etc.) and sub-county/neighborhood level data Dashboards will be periodically updated as new data becomes available. Produced by Montefiore’s Office of Community & Population Health using publicly-available data sources For more information please contact us at [email protected] 17