An Analysis of Farmer Preferences Regarding Filter Strip Programs Greg
32 Slides249.83 KB
An Analysis of Farmer Preferences Regarding Filter Strip Programs Greg Howard Work in collaboration with Dr. Brian Roe Department of AED Economics Ohio State University November19, 2012 [email protected]
Lake Erie: A Big Freaking Deal Drinking water for 11 million people Over 20 power plants 300 marinas in Ohio alone 40% of all Great Lakes charter boats One of top 10 sport fishing locations in the world The most valuable freshwater commercial fishery in the world (Walleye capital of the world) Coastal county tourism value is over 10 billion (7 coastal counties over 25% of Ohio 88-county total) Issues with nutrient pollution Phosphorous and Nitrogen Howard: An Analysis of Farmer Preferences Regarding BMPs 2
Nutrient Pollution High nutrient loads in lakes can cause harmful algal blooms (HABs) Why are large algal blooms harmful? Released toxins Lower water quality Hypoxic (dead) zones Howard: An Analysis of Farmer Preferences Regarding BMPs 3
Lake Erie History In ‘60s, huge nutrient problems Cuyahoga river burns in 1969 Clean Water Act passes in 1972 P levels stable from 1970-75 Improving from 1975-95 How did we do it? Point source reductions Majority of loading in 1970 was point source Now agriculture accounts for 2/3 of Howard: An Analysis of Farmer Preferences Regarding BMPs 4 loading
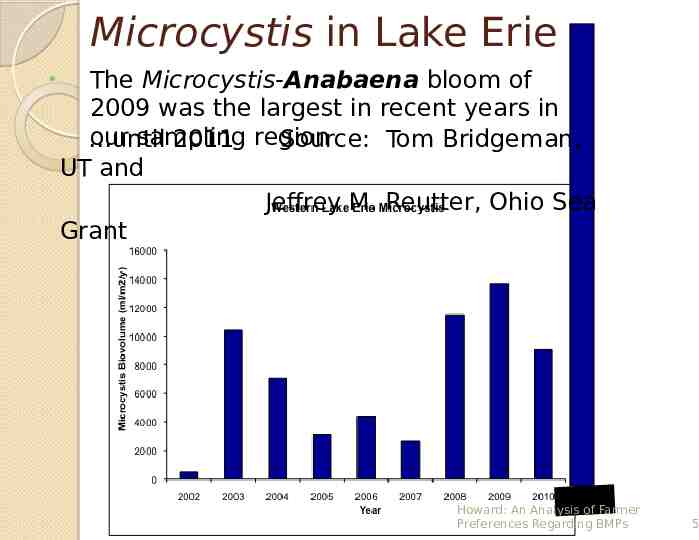
Microcystis in Lake Erie The Microcystis-Anabaena bloom of 2009 was the largest in recent years in our sampling until 2011 region Source: Tom Bridgeman, UT and Jeffrey M. Reutter, Ohio Sea Grant 11 20of Farmer Howard: An Analysis Preferences Regarding BMPs 5
Government Response Regulation Market-based Solutions Nutrient taxes Nutrient trading programs (Ohio River Basin) Payment for Ecosystem Services (PES) programs Pay farmers for implementation of Best Management Practices (BMPs) Howard: An Analysis of Farmer Preferences Regarding BMPs 6
Best Management Practices Soil testing and variable-rate application Avoiding fertilizer application before storm events or in winter Winter cover crops Filter strips Retention areas Conservation tillage/No till Field retirement Howard: An Analysis of Farmer Preferences Regarding BMPs 7
Where is the Economic Problem? Question facing government: How to make these programs better? 1. More effective practices 2. Greater adoption rates (more acres enrolled) 3. Lower cost Howard: An Analysis of Farmer Preferences Regarding BMPs 8
More Specifically How do farmer perceptions of filter strip effectiveness influence filter strip program choice? Do farmers exhibit substantial preference heterogeneity for filter strip programs? Howard: An Analysis of Farmer Preferences Regarding BMPs 9
Perceptions of Filter Strip Effectiveness Ma, Swinton, Lupi, and JolejoleForeman (2012) Consider a series of cropping systems, and control for farmer perceptions of ecosystem services from a cropping system Qualitative, and possibly endogenous This study uses a quantitative measure and instruments for perceived efficacy using a twoHoward: An Analysis of Farmer Preferences Regarding BMPs 10
Preference Heterogeneity Latent Class Analysis (LCA) allows for preference heterogeneity Farmers belong to one of several latent (unobserved) groups For each group, variables of interest (predictors) can have different marginal effects Can use other variables (covariates) to inform class membership Howard: An Analysis of Farmer Preferences Regarding BMPs 11
Latent Class Analysis (LCA) Example: Effect of LeBron James endorsement Some people are more likely to buy a product if James endorses it Other people (Ohioans and New Yorkers) may be less likely to buy if James endorses Assuming preference homogeneity Little or no effect of endorsement LCA can capture differences Howard: An Analysis of Farmer Preferences Regarding BMPs 12
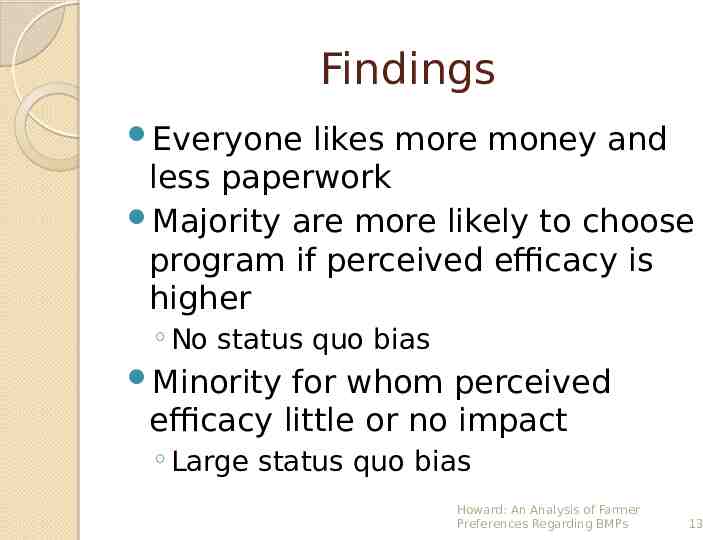
Findings Everyone likes more money and less paperwork Majority are more likely to choose program if perceived efficacy is higher No status quo bias Minority for whom perceived efficacy little or no impact Large status quo bias Howard: An Analysis of Farmer Preferences Regarding BMPs 13
Rest of the Talk Survey and data Model Results Implications and conclusion Howard: An Analysis of Farmer Preferences Regarding BMPs 14
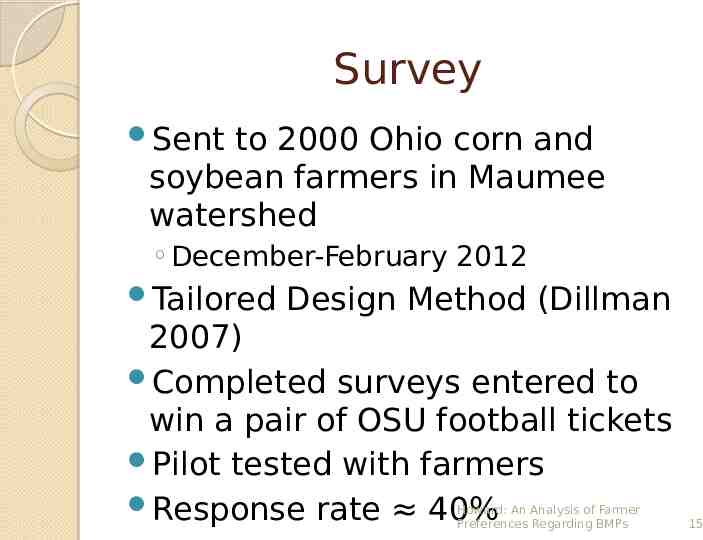
Survey Sent to 2000 Ohio corn and soybean farmers in Maumee watershed December-February 2012 Tailored Design Method (Dillman 2007) Completed surveys entered to win a pair of OSU football tickets Pilot tested with farmers Response rate 40% Howard: An Analysis of Farmer Preferences Regarding BMPs 15
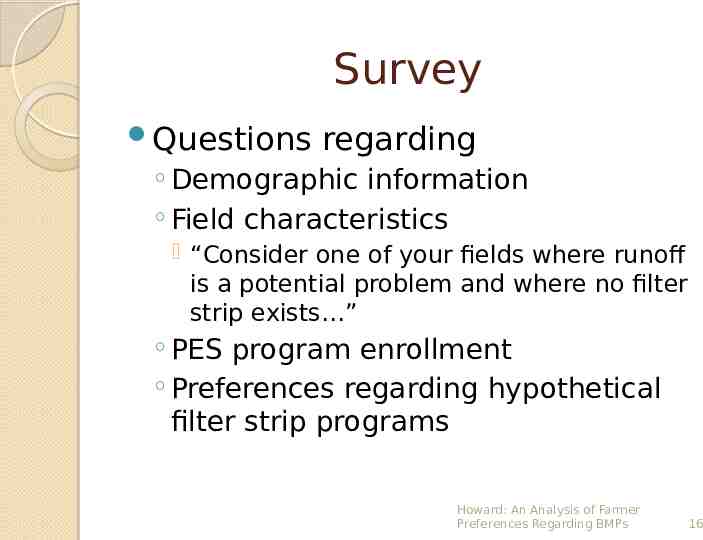
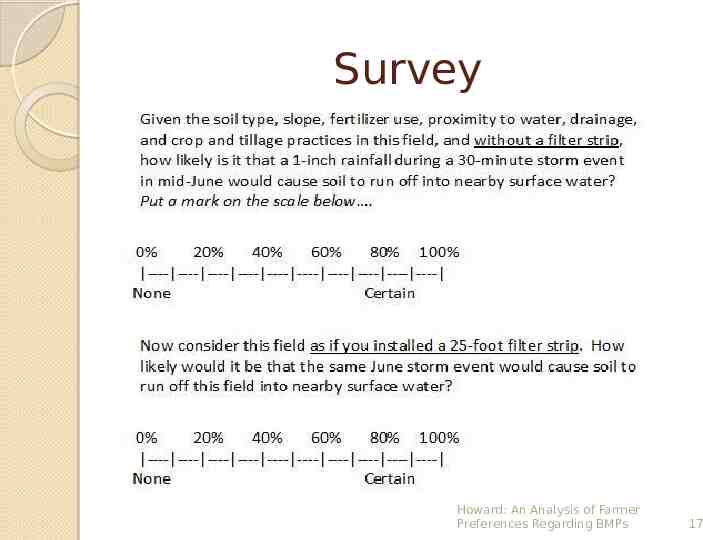
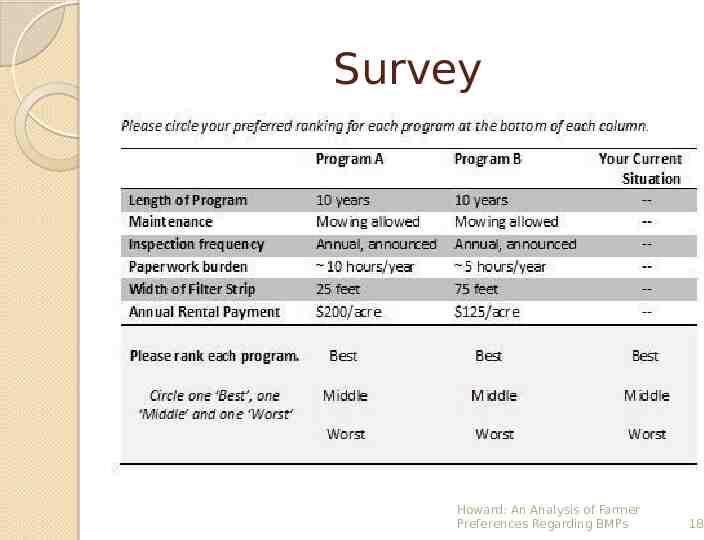
Survey Questions regarding Demographic information Field characteristics “Consider one of your fields where runoff is a potential problem and where no filter strip exists ” PES program enrollment Preferences regarding hypothetical filter strip programs Howard: An Analysis of Farmer Preferences Regarding BMPs 16
Survey Howard: An Analysis of Farmer Preferences Regarding BMPs 17
Survey Howard: An Analysis of Farmer Preferences Regarding BMPs 18
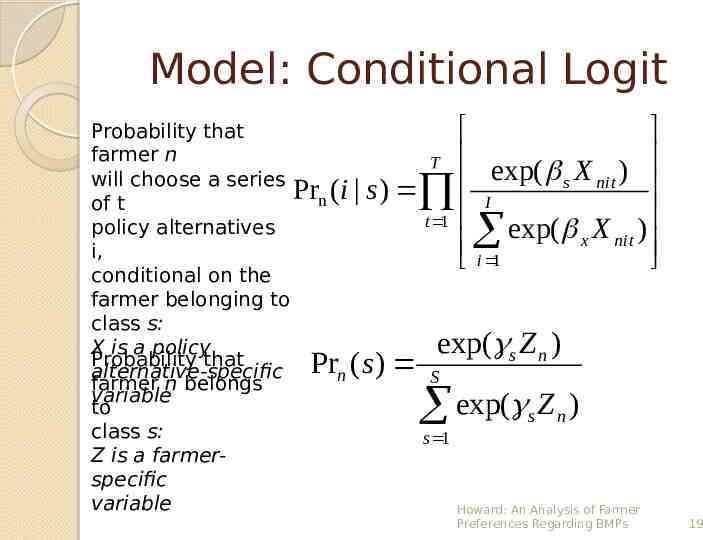
Model: Conditional Logit Probability that farmer n T exp( X ) will choose a series s nit Pr ( i s ) n I of t t 1 policy alternatives exp( x X nit ) i 1 i, conditional on the farmer belonging to class s: exp( s Z n ) X is a policy Probability that alternative-specific Prn ( s ) S farmer n belongs variable to exp( s Z n ) class s: s 1 Z is a farmerspecific variable Howard: An Analysis of Farmer Preferences Regarding BMPs 19
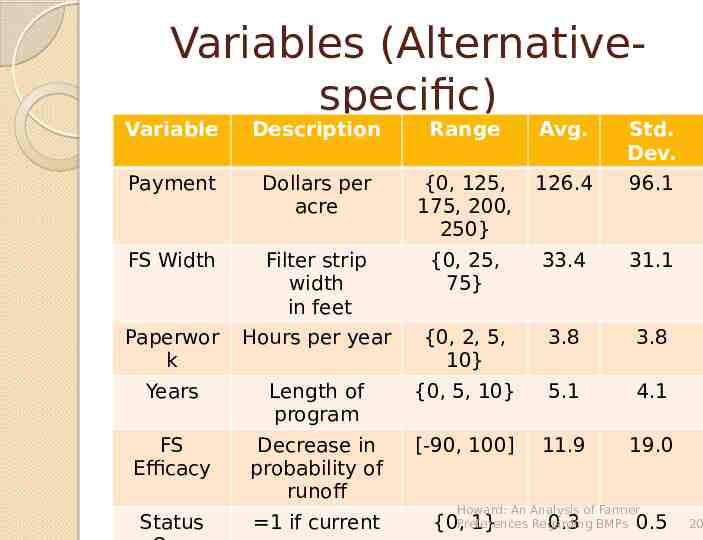
Variables (Alternativespecific) Variable Description Range Avg. Std. Dev. Payment Dollars per acre {0, 125, 175, 200, 250} 126.4 96.1 FS Width Filter strip width in feet {0, 25, 75} 33.4 31.1 Paperwor k Hours per year {0, 2, 5, 10} 3.8 3.8 Years Length of program {0, 5, 10} 5.1 4.1 FS Efficacy Decrease in probability of runoff [-90, 100] 11.9 19.0 1 if current {0, 1} Status Howard: An Analysis of Farmer Preferences Regarding BMPs 0.3 0.5 20
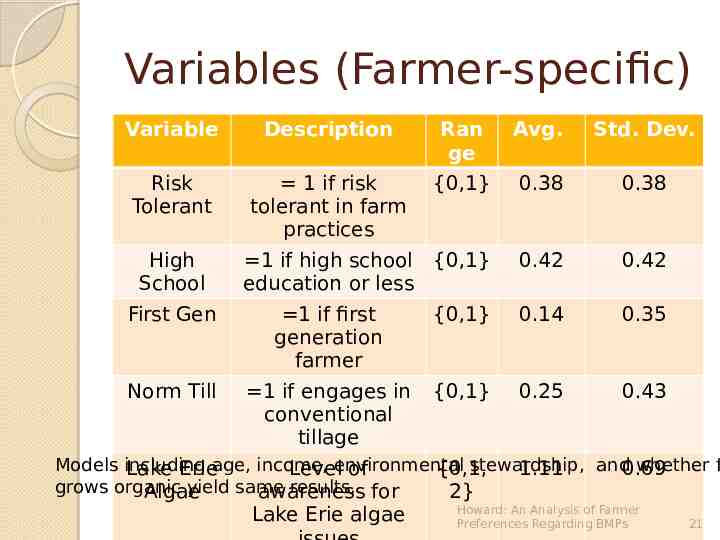
Variables (Farmer-specific) Variable Description Ran ge Avg. Std. Dev. Risk Tolerant 1 if risk tolerant in farm practices {0,1} 0.38 0.38 1 if high school {0,1} education or less 0.42 0.42 High School First Gen 1 if first generation farmer {0,1} 0.14 0.35 Norm Till 1 if engages in conventional tillage {0,1} 0.25 0.43 Models including stewardship, and0.69 whether f Lake Erieage, income, Levelenvironmental of {0,1, 1.11 grows organic yield same results. for Algae awareness 2} Lake Erie algae Howard: An Analysis of Farmer Preferences Regarding BMPs 21
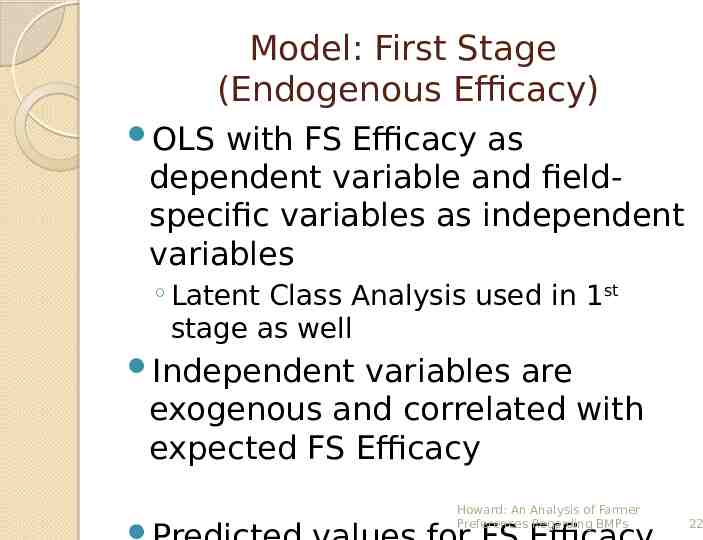
Model: First Stage (Endogenous Efficacy) OLS with FS Efficacy as dependent variable and fieldspecific variables as independent variables Latent Class Analysis used in 1st stage as well Independent variables are exogenous and correlated with expected FS Efficacy Howard: An Analysis of Farmer Preferences Regarding BMPs 22
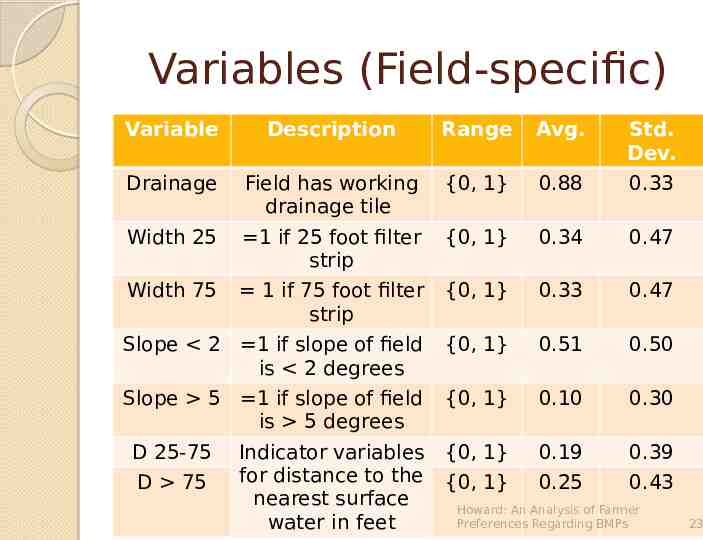
Variables (Field-specific) Variable Description Range Avg. Std. Dev. Drainage Field has working drainage tile {0, 1} 0.88 0.33 Width 25 1 if 25 foot filter strip {0, 1} 0.34 0.47 Width 75 1 if 75 foot filter strip {0, 1} 0.33 0.47 Slope 2 1 if slope of field is 2 degrees {0, 1} 0.51 0.50 Slope 5 1 if slope of field is 5 degrees {0, 1} 0.10 0.30 {0, 1} 0.19 0.39 {0, 1} 0.25 0.43 D 25-75 D 75 Indicator variables for distance to the nearest surface water in feet Howard: An Analysis of Farmer Preferences Regarding BMPs 23
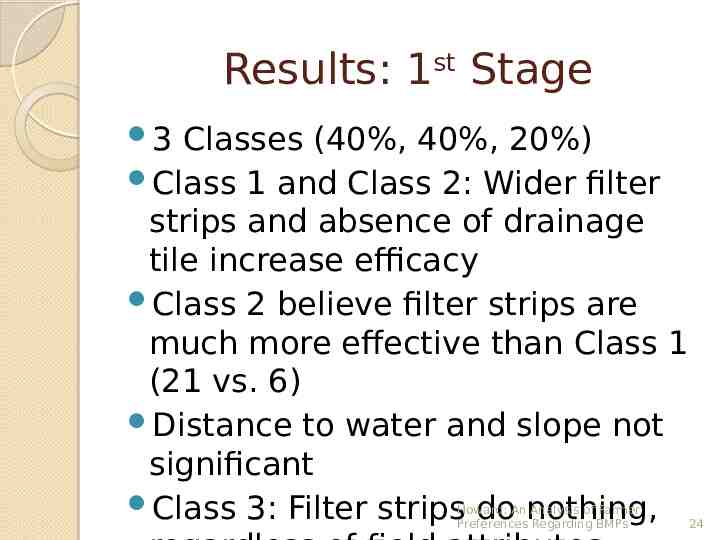
Results: 1st Stage 3 Classes (40%, 40%, 20%) Class 1 and Class 2: Wider filter strips and absence of drainage tile increase efficacy Class 2 believe filter strips are much more effective than Class 1 (21 vs. 6) Distance to water and slope not significant Class 3: Filter strips do nothing, Howard: An Analysis of Farmer Preferences Regarding BMPs 24
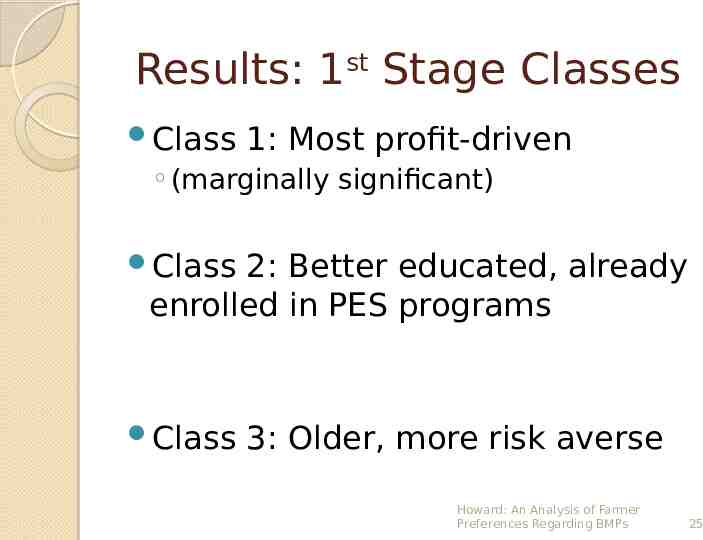
Results: 1st Stage Classes Class 1: Most profit-driven (marginally significant) Class 2: Better educated, already enrolled in PES programs Class 3: Older, more risk averse Howard: An Analysis of Farmer Preferences Regarding BMPs 25
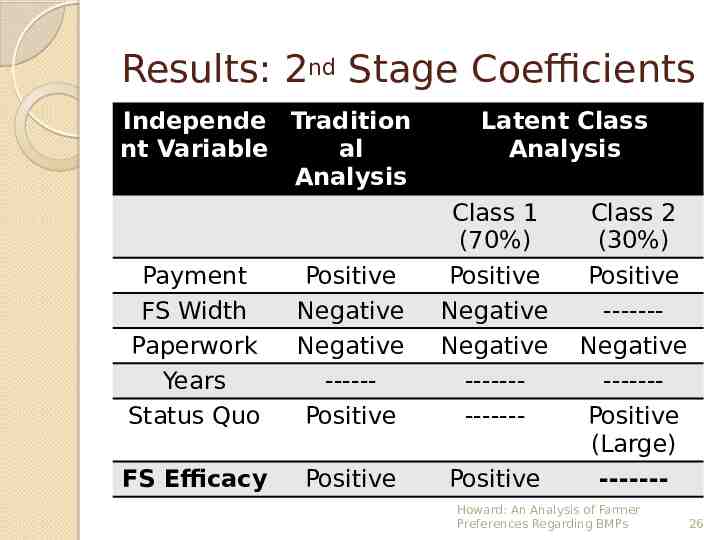
Results: 2nd Stage Coefficients Independe Tradition nt Variable al Analysis Latent Class Analysis Payment FS Width Paperwork Years Status Quo Positive Negative Negative -----Positive Class 1 (70%) Positive Negative Negative ------------- FS Efficacy Positive Positive Class 2 (30%) Positive ------Negative ------Positive (Large) ------- Howard: An Analysis of Farmer Preferences Regarding BMPs 26
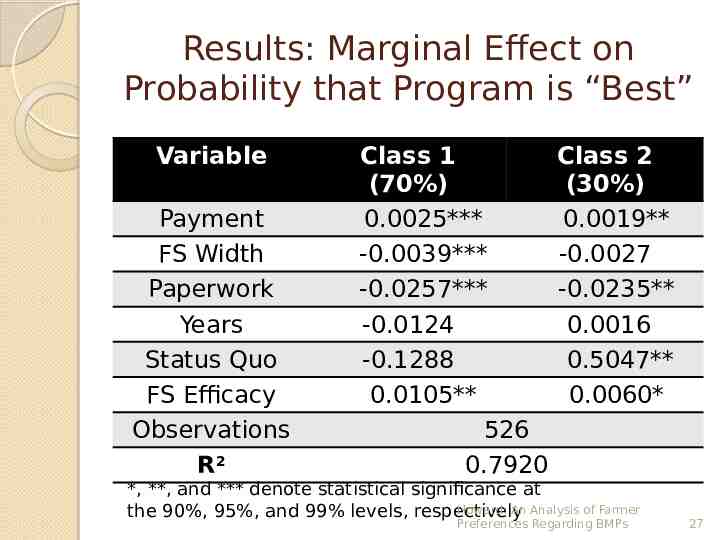
Results: Marginal Effect on Probability that Program is “Best” Variable Payment FS Width Paperwork Years Status Quo FS Efficacy Observations R2 Class 1 (70%) 0.0025*** -0.0039*** -0.0257*** -0.0124 -0.1288 0.0105** 526 0.7920 Class 2 (30%) 0.0019** -0.0027 -0.0235** 0.0016 0.5047** 0.0060* *, **, and *** denote statistical significance at Howard: An Analysis of Farmer the 90%, 95%, and 99% levels, respectively Preferences Regarding BMPs 27
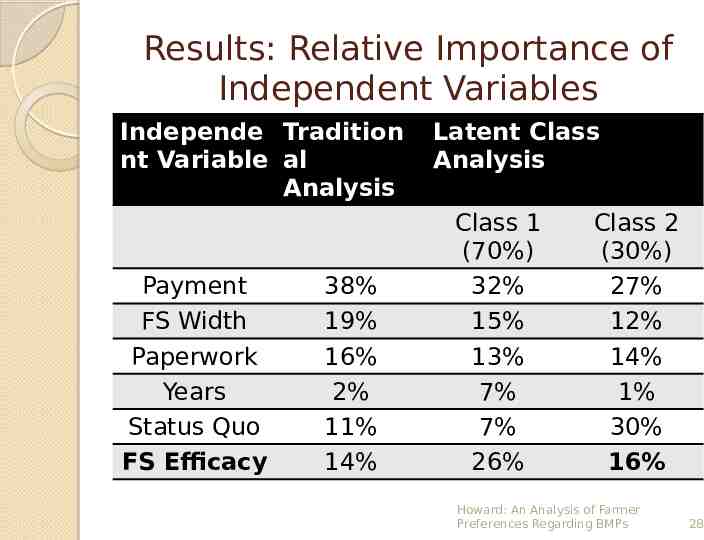
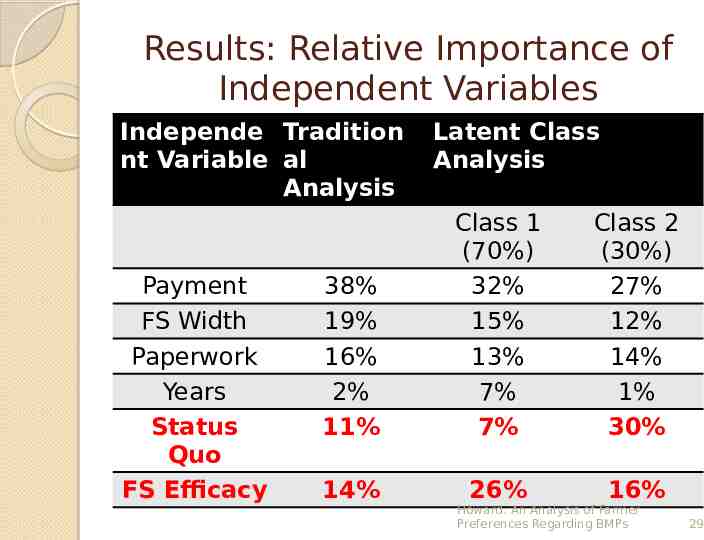
Results: Relative Importance of Independent Variables Independe Tradition nt Variable al Analysis Payment FS Width Paperwork Years Status Quo FS Efficacy 38% 19% 16% 2% 11% 14% Latent Class Analysis Class 1 (70%) 32% 15% 13% 7% 7% 26% Class 2 (30%) 27% 12% 14% 1% 30% 16% Howard: An Analysis of Farmer Preferences Regarding BMPs 28
Results: Relative Importance of Independent Variables Independe Tradition nt Variable al Analysis Payment FS Width Paperwork Years Status Quo FS Efficacy Latent Class Analysis 38% 19% 16% 2% 11% Class 1 (70%) 32% 15% 13% 7% 7% Class 2 (30%) 27% 12% 14% 1% 30% 14% 26% 16% Howard: An Analysis of Farmer Preferences Regarding BMPs 29
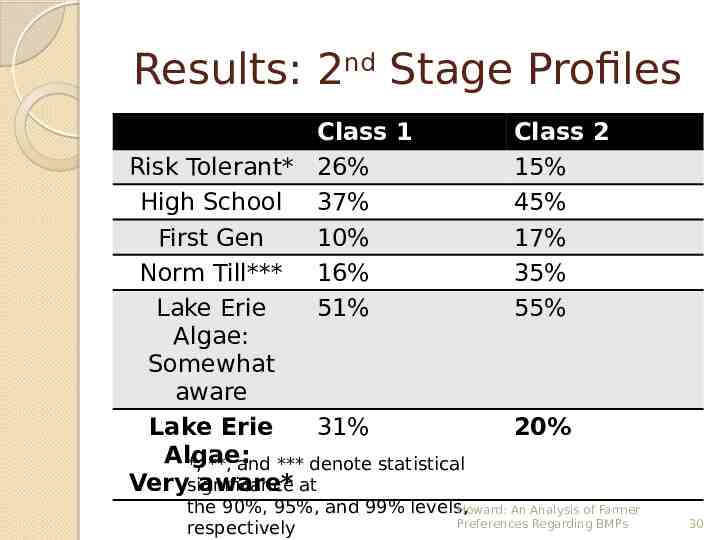
Results: 2nd Stage Profiles Class 1 Risk Tolerant* 26% High School 37% First Gen 10% Norm Till*** 16% Lake Erie 51% Algae: Somewhat aware Lake Erie 31% Algae: *, **, and *** denote statistical Verysignificance aware* at Class 2 15% 45% 17% 35% 55% 20% the 90%, 95%, and 99% levels, Howard: An Analysis of Farmer Preferences Regarding BMPs respectively 30
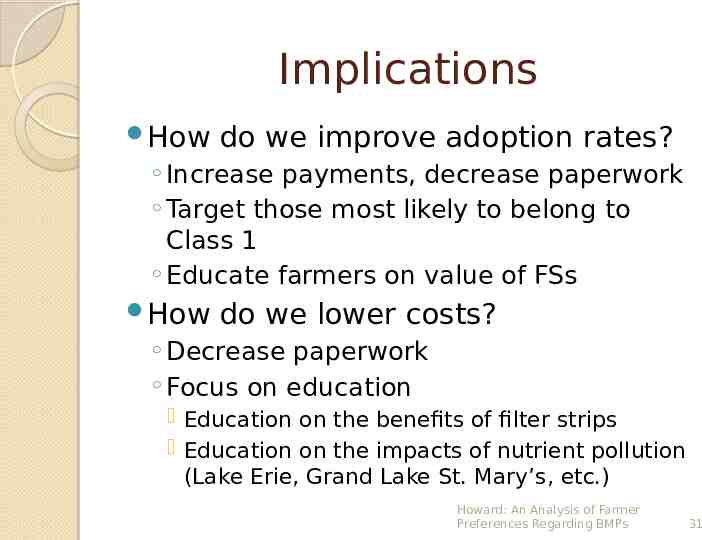
Implications How do we improve adoption rates? Increase payments, decrease paperwork Target those most likely to belong to Class 1 Educate farmers on value of FSs How do we lower costs? Decrease paperwork Focus on education Education on the benefits of filter strips Education on the impacts of nutrient pollution (Lake Erie, Grand Lake St. Mary’s, etc.) Howard: An Analysis of Farmer Preferences Regarding BMPs 31
Thank You! Support provided by NSF Coupled Human and Natural Systems Program (GRT00022685) Howard: An Analysis of Farmer Preferences Regarding BMPs 32