Aim: How to explain the energy change during heating and cooling DO
14 Slides614.57 KB
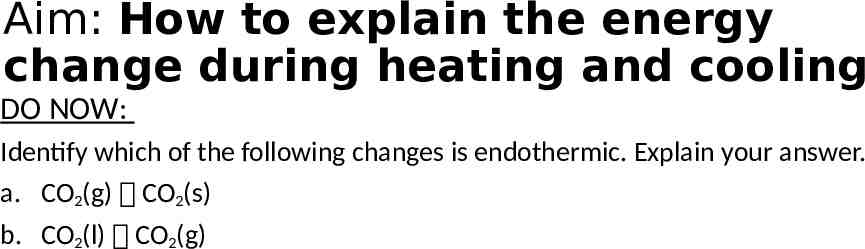
Aim: How to explain the energy change during heating and cooling DO NOW: Identify which of the following changes is endothermic. Explain your answer. a. CO2(g) CO2(s) b. CO2(l) CO2(g)
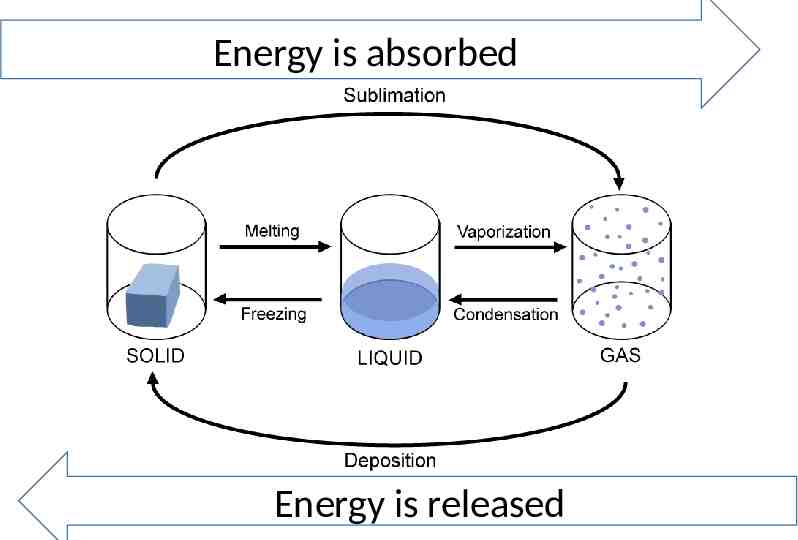
Energy is absorbed Energy is released
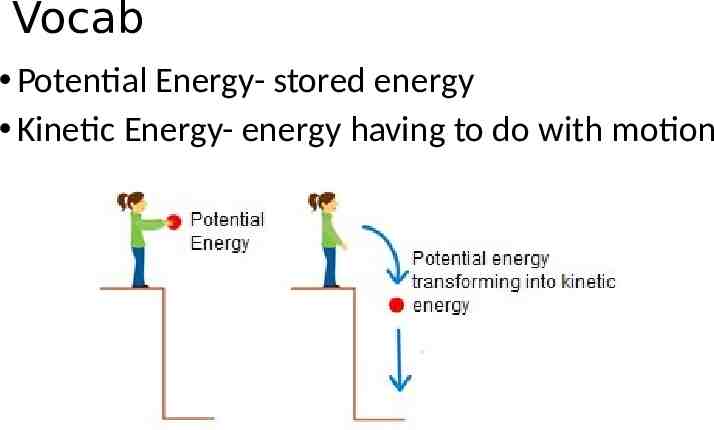
Vocab Potential Energy- stored energy Kinetic Energy- energy having to do with motion
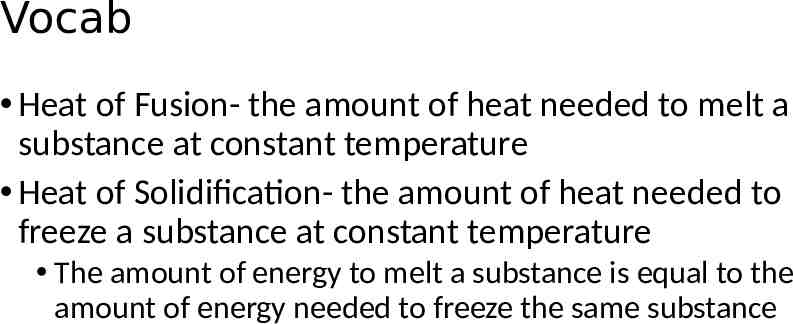
Vocab Heat of Fusion- the amount of heat needed to melt a substance at constant temperature Heat of Solidification- the amount of heat needed to freeze a substance at constant temperature The amount of energy to melt a substance is equal to the amount of energy needed to freeze the same substance
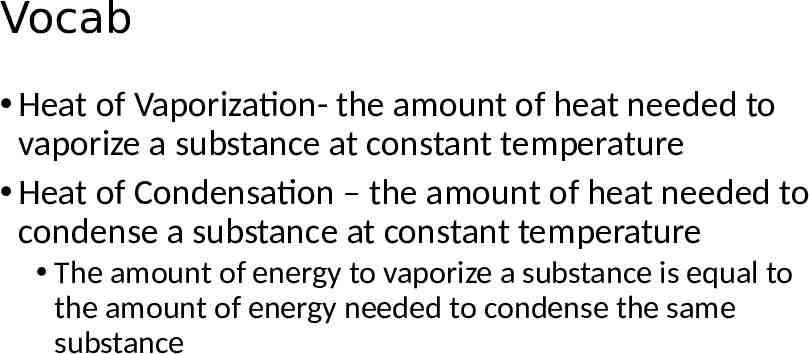
Vocab Heat of Vaporization- the amount of heat needed to vaporize a substance at constant temperature Heat of Condensation – the amount of heat needed to condense a substance at constant temperature The amount of energy to vaporize a substance is equal to the amount of energy needed to condense the same substance
Heating Curve A heating curve is a graph showing the temperature of a substance plotted against the amount of energy it has absorbed. During heating, the energy (potential or kinetic) of the substance always increases.
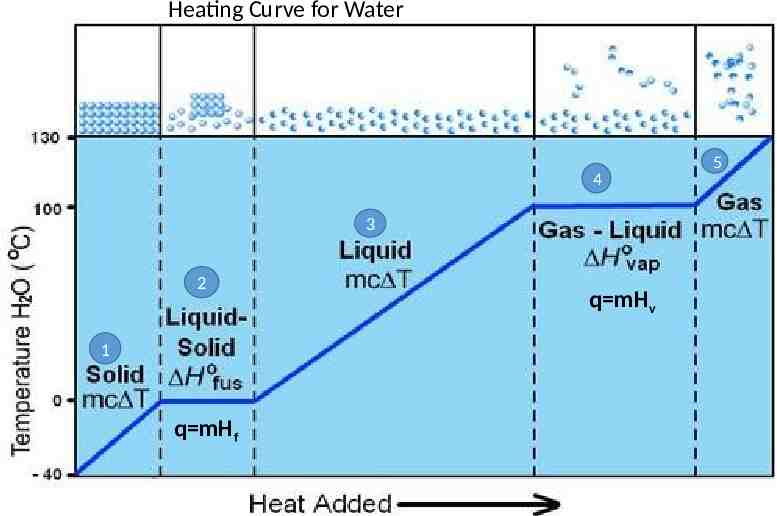
Heating Curve for Water 4 3 2 1 q mHf q mHv 5
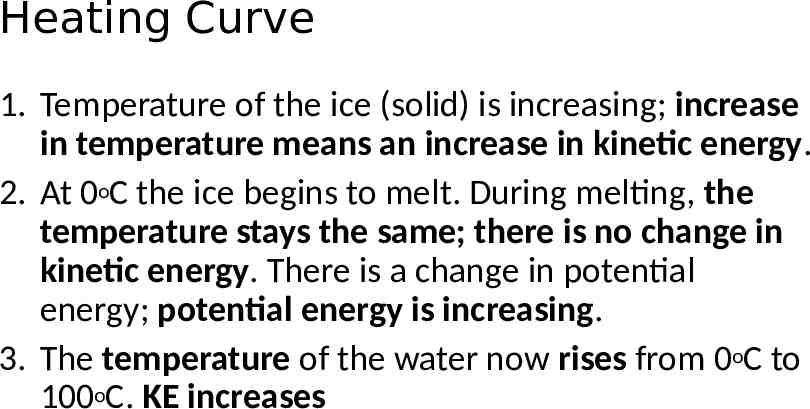
Heating Curve 1. Temperature of the ice (solid) is increasing; increase in temperature means an increase in kinetic energy. 2. At 0oC the ice begins to melt. During melting, the temperature stays the same; there is no change in kinetic energy. There is a change in potential energy; potential energy is increasing. 3. The temperature of the water now rises from 0oC to 100oC. KE increases
Heating Curve 4. At 100oC, the water boils (changes to gas). When the water boils, the temperature stays the same; no change in kinetic energy. There is a change in potential energy; potential energy increases. 5. After all the water boils, the temperature of the gas rises. KE Increases
Cooling Curve A cooling curve is obtained when a substance cools down and changes state During cooling, the energy (potential or kinetic) of the substance always decreases. The cooling curve is the reverse of the heating curve.
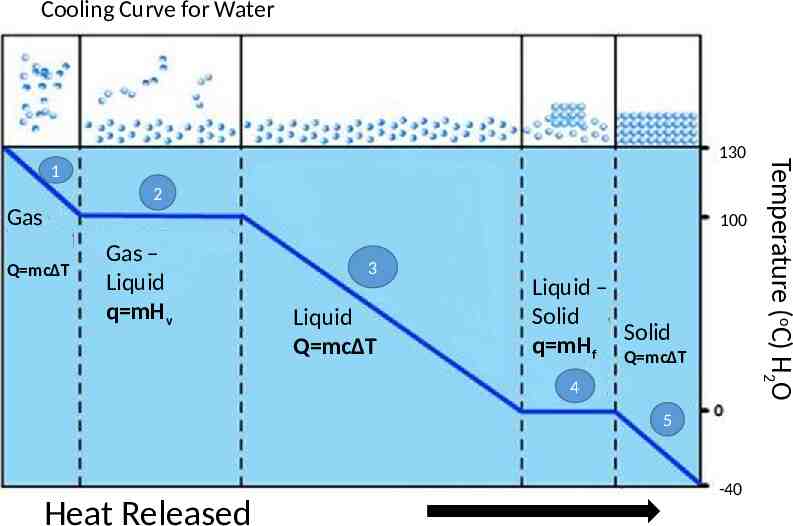
Cooling Curve for Water 1 2 Gas 100 Q mcΔT Gas – Liquid q mHv 3 Liquid Q mcΔT Liquid – Solid Solid q mHf Q mcΔT 4 5 Heat Released -40 Temperature (oC) H2O 130
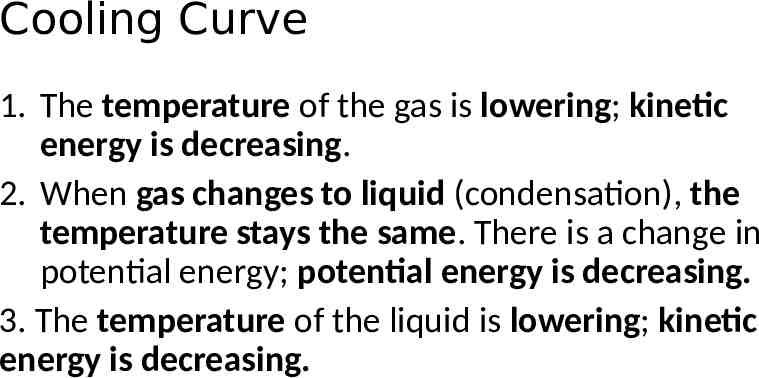
Cooling Curve 1. The temperature of the gas is lowering; kinetic energy is decreasing. 2. When gas changes to liquid (condensation), the temperature stays the same. There is a change in potential energy; potential energy is decreasing. 3. The temperature of the liquid is lowering; kinetic energy is decreasing.
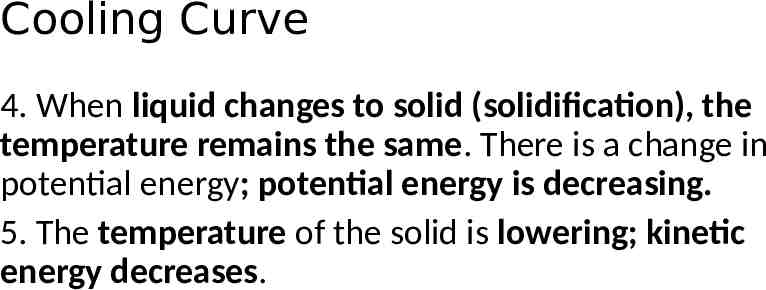
Cooling Curve 4. When liquid changes to solid (solidification), the temperature remains the same. There is a change in potential energy; potential energy is decreasing. 5. The temperature of the solid is lowering; kinetic energy decreases.
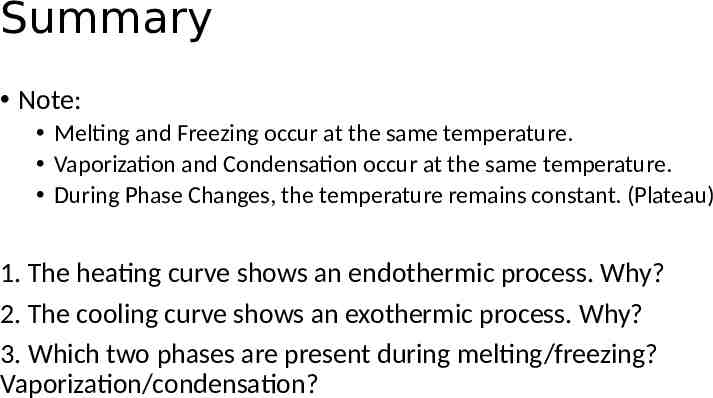
Summary Note: Melting and Freezing occur at the same temperature. Vaporization and Condensation occur at the same temperature. During Phase Changes, the temperature remains constant. (Plateau) 1. The heating curve shows an endothermic process. Why? 2. The cooling curve shows an exothermic process. Why? 3. Which two phases are present during melting/freezing? Vaporization/condensation?