Bronx Community Health Dashboard: Maternal and Child Health Last

45 Slides3.30 MB
Bronx Community Health Dashboard: Maternal and Child Health Last Updated: 1/31/2018 See last slide for more information about this project. 1
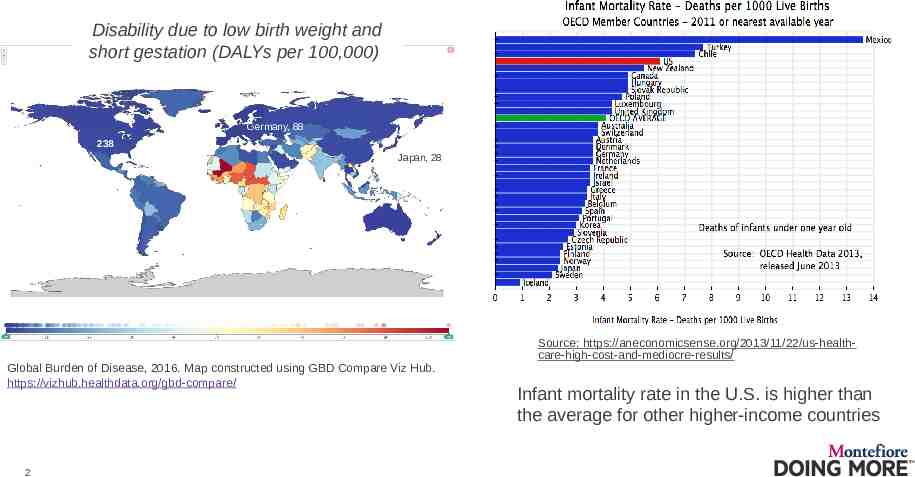
Disability due to low birth weight and short gestation (DALYs per 100,000) Germany, 88 238 Japan, 28 Global Burden of Disease, 2016. Map constructed using GBD Compare Viz Hub. https://vizhub.healthdata.org/gbd-compare/ 2 Source: https://aneconomicsense.org/2013/11/22/us-healthcare-high-cost-and-mediocre-results/ Infant mortality rate in the U.S. is higher than the average for other higher-income countries
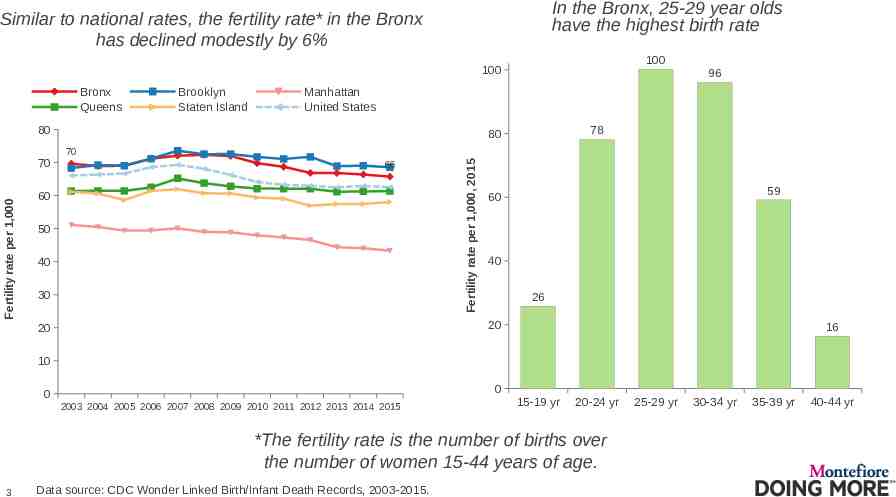
In the Bronx, 25-29 year olds have the highest birth rate Similar to national rates, the fertility rate* in the Bronx has declined modestly by 6% 100 100 Bronx Queens Brooklyn Staten Island Manhattan United States 80 78 80 70 66 60 50 40 30 Fertility rate per 1,000, 2015 Fertility rate per 1,000 70 96 59 60 40 26 20 20 16 10 0 0 2003 2004 2005 2006 2007 2008 2009 2010 2011 2012 2013 2014 2015 15-19 yr 20-24 yr *The fertility rate is the number of births over the number of women 15-44 years of age. 3 Data source: CDC Wonder Linked Birth/Infant Death Records, 2003-2015. 25-29 yr 30-34 yr 35-39 yr 40-44 yr
Teen (age 15-19y) birth rate 4
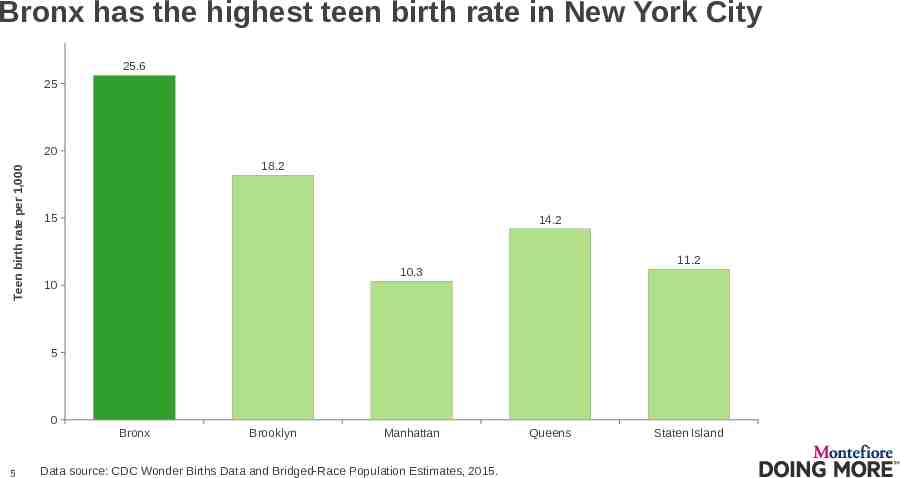
Bronx has the highest teen birth rate in New York City 25.6 25 Teen birth rate per 1,000 20 18.2 15 14.2 11.2 10.3 10 5 0 Bronx 5 Brooklyn Manhattan Data source: CDC Wonder Births Data and Bridged-Race Population Estimates, 2015. Queens Staten Island
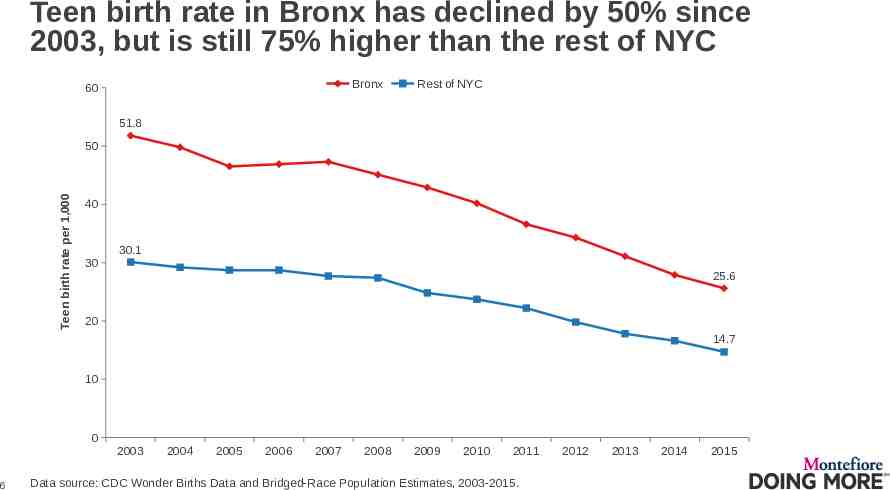
Teen birth rate in Bronx has declined by 50% since 2003, but is still 75% higher than the rest of NYC Bronx 60 Rest of NYC 51.8 Teen birth rate per 1,000 50 40 30 30.1 25.6 20 14.7 10 0 2003 6 2004 2005 2006 2007 2008 2009 2010 2011 Data source: CDC Wonder Births Data and Bridged-Race Population Estimates, 2003-2015. 2012 2013 2014 2015
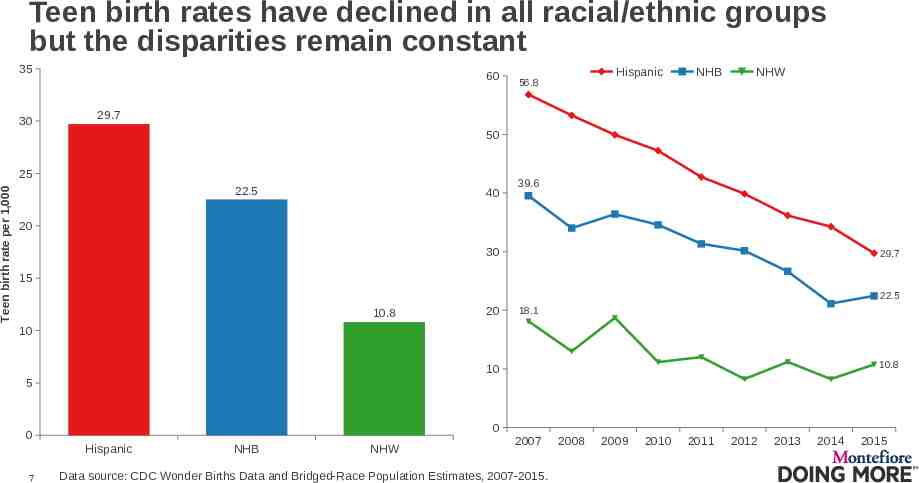
Teen birth rates have declined in all racial/ethnic groups but the disparities remain constant 35 30 60 NHB NHW 29.7 50 25 Teen birth rate per 1,000 Hispanic 56.8 22.5 40 39.6 20 30 29.7 15 22.5 10.8 20 18.1 10 10.8 10 5 0 0 Hispanic 7 NHB NHW 2007 Data source: CDC Wonder Births Data and Bridged-Race Population Estimates, 2007-2015. 2008 2009 2010 2011 2012 2013 2014 2015
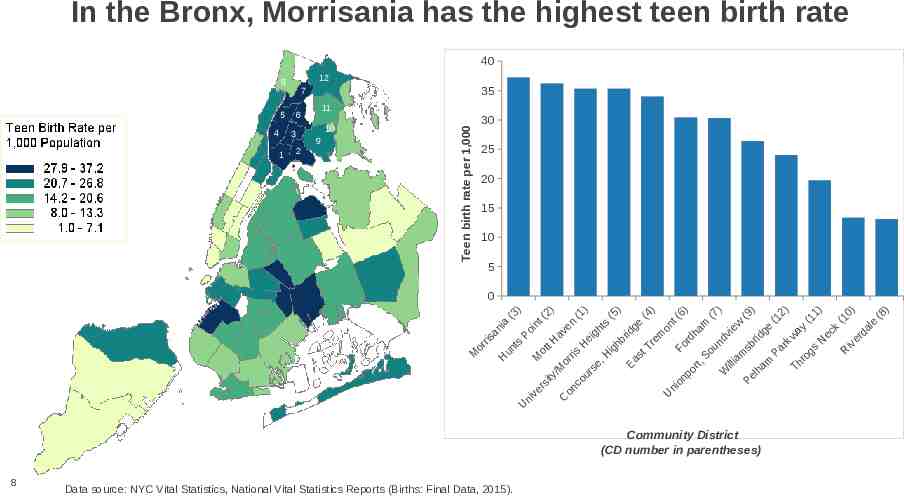
In the Bronx, Morrisania has the highest teen birth rate 40 12 8 2 9 Teen birth rate per 1,000 10 3 1 11 6 5 4 35 7 30 25 20 15 10 5 0 ) ) ) ) ) ) ) 6) 1) 0) 2) 2) (3 (1 (7 (9 (8 (5 (4 t( t( (1 (1 (1 n a e s e i w l n n m t i e e k g a e o h ay an ha vi ig av m rd rid dg ec Po i w d d e e r e b r H rr is k N r n h ts H t iv o ar sb Fo ig tT R s ou ot gs un i P M m s r H o S M H a r , or Ea illi rt, am Th se M o h / r l W u ty np Pe si co io r n n o ve U C ni U Community District (CD number in parentheses) 8 Data source: NYC Vital Statistics, National Vital Statistics Reports (Births: Final Data, 2015).
Timely initiation of prenatal care Defined as starting prenatal care in 1st, 2nd or 3rd month of pregnancy 9
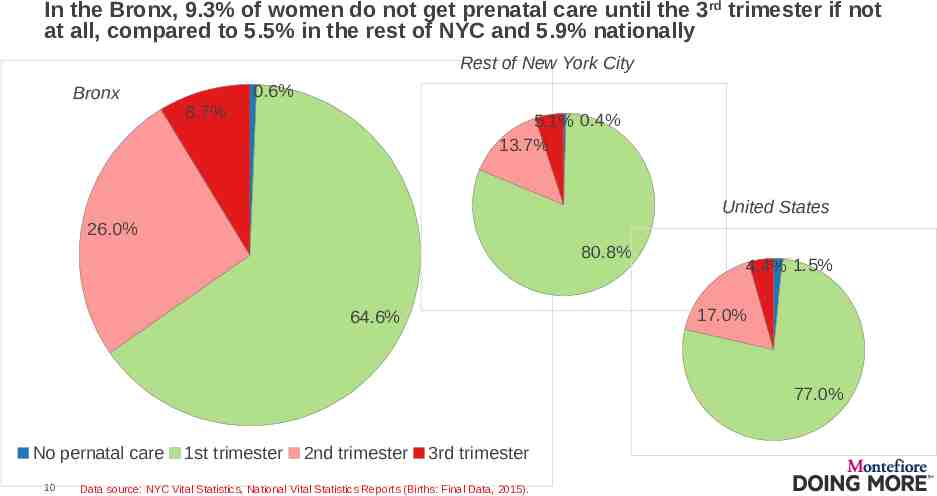
In the Bronx, 9.3% of women do not get prenatal care until the 3rd trimester if not at all, compared to 5.5% in the rest of NYC and 5.9% nationally Rest of New York City Bronx 0.6% 8.7% 5.1% 0.4% 13.7% United States 26.0% 80.8% 4.4% 1.5% 17.0% 64.6% 77.0% No pernatal care 10 1st trimester 2nd trimester 3rd trimester Data source: NYC Vital Statistics, National Vital Statistics Reports (Births: Final Data, 2015).
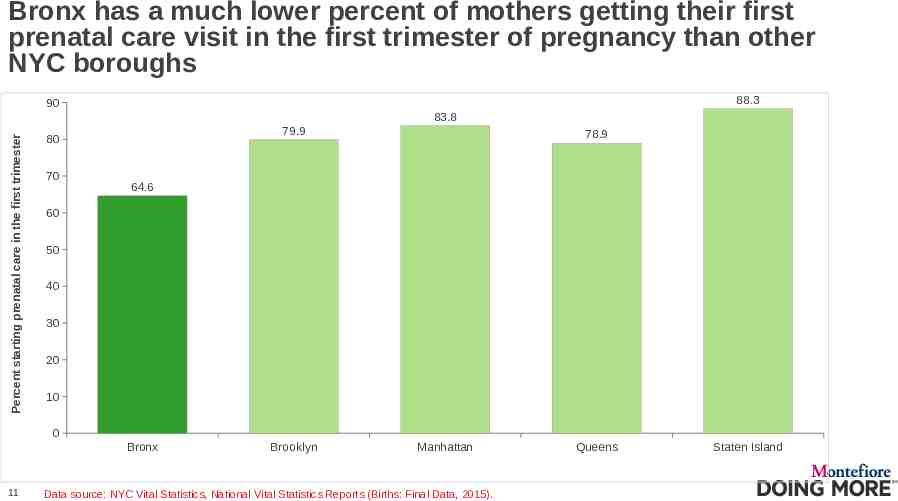
Bronx has a much lower percent of mothers getting their first prenatal care visit in the first trimester of pregnancy than other NYC boroughs 88.3 90 Percent starting prenatal care in the first trimester 83.8 79.9 80 70 78.9 64.6 60 50 40 30 20 10 0 Bronx 11 Brooklyn Manhattan Data source: NYC Vital Statistics, National Vital Statistics Reports (Births: Final Data, 2015). Queens Staten Island
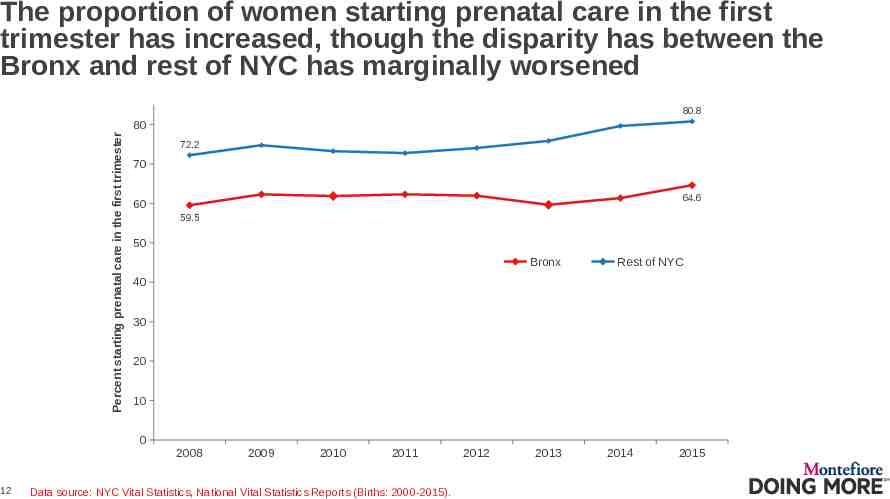
The proportion of women starting prenatal care in the first trimester has increased, though the disparity has between the Bronx and rest of NYC has marginally worsened 80.8 Percent starting prenatal care in the first trimester 80 72.2 70 64.6 60 59.5 50 Bronx Rest of NYC 40 30 20 10 0 2008 12 2009 2010 2011 Data source: NYC Vital Statistics, National Vital Statistics Reports (Births: 2000-2015). 2012 2013 2014 2015
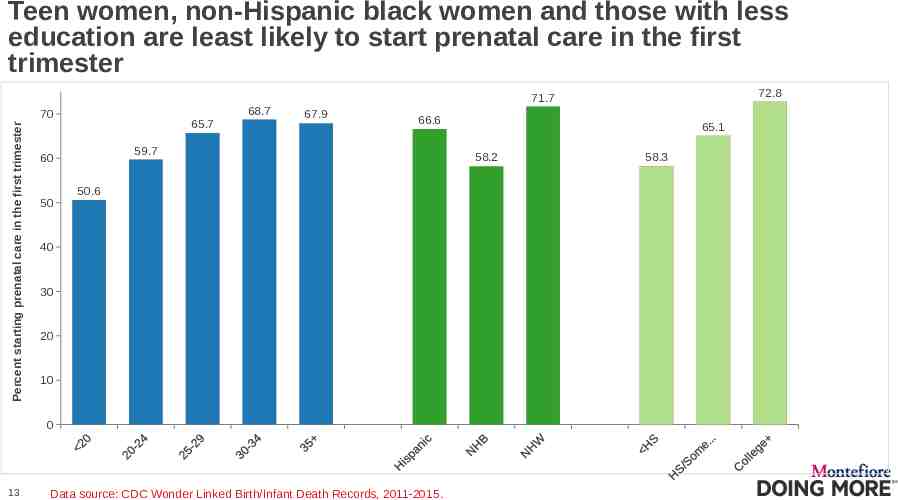
Teen women, non-Hispanic black women and those with less education are least likely to start prenatal care in the first trimester 72.8 71.7 68.7 Percent starting prenatal care in the first trimester 70 65.7 66.6 59.7 60 50 67.9 50.6 40 30 20 10 0 13 Data source: CDC Wonder Linked Birth/Infant Death Records, 2011-2015. 65.1 58.2 58.3
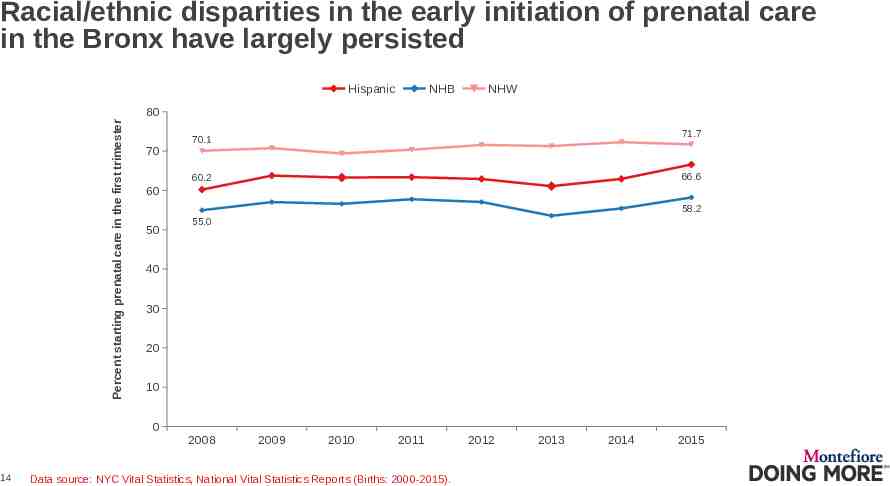
Racial/ethnic disparities in the early initiation of prenatal care in the Bronx have largely persisted Hispanic NHB NHW Percent starting prenatal care in the first trimester 80 70 71.7 70.1 66.6 60.2 60 58.2 50 55.0 40 30 20 10 0 2008 14 2009 2010 2011 Data source: NYC Vital Statistics, National Vital Statistics Reports (Births: 2000-2015). 2012 2013 2014 2015
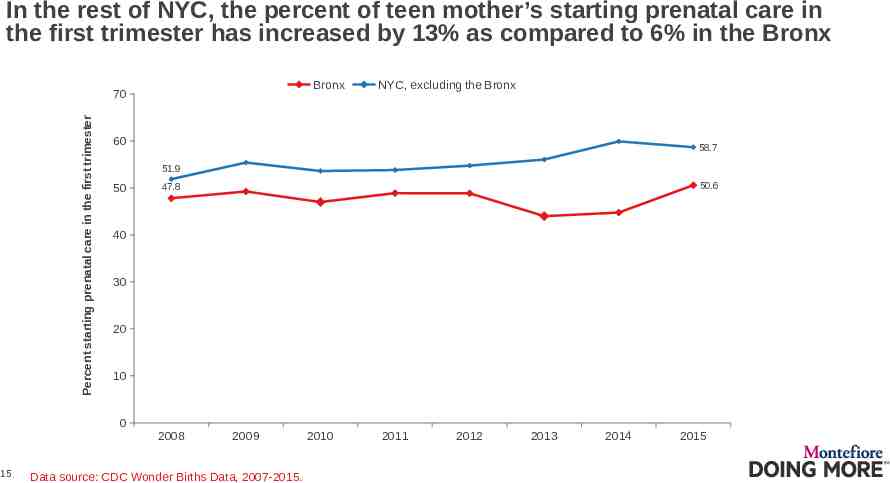
In the rest of NYC, the percent of teen mother’s starting prenatal care in the first trimester has increased by 13% as compared to 6% in the Bronx Bronx Percent starting prenatal care in the first trimester 70 NYC, excluding the Bronx 60 58.7 51.9 50 50.6 47.8 40 30 20 10 0 2008 15 2009 Data source: CDC Wonder Births Data, 2007-2015. 2010 2011 2012 2013 2014 2015
Low birth weight Defined as 2,500 grams Data are limited to single births because there is evidence that multiple births are more likely to result in low birth weight. Source: Ventura SJ, Martin JA, Curtin SC, Mathews TJ. Report of final natality statistics, 1996. Hyattsville, Maryland: US Department for Health and Human Services, CDC, National Center for Health Statistics. Monthly vital statistics reports (vol 46, no. 11). 16
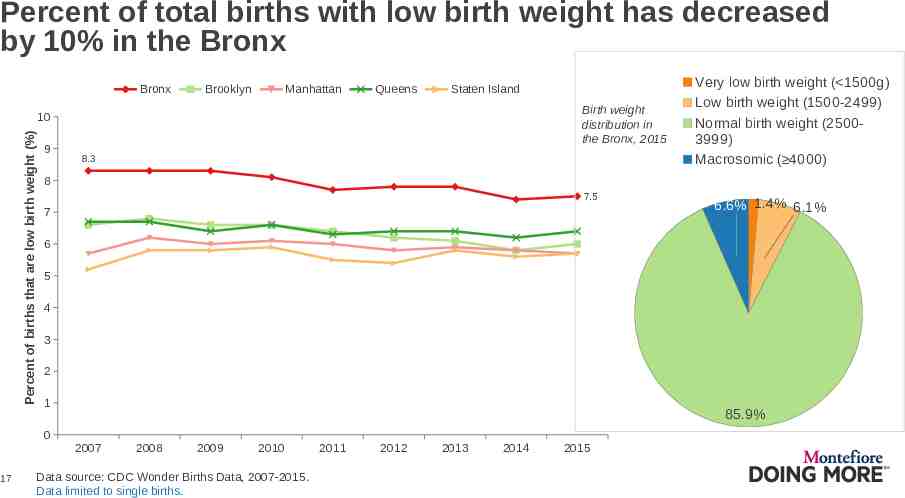
Percent of total births with low birth weight has decreased by 10% in the Bronx Bronx Brooklyn Manhattan Queens Staten Island Birth weight distribution in the Bronx, 2015 Percent of births that are low birth weight (%) 10 9 8.3 8 7.5 7 6.6% 1.4% 6.1% 6 5 4 3 2 1 85.9% 0 2007 17 Very low birth weight ( 1500g) Low birth weight (1500-2499) Normal birth weight (25003999) Macrosomic ( 4000) 2008 2009 2010 Data source: CDC Wonder Births Data, 2007-2015. Data limited to single births. 2011 2012 2013 2014 2015
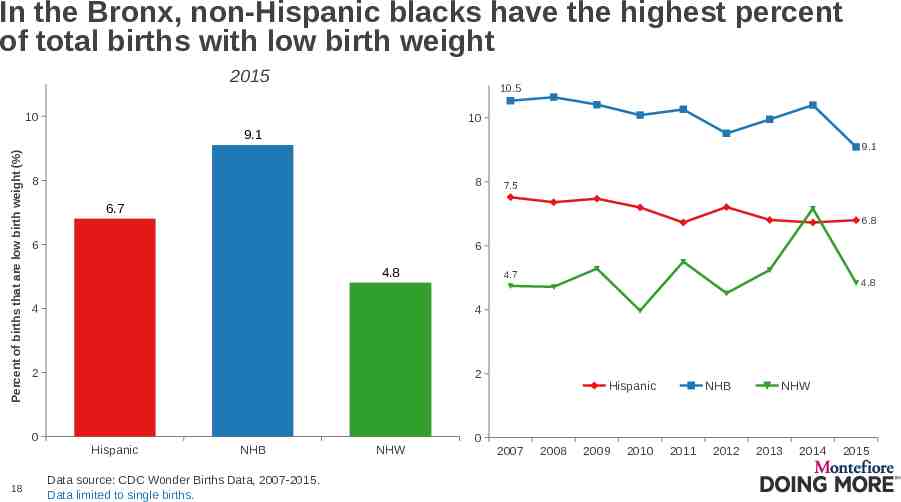
In the Bronx, non-Hispanic blacks have the highest percent of total births with low birth weight 2015 10.5 10 10 Percent of births that are low birth weight (%) 9.1 9.1 8 8 6.7 6.8 6 6 4.8 4.7 4 4 2 2 0 Hispanic 18 7.5 NHB Data source: CDC Wonder Births Data, 2007-2015. Data limited to single births. NHW 4.8 Hispanic NHB NHW 0 2007 2008 2009 2010 2011 2012 2013 2014 2015
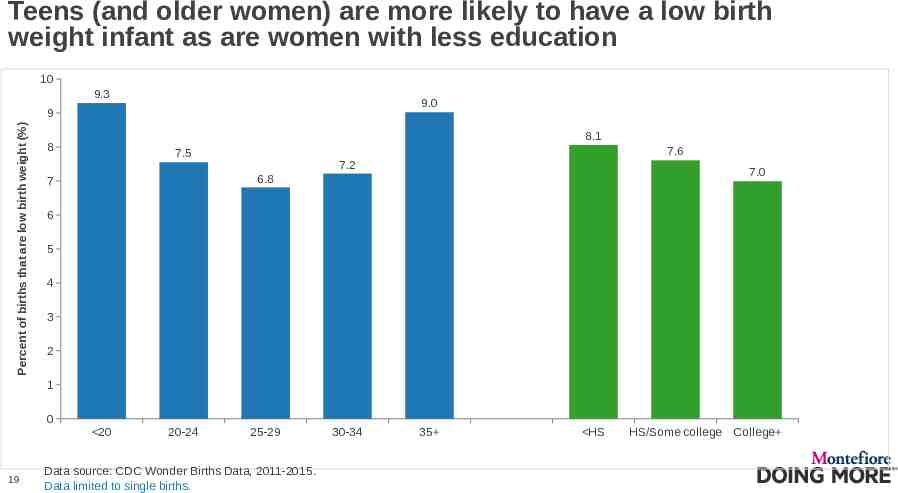
Teens (and older women) are more likely to have a low birth weight infant as are women with less education 10 9.3 9.0 Percent of births that are low birth weight (%) 9 8.1 8 7.5 7.6 7.2 7.0 6.8 7 6 5 4 3 2 1 0 20 19 20-24 25-29 Data source: CDC Wonder Births Data, 2011-2015. Data limited to single births. 30-34 35 HS HS/Some college College
Preterm delivery Defined as 37 weeks Data are limited to single births because there is evidence that multiple pregnancies greatly increase the risk for preterm delivery. Source: 20 Kurdi AM, Mesleh, RA, Al-Hakeem MM, et al. Multiple pregnancy and preterm labor. Saudi Med J 2004;25:632-7.
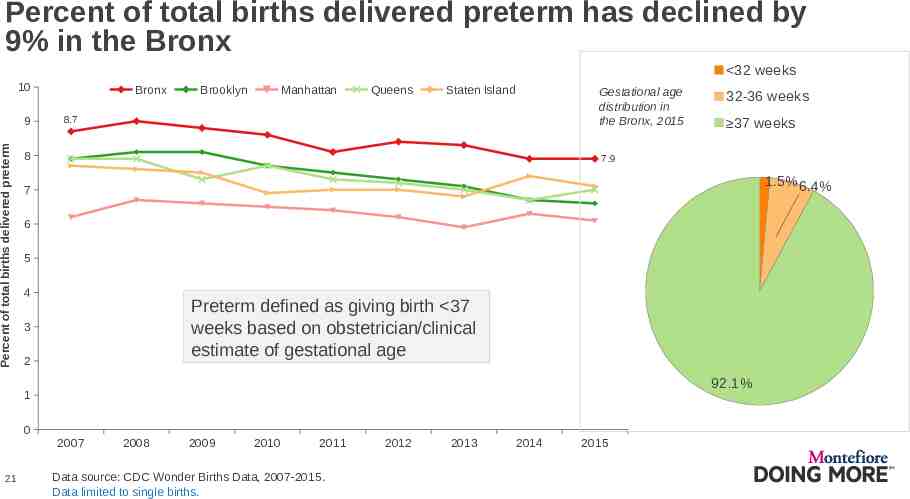
Percent of total births delivered preterm has declined by 9% in the Bronx 32 weeks 10 Percent of total births delivered preterm 9 Bronx Brooklyn Manhattan Queens Staten Island Gestational age distribution in the Bronx, 2015 8.7 8 37 weeks 7.9 1.5% 6.4% 7 6 5 4 Preterm defined as giving birth 37 weeks based on obstetrician/clinical estimate of gestational age 3 2 92.1% 1 0 2007 21 32-36 weeks 2008 2009 2010 2011 Data source: CDC Wonder Births Data, 2007-2015. Data limited to single births. 2012 2013 2014 2015
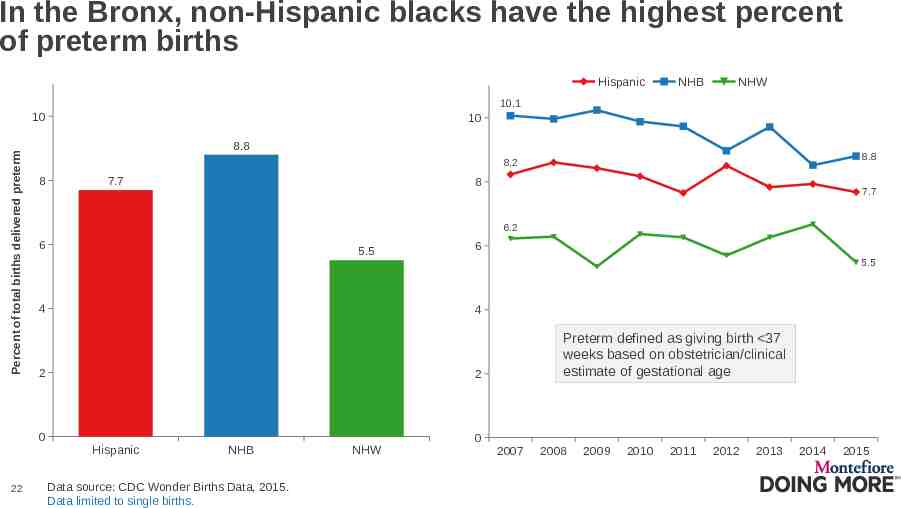
In the Bronx, non-Hispanic blacks have the highest percent of preterm births Hispanic NHB NHW 10.1 Percent of total births delivered preterm 10 10 8.8 8 7.7 8 7.7 6.2 6 5.5 4 6 5.5 4 2 Preterm defined as giving birth 37 weeks based on obstetrician/clinical estimate of gestational age 2 0 Hispanic 22 8.8 8.2 NHB Data source: CDC Wonder Births Data, 2015. Data limited to single births. NHW 0 2007 2008 2009 2010 2011 2012 2013 2014 2015
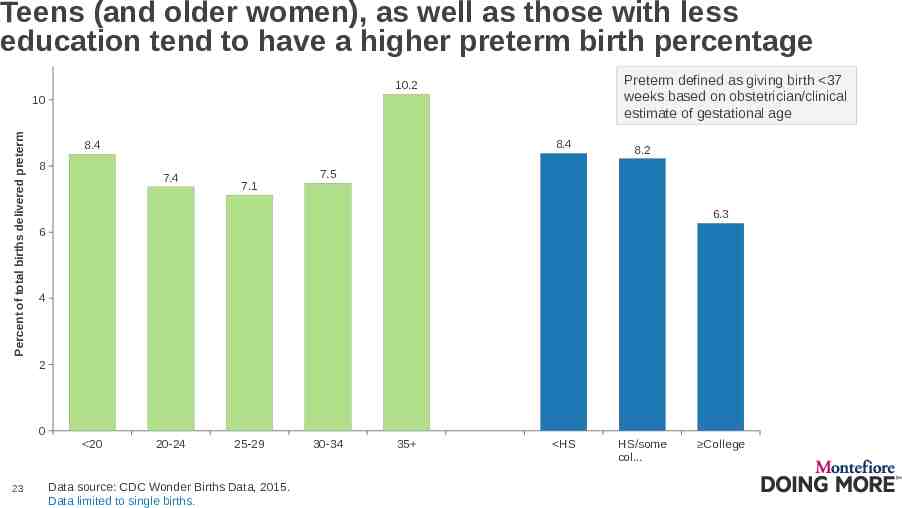
Teens (and older women), as well as those with less education tend to have a higher preterm birth percentage Preterm defined as giving birth 37 weeks based on obstetrician/clinical estimate of gestational age 10.2 Percent of total births delivered preterm 10 8.4 8.4 8 7.4 7.1 8.2 7.5 6.3 6 4 2 0 20 23 20-24 25-29 Data source: CDC Wonder Births Data, 2015. Data limited to single births. 30-34 35 HS HS/some col. College
Infant mortality rate 24
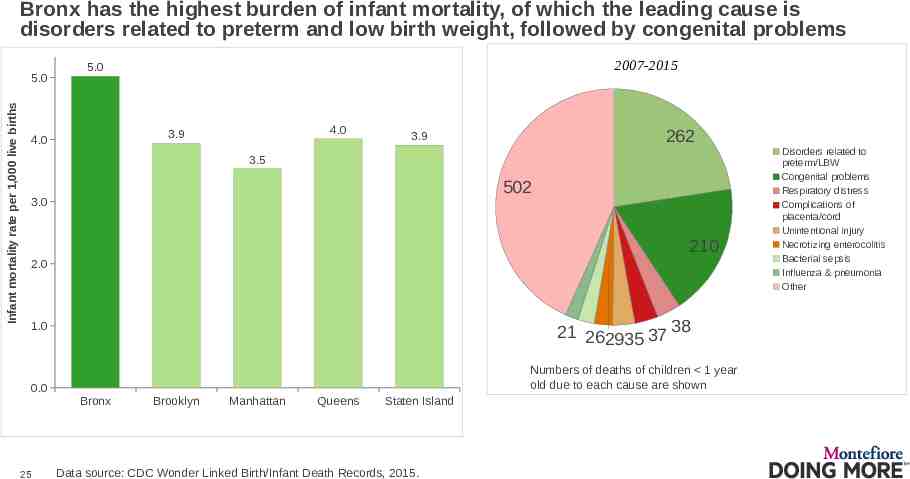
Bronx has the highest burden of infant mortality, of which the leading cause is disorders related to preterm and low birth weight, followed by congenital problems Infant mortality rate per 1,000 live births 5.0 2007-2015 5.0 4.0 3.9 4.0 262 3.9 3.5 502 3.0 210 2.0 21 262935 37 38 1.0 Numbers of deaths of children 1 year old due to each cause are shown 0.0 Bronx 25 Brooklyn Manhattan Queens Staten Island Data source: CDC Wonder Linked Birth/Infant Death Records, 2015. Disorders related to preterm/LBW Congenital problems Respiratory distress Complications of placenta/cord Unintentional injury Necrotizing enterocolitis Bacterial sepsis Influenza & pneumonia Other
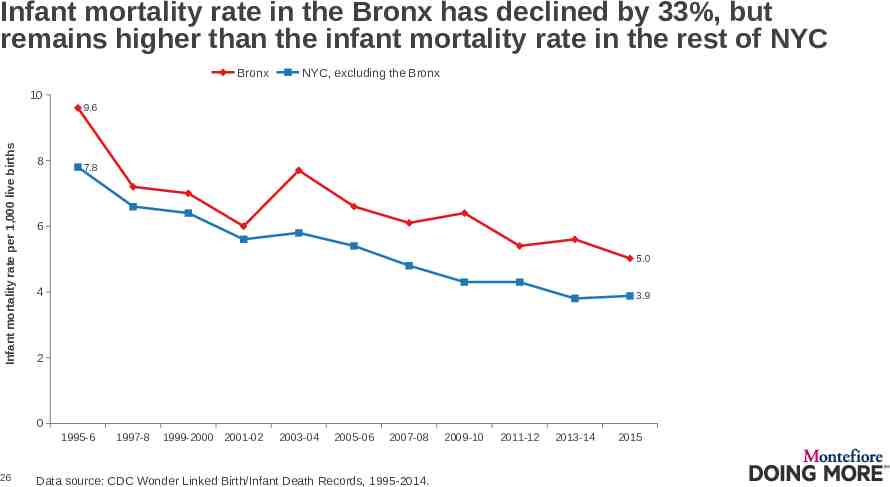
Infant mortality rate in the Bronx has declined by 33%, but remains higher than the infant mortality rate in the rest of NYC Bronx NYC, excluding the Bronx 10 Infant mortality rate per 1,000 live births 9.6 8 7.8 6 5.0 4 3.9 2 0 1995-6 26 1997-8 1999-2000 2001-02 2003-04 2005-06 2007-08 Data source: CDC Wonder Linked Birth/Infant Death Records, 1995-2014. 2009-10 2011-12 2013-14 2015
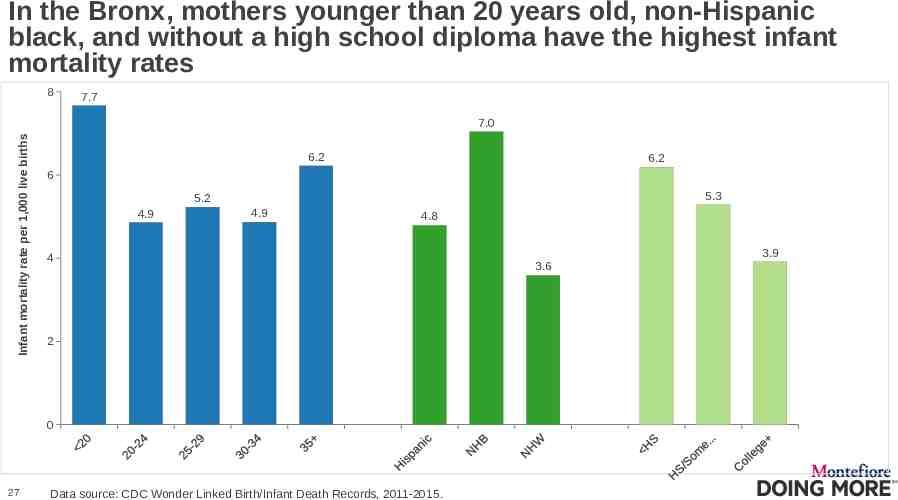
In the Bronx, mothers younger than 20 years old, non-Hispanic black, and without a high school diploma have the highest infant mortality rates 8 7.7 Infant mortality rate per 1,000 live births 7.0 6.2 6.2 6 5.3 5.2 4.9 4.9 4.8 4 2 0 27 Data source: CDC Wonder Linked Birth/Infant Death Records, 2011-2015. 3.9 3.6
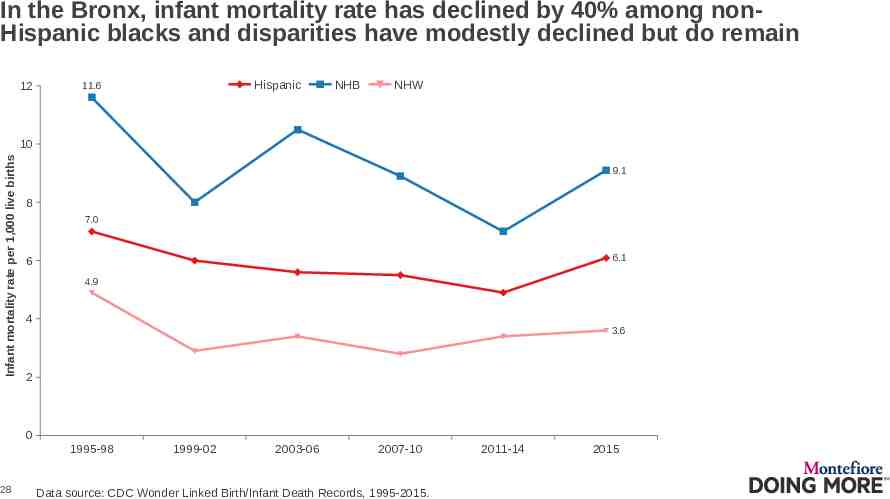
In the Bronx, infant mortality rate has declined by 40% among nonHispanic blacks and disparities have modestly declined but do remain 12 Hispanic 11.6 NHB NHW Infant mortality rate per 1,000 live births 10 9.1 8 7.0 6.1 6 4.9 4 3.6 2 0 1995-98 28 1999-02 2003-06 2007-10 Data source: CDC Wonder Linked Birth/Infant Death Records, 1995-2015. 2011-14 2015
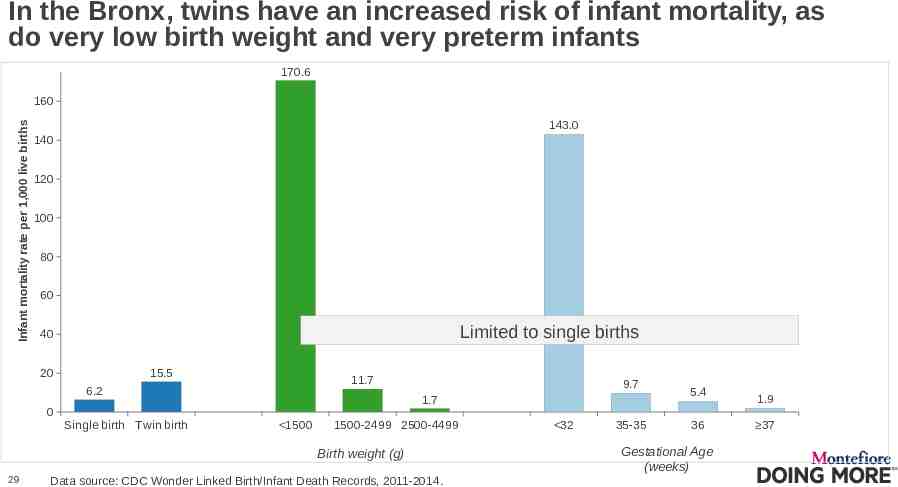
In the Bronx, twins have an increased risk of infant mortality, as do very low birth weight and very preterm infants 170.6 Infant mortality rate per 1,000 live births 160 143.0 140 120 100 80 60 Limited to single births 40 15.5 20 11.7 6.2 0 Single birth Twin birth 9.7 1.7 1500 1500-2499 2500-4499 Birth weight (g) 29 Data source: CDC Wonder Linked Birth/Infant Death Records, 2011-2014. 32 35-35 5.4 36 Gestational Age (weeks) 1.9 37
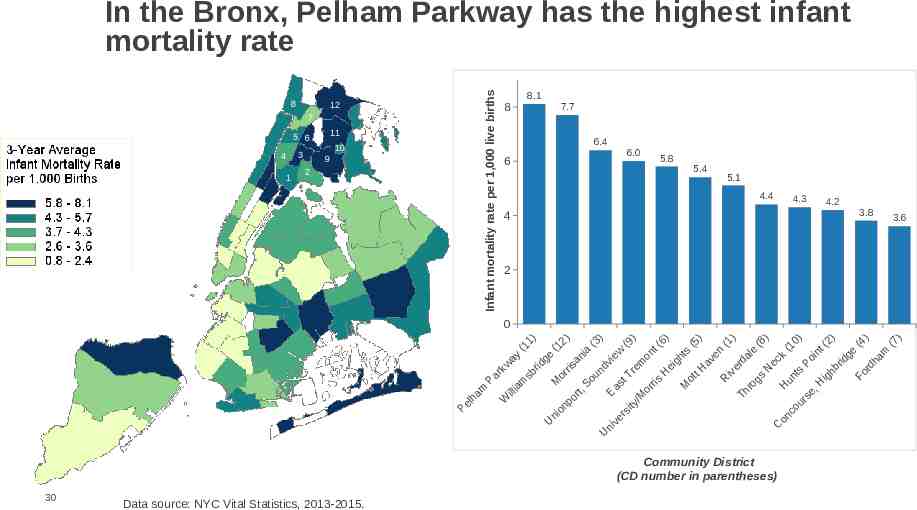
8 12 7 11 5 6 4 1 10 3 9 2 Infant mortality rate per 1,000 live births In the Bronx, Pelham Parkway has the highest infant mortality rate 8 8.1 7.7 6.4 6 6.0 5.8 5.4 5.1 4.4 4 4.3 4.2 3.8 3.6 2 0 ) ) ) ) ) ) ) ) ) ) (3 (6 (1 (2 (9 (8 (7 (5 (4 10 t ( t n a e s e i l n m e e k g a ew on ht oi ay an ha vi ig m av rd ec dg rid P s w i d i d e e e r b r H r N s rk h H iv Tr un tt s sb or nt Fo ig t R s o o g u i Pa M m s r H o S M r H a r a , i o t, e E ill am Th or /M rs lh W p y u e it o P on rs nc ni e o U v C ni U 1) (1 2) (1 Community District (CD number in parentheses) 30 Data source: NYC Vital Statistics, 2013-2015.
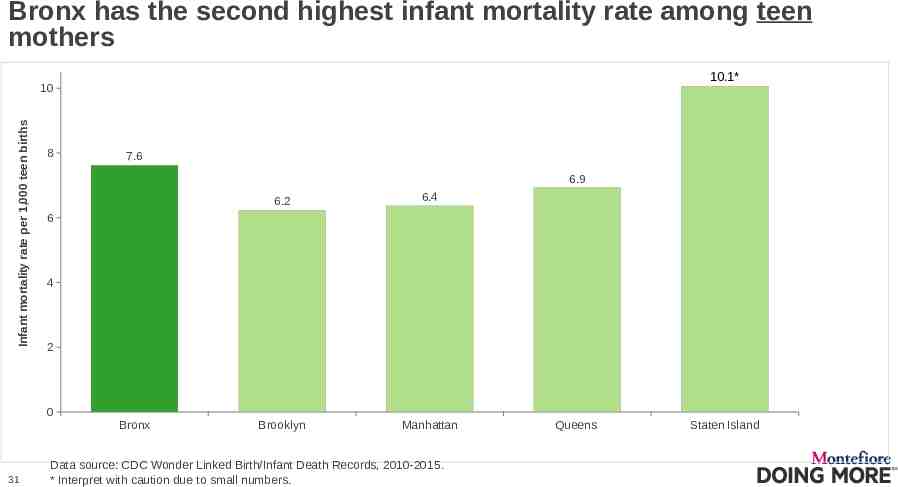
Bronx has the second highest infant mortality rate among teen mothers 10.1* Infant mortality rate per 1,000 teen births 10 8 6.9 6.2 6.4 Brooklyn Manhattan 6 4 2 0 31 7.6 Bronx Data source: CDC Wonder Linked Birth/Infant Death Records, 2010-2015. * Interpret with caution due to small numbers. Queens Staten Island
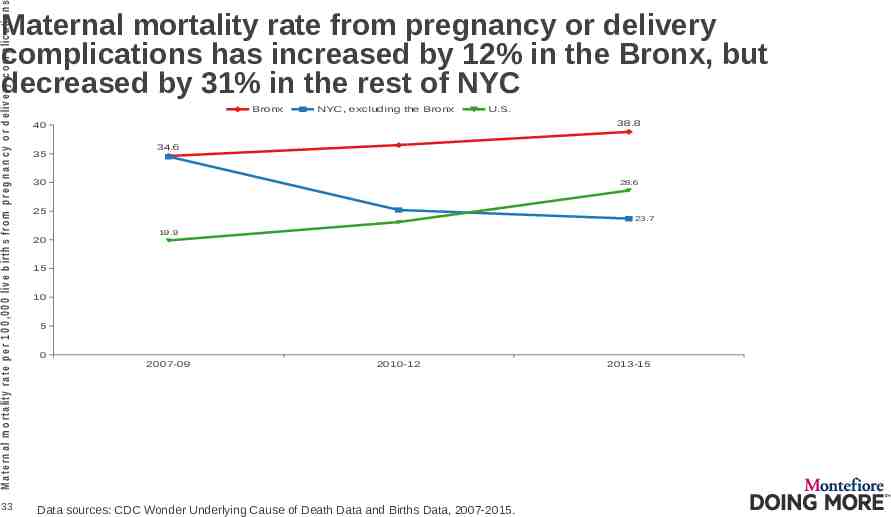
Maternal mortality rate from pregnancy or delivery complications 32
M a te rn a l m o r ta lity r a te p e r 1 0 0 ,0 0 0 liv e b ir th s fr o m p r e g n a n c y o r d e liv e r y c o m p lic a tio n s Maternal mortality rate from pregnancy or delivery complications has increased by 12% in the Bronx, but decreased by 31% in the rest of NYC 33 Bronx NYC, excluding the Bronx U.S. 38.8 40 35 34.6 30 28.6 25 20 23.7 19.9 15 10 5 0 2007-09 2010-12 Data sources: CDC Wonder Underlying Cause of Death Data and Births Data, 2007-2015. 2013-15
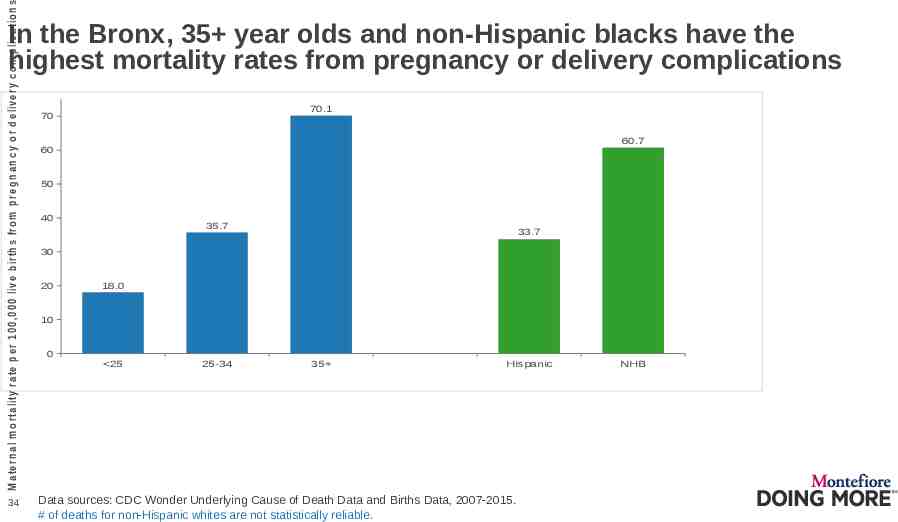
M a te rn a l m o rta lity ra te p e r 1 0 0 ,0 0 0 liv e b irth s fro m p re g n a n c y o r d e liv e ry c o m p lic a tio n s In the Bronx, 35 year olds and non-Hispanic blacks have the highest mortality rates from pregnancy or delivery complications 34 70.1 70 60.7 60 50 40 35.7 33.7 30 20 18.0 10 0 25 25-34 35 Hispanic Data sources: CDC Wonder Underlying Cause of Death Data and Births Data, 2007-2015. # of deaths for non-Hispanic whites are not statistically reliable. NHB
Pre-pregnancy BMI 35
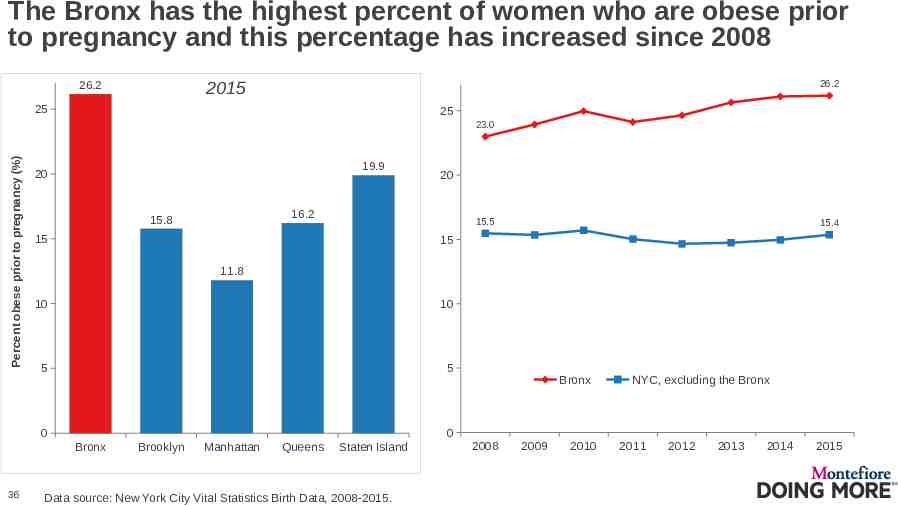
The Bronx has the highest percent of women who are obese prior to pregnancy and this percentage has increased since 2008 26.2 2015 26.2 25 25 Percent obese prior to pregnancy (%) 23.0 19.9 20 16.2 15.8 15.5 15 15.4 15 11.8 10 10 5 5 0 0 Bronx 36 20 Brooklyn Manhattan Queens Staten Island Data source: New York City Vital Statistics Birth Data, 2008-2015. Bronx 2008 2009 2010 NYC, excluding the Bronx 2011 2012 2013 2014 2015
Diabetes during pregnancy 37
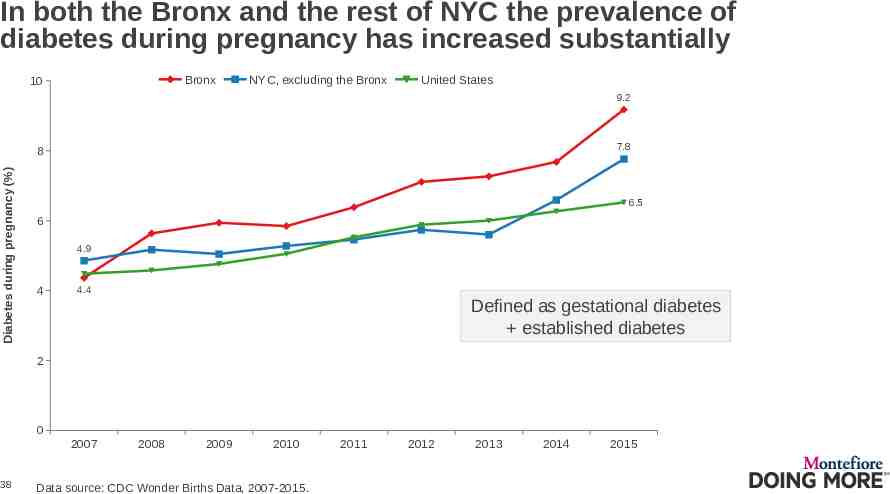
In both the Bronx and the rest of NYC the prevalence of diabetes during pregnancy has increased substantially Bronx 10 NYC, excluding the Bronx United States 9.2 7.8 Diabetes during pregnancy (%) 8 6.5 6 4.9 4 4.4 Defined as gestational diabetes established diabetes 2 0 2007 38 2008 2009 2010 Data source: CDC Wonder Births Data, 2007-2015. 2011 2012 2013 2014 2015
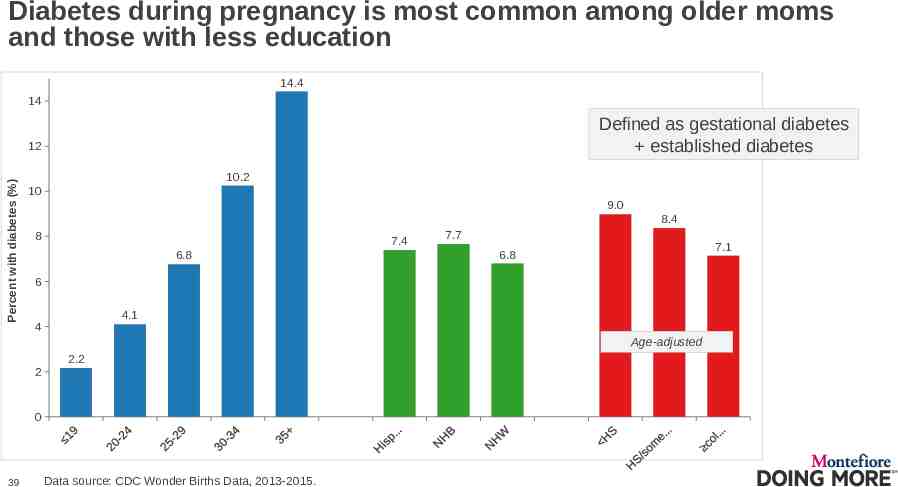
Diabetes during pregnancy is most common among older moms and those with less education 14.4 14 Defined as gestational diabetes established diabetes Percent with diabetes (%) 12 10.2 10 9.0 8.4 8 7.4 6.8 7.7 7.1 6.8 6 4.1 4 Age-adjusted 2 2.2 0 39 Data source: CDC Wonder Births Data, 2013-2015.
Chronic hypertension 40
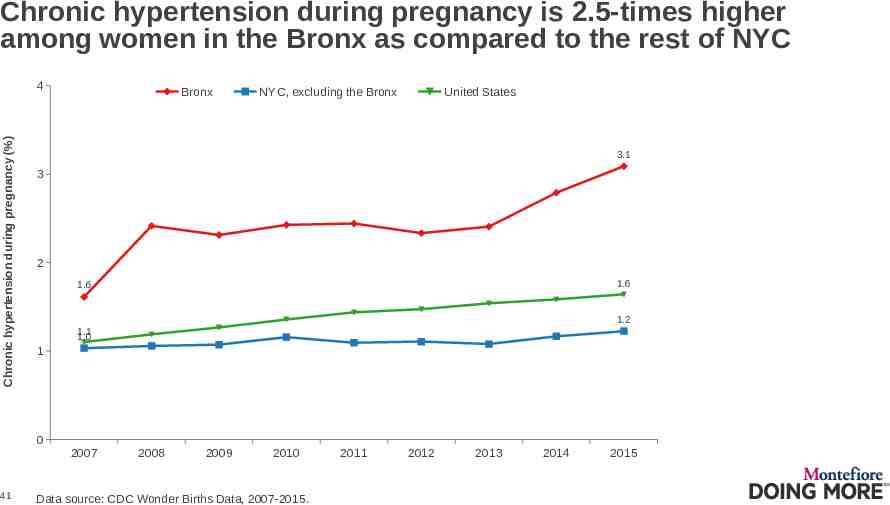
Chronic hypertension during pregnancy is 2.5-times higher among women in the Bronx as compared to the rest of NYC Chronic hypertension during pregnancy (%) 4 Bronx NYC, excluding the Bronx United States 3.1 3 2 1.6 1.6 1.2 1.1 1.0 1 0 2007 41 2008 2009 2010 Data source: CDC Wonder Births Data, 2007-2015. 2011 2012 2013 2014 2015
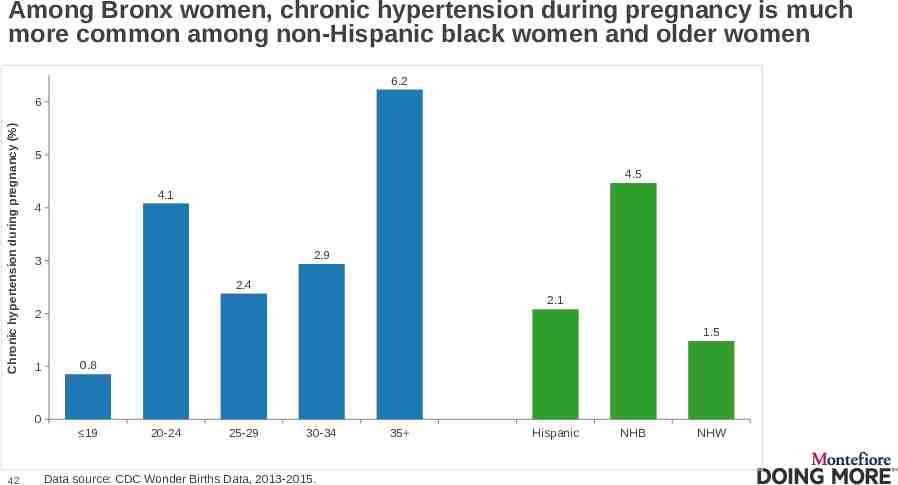
Among Bronx women, chronic hypertension during pregnancy is much more common among non-Hispanic black women and older women 6.2 Chronic hypertension during pregnancy (%) 6 5 4.5 4.1 4 2.9 3 2.4 2.1 2 1.5 1 0.8 0 19 42 20-24 25-29 30-34 Data source: CDC Wonder Births Data, 2013-2015. 35 Hispanic NHB NHW
Intent to exclusively breastfeed 43
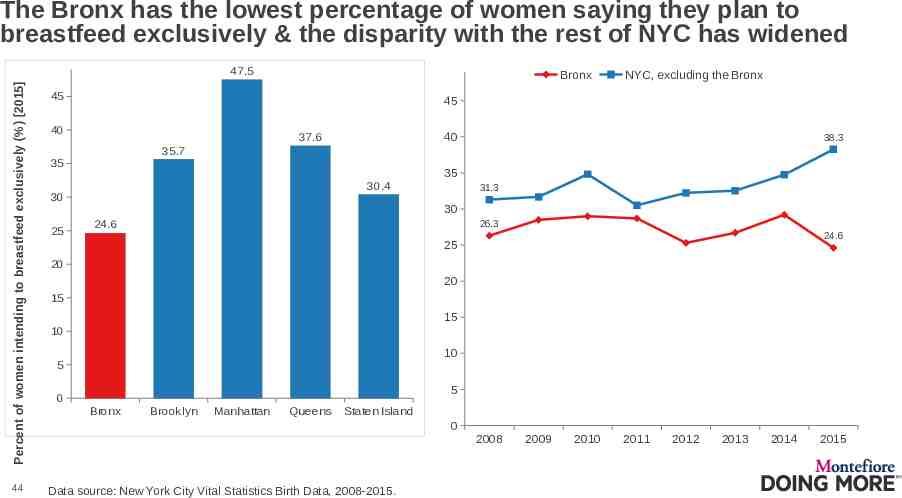
The Bronx has the lowest percentage of women saying they plan to breastfeed exclusively & the disparity with the rest of NYC has widened Percent of women intending to breastfeed exclusively (%) [2015] 47.5 44 Bronx 45 NYC, excluding the Bronx 45 40 40 37.6 38.3 35.7 35 35 30.4 30 25 31.3 30 26.3 24.6 24.6 25 20 20 15 15 10 10 5 5 0 Bronx Brooklyn Manhattan Queens Staten Island 0 2008 Data source: New York City Vital Statistics Birth Data, 2008-2015. 2009 2010 2011 2012 2013 2014 2015
About the Community Health Dashboard Project The goal of the project is to provide Bronx-specific data on risk factors and health outcomes with an emphasis on presenting data on trends, socio-demographic differences (e.g., by age, sex, race/ethnicity, etc.) and sub-county/neighborhood level data Data will be periodically updated as new data becomes available. Produced by Montefiore’s Office of Community & Population Health using publicly-available data sources For more information please contact Colin Rehm, PhD, Manager of Research & Evaluation ( [email protected]). 45