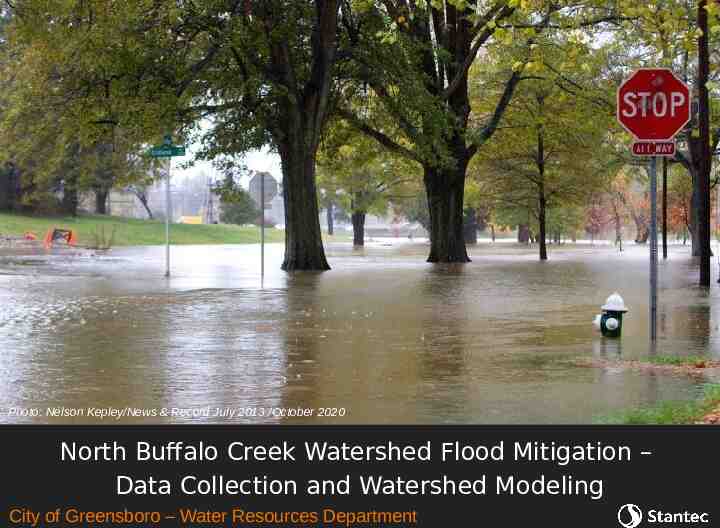
Photo: Nelson Kepley/News & Record July 2013 /October 2020


21 Slides9.77 MB
Photo: Nelson Kepley/News & Record July 2013 /October 2020 North Buffalo Creek Watershed Flood Mitigation – Data Collection and Watershed Modeling City of Greensboro – Water Resources Department
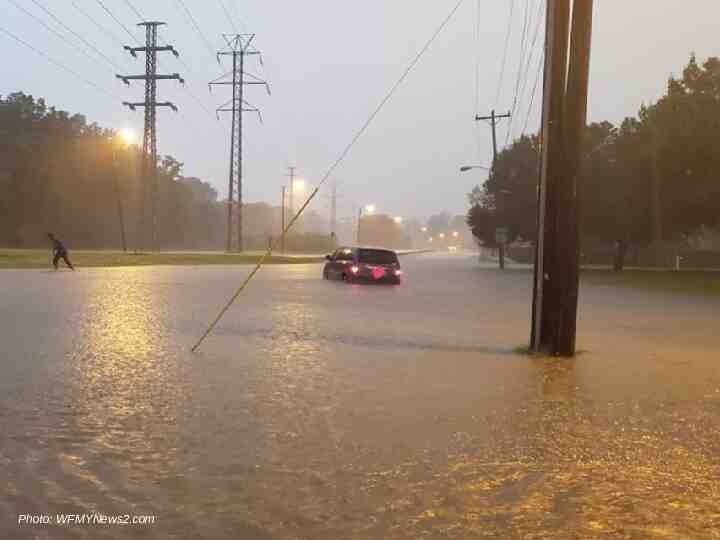
Photo: WFMYNews2.com
Introductions City of Greensboro David Phlegar, Stormwater Management Manager City of Greensboro Stantec Linda Pass, Project Manager Matthew Armstrong, Project Engineer / Watershed Modeler Laura Wilson, EIT
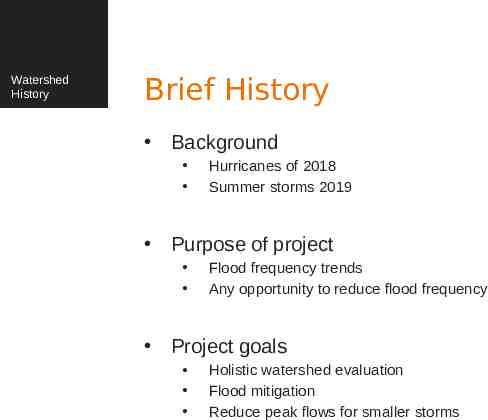
Watershed History Brief History Background Hurricanes of 2018 Summer storms 2019 Purpose of project Flood frequency trends Any opportunity to reduce flood frequency Project goals Holistic watershed evaluation Flood mitigation Reduce peak flows for smaller storms
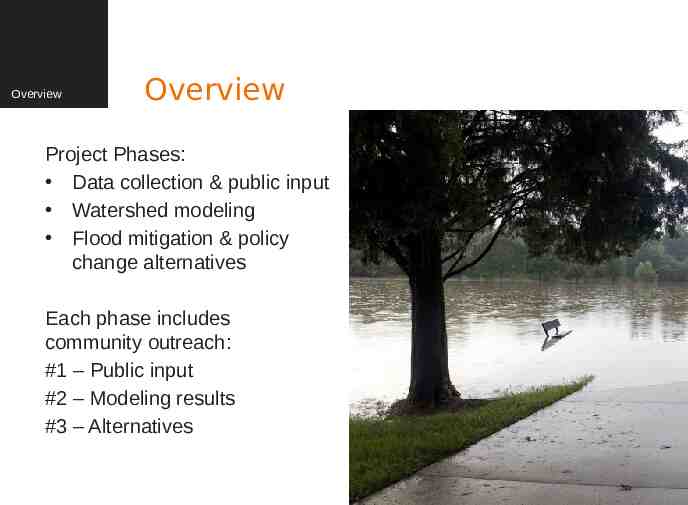
Overview Overview Project Phases: Data collection & public input Watershed modeling Flood mitigation & policy change alternatives Each phase includes community outreach: #1 – Public input #2 – Modeling results #3 – Alternatives
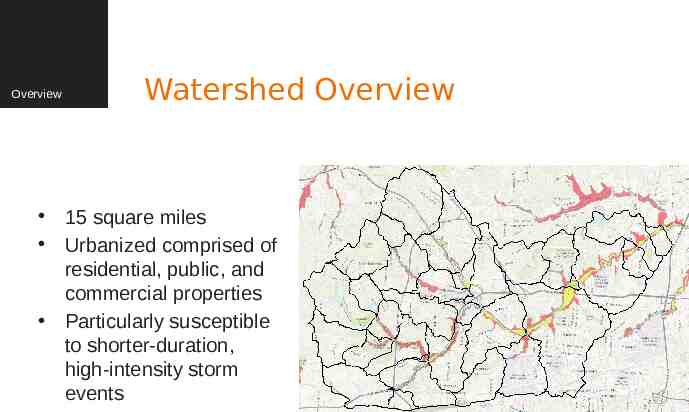
Overview Watershed Overview 15 square miles Urbanized comprised of residential, public, and commercial properties Particularly susceptible to shorter-duration, high-intensity storm events
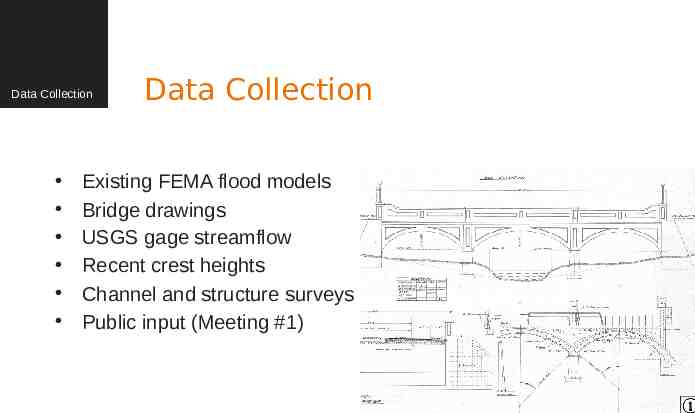
Data Collection Data Collection Existing FEMA flood models Bridge drawings USGS gage streamflow Recent crest heights Channel and structure surveys Public input (Meeting #1)
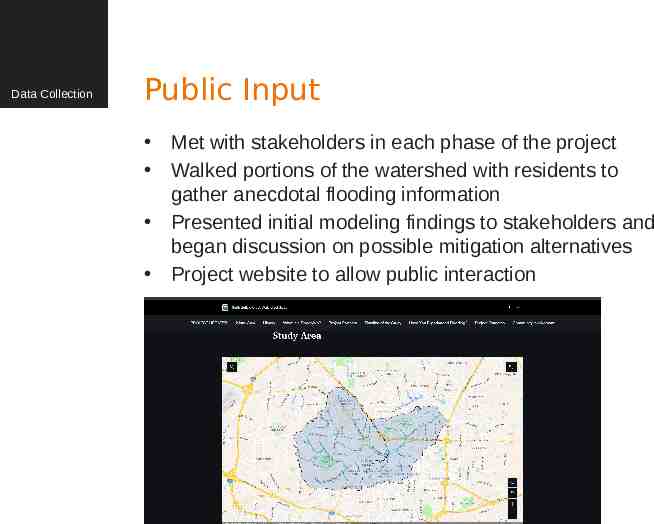
Data Collection Public Input Met with stakeholders in each phase of the project Walked portions of the watershed with residents to gather anecdotal flooding information Presented initial modeling findings to stakeholders and began discussion on possible mitigation alternatives Project website to allow public interaction
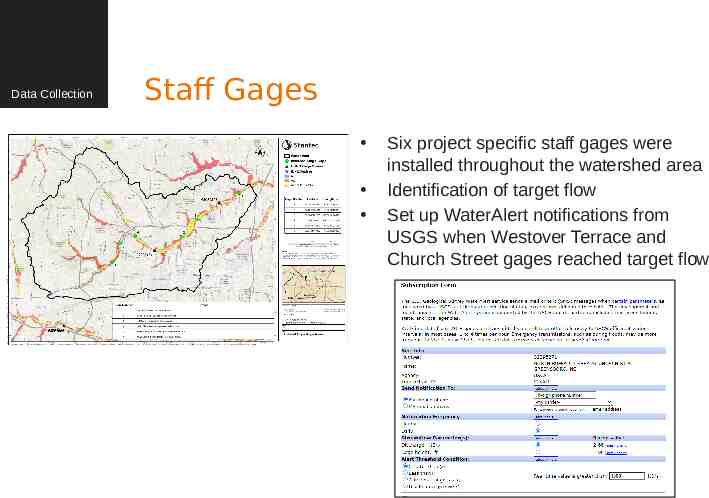
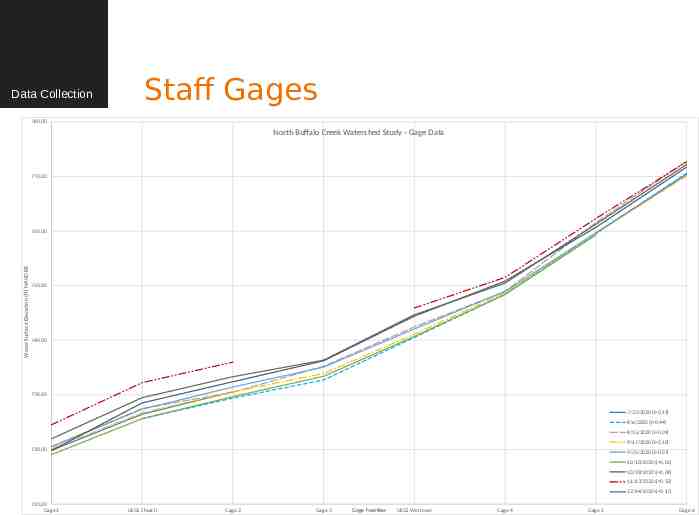
Data Collection Staff Gages Six project specific staff gages were installed throughout the watershed area Identification of target flow Set up WaterAlert notifications from USGS when Westover Terrace and Church Street gages reached target flow
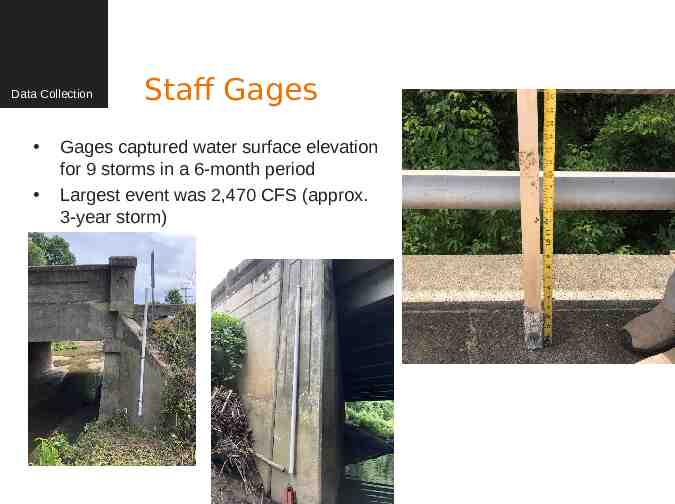
Data Collection Staff Gages Gages captured water surface elevation for 9 storms in a 6-month period Largest event was 2,470 CFS (approx. 3-year storm)
Data Collection Staff Gages 780.00 North Buffalo Creek Watershed Study - Gage Data 770.00 Water Surface Elevation (ft) NAVD 88 760.00 750.00 740.00 730.00 7/23/2020 (i 0.19) 8/6/2020 (i 0.44) 8/15/2020 (i 0.09) 9/17/2020 (i 0.10) 720.00 9/25/2020 (i 0.07) 10/10/2020 (i 0.05) 10/29/2020 (i 0.09) 11/13/2020 (i 0.32) 12/14/2020 (i 0.17) 710.00 Gage 1 USGS Church Gage 2 Gage 3 Gage Number USGS Westover Gage 4 Gage 5 Gage 6
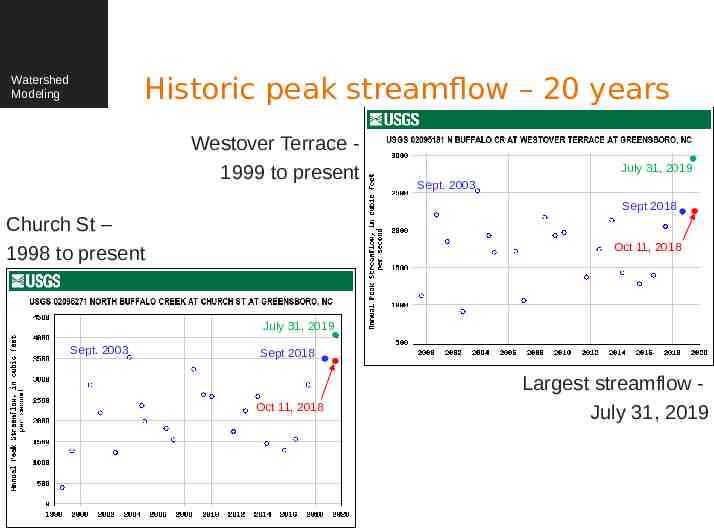
Historic peak streamflow – 20 years Watershed Modeling Westover Terrace 1999 to present July 31, 2019 Sept. 2003 Sept 2018 Church St – 1998 to present Oct 11, 2018 July 31, 2019 Sept. 2003 Sept 2018 Oct 11, 2018 Largest streamflow July 31, 2019
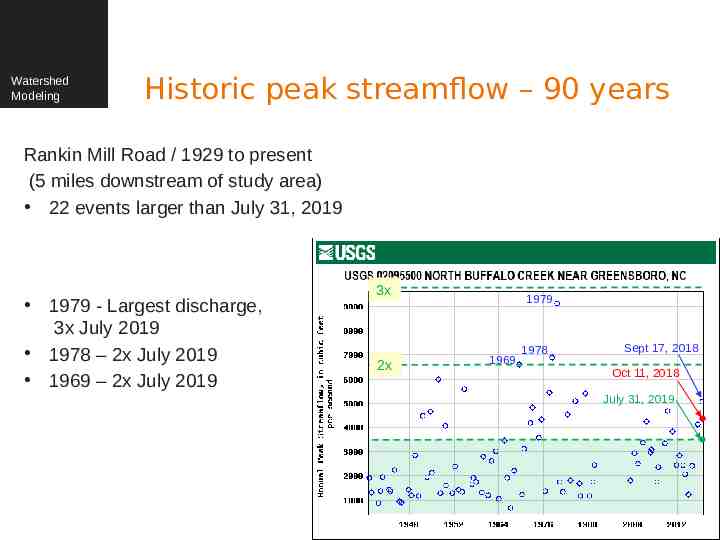
Watershed Modeling Historic peak streamflow – 90 years Rankin Mill Road / 1929 to present (5 miles downstream of study area) 22 events larger than July 31, 2019 1979 - Largest discharge, 3x July 2019 1978 – 2x July 2019 1969 – 2x July 2019 3x 2x 1979 1969 1978 Sept 17, 2018 Oct 11, 2018 July 31, 2019
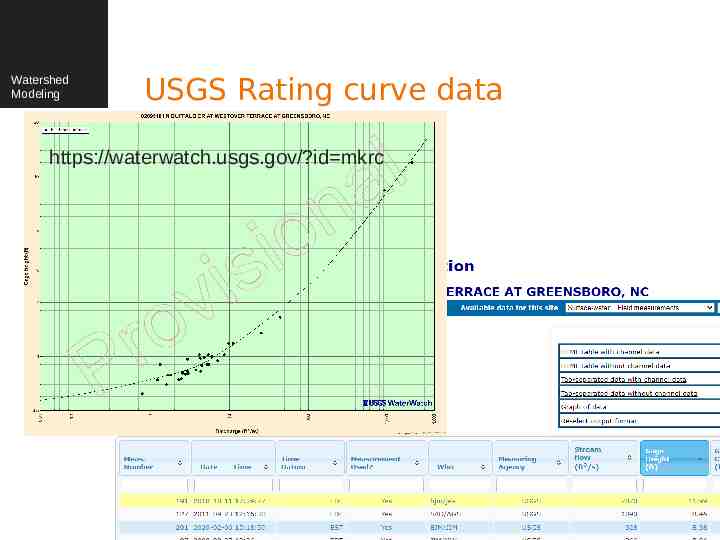
Watershed Modeling USGS Rating curve data Add data extrapolation https://waterwatch.usgs.gov/?id mkrc
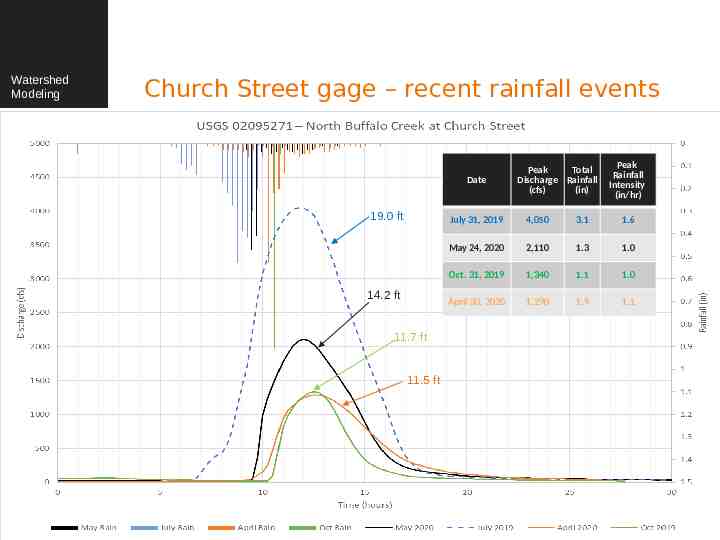
Watershed Modeling Church Street gage – recent rainfall events Date 19.0 ft 14.2 ft 11.7 ft 11.5 ft Peak Total Discharge Rainfall (cfs) (in) Peak Rainfall Intensity (in/hr) July 31, 2019 4,050 3.1 1.6 May 24, 2020 2,110 1.3 1.0 Oct. 31, 2019 1,340 1.1 1.0 April 30, 2020 1,290 1.9 1.1
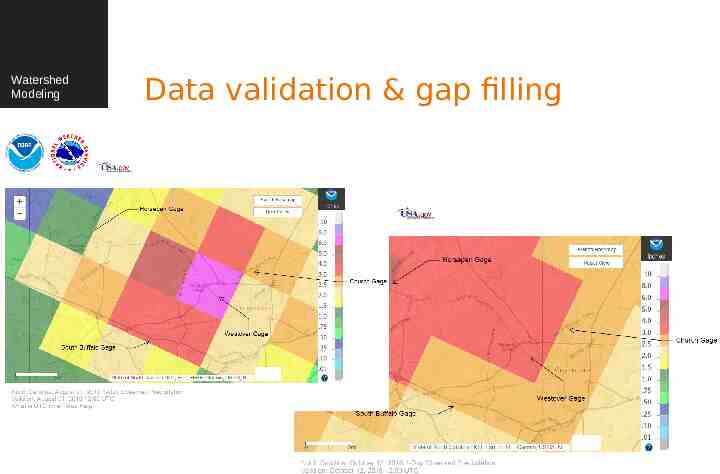
Watershed Modeling Data validation & gap filling
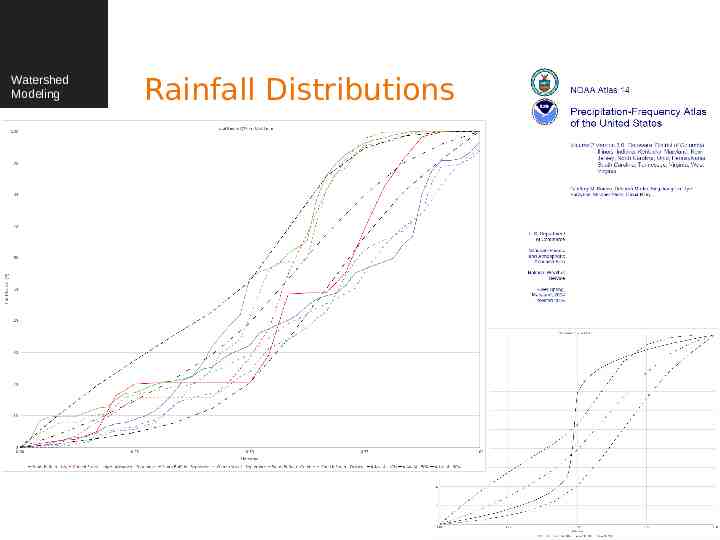
Watershed Modeling Rainfall Distributions
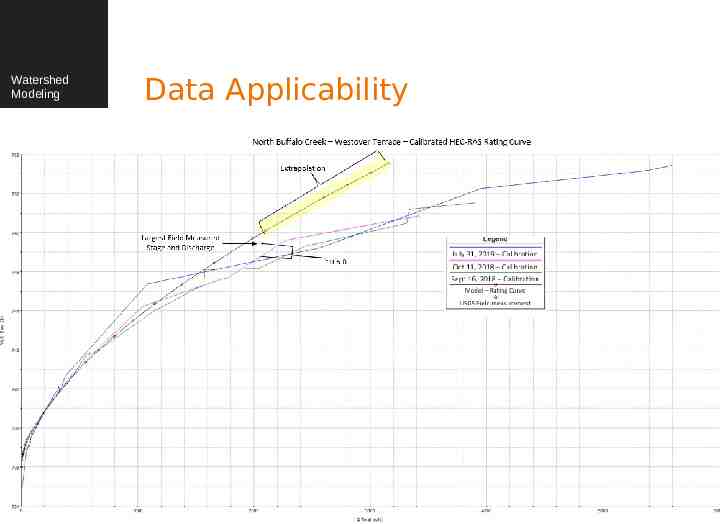
Watershed Modeling Data Applicability
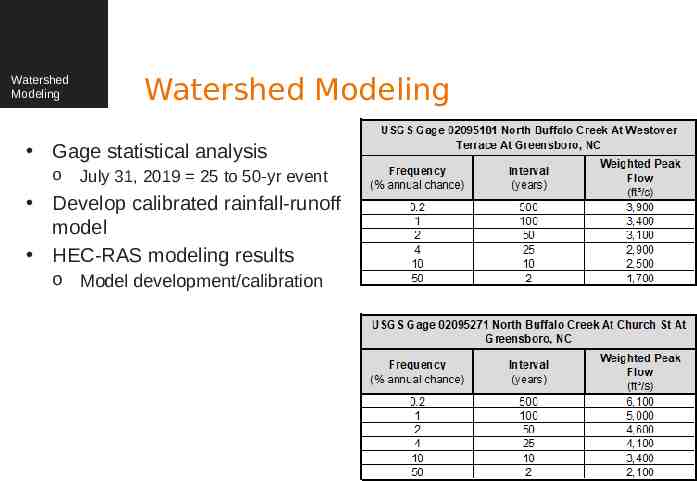
Watershed Modeling Watershed Modeling Gage statistical analysis o July 31, 2019 25 to 50-yr event Develop calibrated rainfall-runoff model HEC-RAS modeling results o Model development/calibration
Flood Mitigation Alternatives Flood Mitigation Alternatives Some feasible mitigations alternatives showed up to 0.8 water surface elevation difference in the 25-year design storm Alternatives with positive modeling results will be further considered for implementation in future projects. Public input will be considered in planning phases for mitigation projects.
Questions?