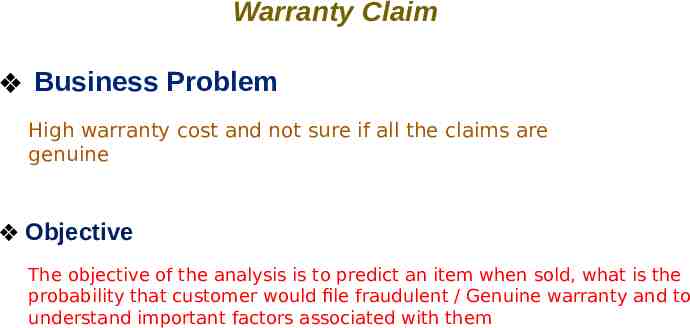
Warranty Claim ❖ Business Problem High warranty cost and not sure


12 Slides1.12 MB
Warranty Claim Business Problem High warranty cost and not sure if all the claims are genuine Objective The objective of the analysis is to predict an item when sold, what is the probability that customer would file fraudulent / Genuine warranty and to understand important factors associated with them
Project name : Warranty Claim Fraud Detection Team Name : Group 1 Mentor Name : Date :10/10/21 Neha Copyrights 2017 Innodatatics Inc. All Rights Reserve
Project Architecture / Project Flow 1. 2. 3. 4. 5. Exploratory Data Analysis (EDA) Feature Engineering Model Building Model Predictions Deployment
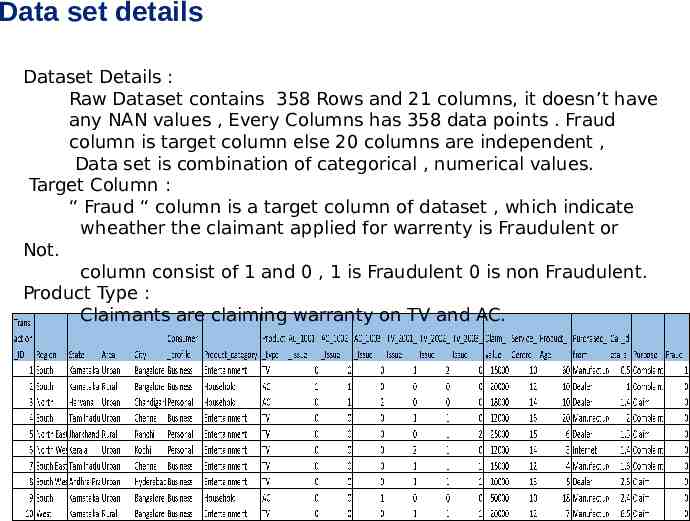
Data set details Dataset Details : Raw Dataset contains 358 Rows and 21 columns, it doesn’t have any NAN values , Every Columns has 358 data points . Fraud column is target column else 20 columns are independent , Data set is combination of categorical , numerical values. Target Column : “ Fraud “ column is a target column of dataset , which indicate wheather the claimant applied for warrenty is Fraudulent or Not. column consist of 1 and 0 , 1 is Fraudulent 0 is non Fraudulent. Product Type : Claimants are claiming warranty on TV and AC.
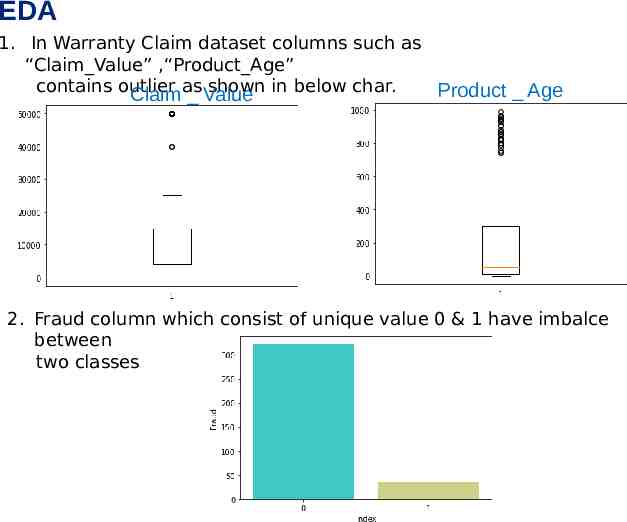
EDA 1. In Warranty Claim dataset columns such as “Claim Value” ,“Product Age” contains outlier as shown in below char. Product Age Claim Value 2. Fraud column which consist of unique value 0 & 1 have imbalce between two classes
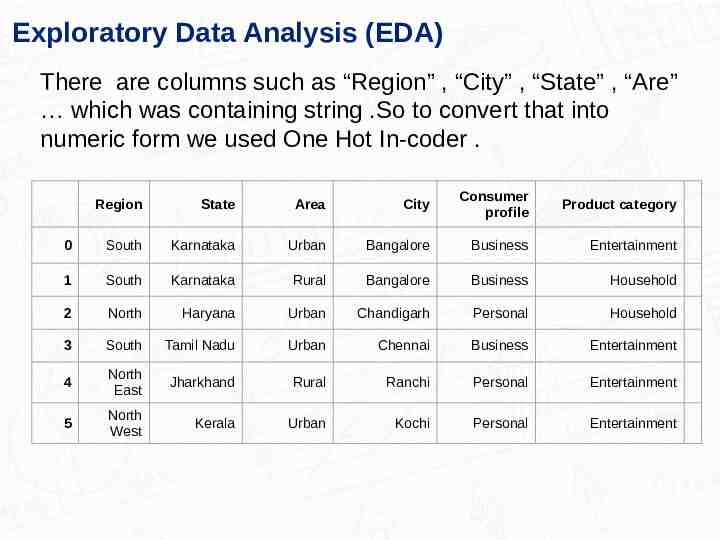
Exploratory Data Analysis (EDA) There are columns such as “Region” , “City” , “State” , “Are” which was containing string .So to convert that into numeric form we used One Hot In-coder . Region State Area City Consumer profile Product category 0 South Karnataka Urban Bangalore Business Entertainment 1 South Karnataka Rural Bangalore Business Household 2 North Haryana Urban Chandigarh Personal Household 3 South Tamil Nadu Urban Chennai Business Entertainment 4 North East Jharkhand Rural Ranchi Personal Entertainment 5 North West Kerala Urban Kochi Personal Entertainment
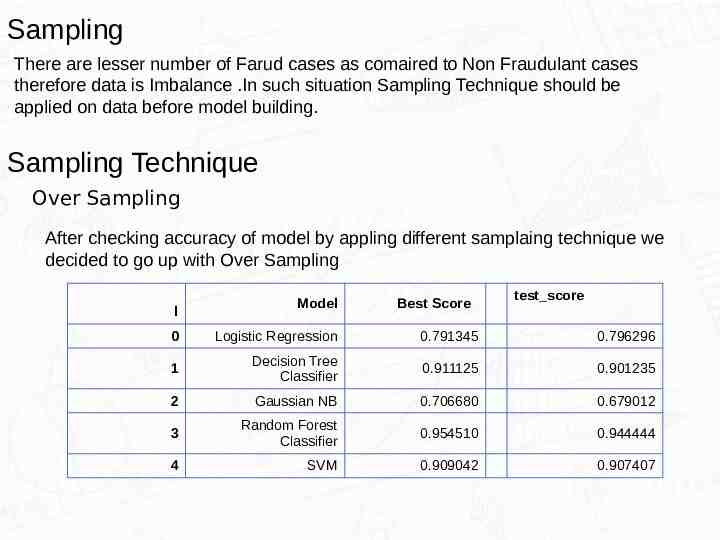
Sampling There are lesser number of Farud cases as comaired to Non Fraudulant cases therefore data is Imbalance .In such situation Sampling Technique should be applied on data before model building. Sampling Technique Over Sampling After checking accuracy of model by appling different samplaing technique we decided to go up with Over Sampling l Model Best Score test score 0 Logistic Regression 0.791345 0.796296 1 Decision Tree Classifier 0.911125 0.901235 2 Gaussian NB 0.706680 0.679012 3 Random Forest Classifier 0.954510 0.944444 4 SVM 0.909042 0.907407
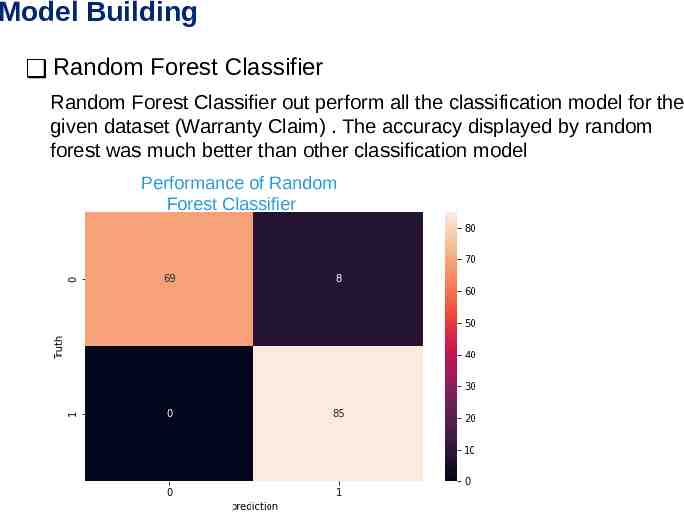
Model Building Random Forest Classifier Random Forest Classifier out perform all the classification model for the given dataset (Warranty Claim) . The accuracy displayed by random forest was much better than other classification model Performance of Random Forest Classifier
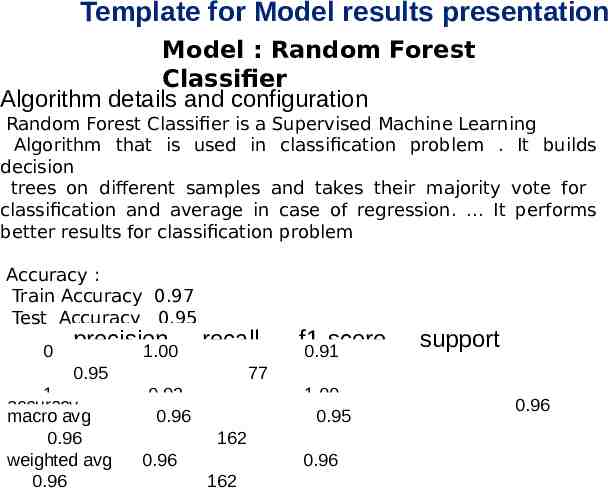
Template for Model results presentation Model : Random Forest Classifier Algorithm details and configuration Random Forest Classifier is a Supervised Machine Learning Algorithm that is used in classification problem . It builds decision trees on different samples and takes their majority vote for classification and average in case of regression. . It performs better results for classification problem Accuracy : Train Accuracy 0.97 Test Accuracy 0.95 0 precision recall 1.00 0.95 f1-score 0.91 support 77 1 0.92 accuracy 0.96 85 macro avg 0.96 162 0.96 162 weighted avg 0.96 0.96 162 1.00 0.95 0.96 0.96
Model Deployment Model Deployment is done using Streamlit
Challenges faced? As data was highly imbalanced . So Challenged faced was how to predict model accurately . How did you overcome? We tried different sampling technique in order to balance the data at last as per the accuracy we selected Over sampeling technique to balance data
Thank you