Using DNA Microarrays from Multiple Species: Comparisons for Teaching

37 Slides7.36 MB
Using DNA Microarrays from Multiple Species: Comparisons for Teaching Effectiveness Todd T. Eckdahl Biology Department Missouri Western State College
Overview Background Courses using microarray technology Species studied Implementation Results Planned research projects
Missouri Western State College Saint Joseph, Missouri State-supported PUI 5200 students 200 faculty Biology Department 340 majors 10 faculty No graduate degree programs New major in Biochemistry and Molecular Biology
Courses Using Microarray Technology BIO 431 Molecular Biology 4 credit course 3 hours lecture, 3 hours lab Student majors BMB, Biology with Health Sciences emphasis BIO 313 Topics in Molecular Genetics 1 credit course 3 hours lab Student majors BMB, Biology-Health Sciences, Teaching
Functional Genomics Technology Microarrays cDNAs printed eg. Stanford yeast chips, UW E. coli chips 80-mer oligos printed eg. ISB yeast chips Labeling options Indirect labeling eg. Genisphere dendrimers Direct incorporation eg. Ulysis alexafluore labeling
Conducting Microarray Experiments in a Course Emphasize the “Big Picture” Genomics, functional genomics, proteomics Shift to data-rich science Primary Literature Brainstorming for ideas Scheduling Data Analysis Presentations
Ideas for Yeast Experiments Glucose vs. Galactose vs. Fructose vs. Maltose Anaerobic vs. aerobic Induction of sporulation Heat Shock v. Cold Shock Drug treatment
Minor Groove Binding Drugs Anti-tumor properties Conformational change in the 3D structure of DNA Prior Knowledge of MGBD/DNA interaction As models for minor groove binding proteins DAPI
Yeast Culture OD at 660 nm to measure turbidity Grown through log phase 4 hours of exposure to 10 uM DAPI Control culture without DAPI
Isolation of RNA Sterile, RNase- free equipment and workspace Harvesting of yeast Production of spheroblasts Isolation of RNA via RNA spin column Elution of RNA Quantify RNA with A260 / A280 Run RNA on denaturing agarose
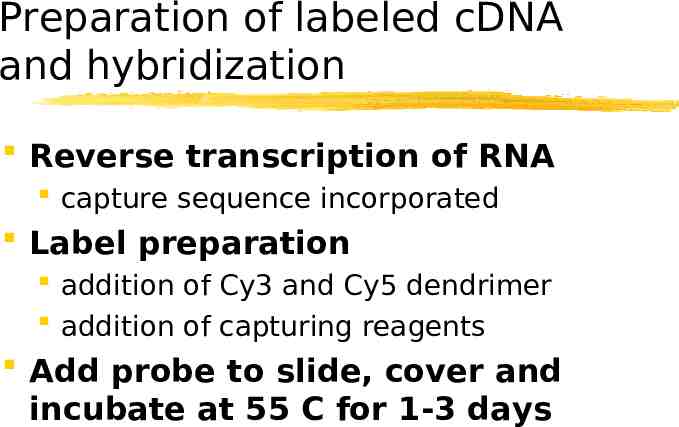
Preparation of labeled cDNA and hybridization Reverse transcription of RNA capture sequence incorporated Label preparation addition of Cy3 and Cy5 dendrimer addition of capturing reagents Add probe to slide, cover and incubate at 55 C for 1-3 days
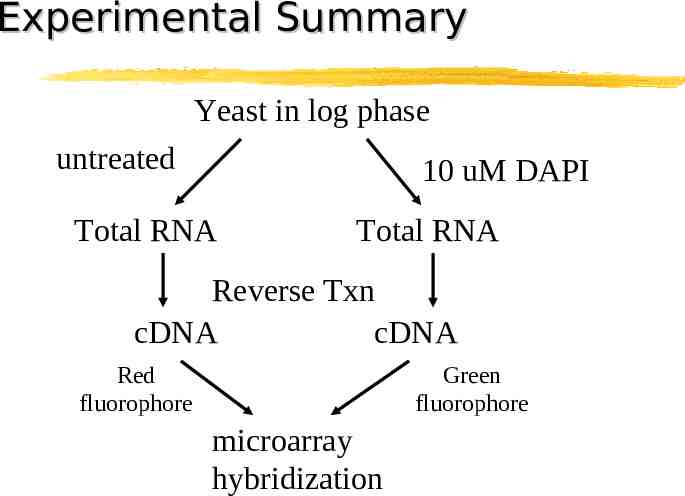
Experimental Summary Yeast in log phase untreated 10 uM DAPI Total RNA Total RNA Reverse Txn cDNA cDNA Red fluorophore Green fluorophore microarray hybridization
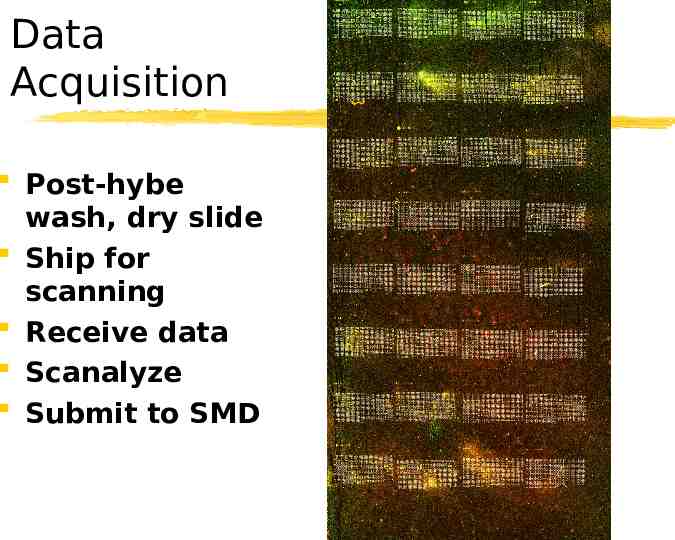
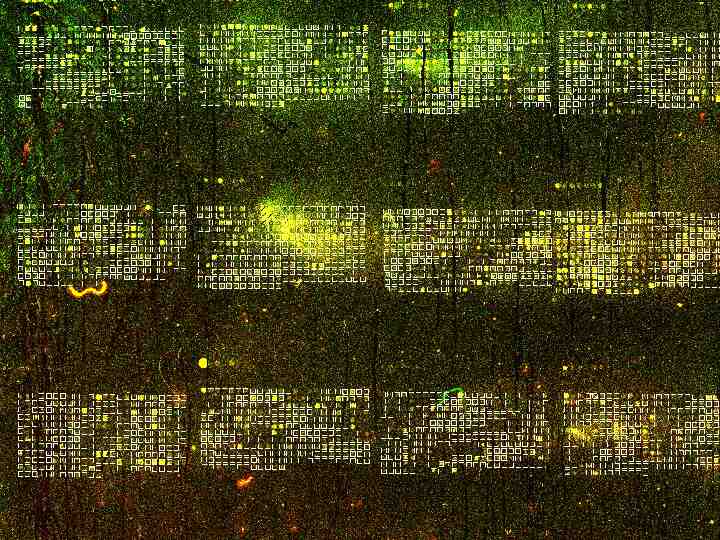
Data Acquisition Post-hybe wash, dry slide Ship for scanning Receive data Scanalyze Submit to SMD
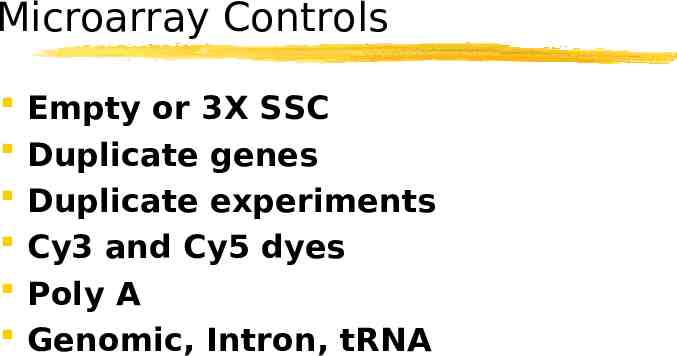
Microarray Controls Empty or 3X SSC Duplicate genes Duplicate experiments Cy3 and Cy5 dyes Poly A Genomic, Intron, tRNA
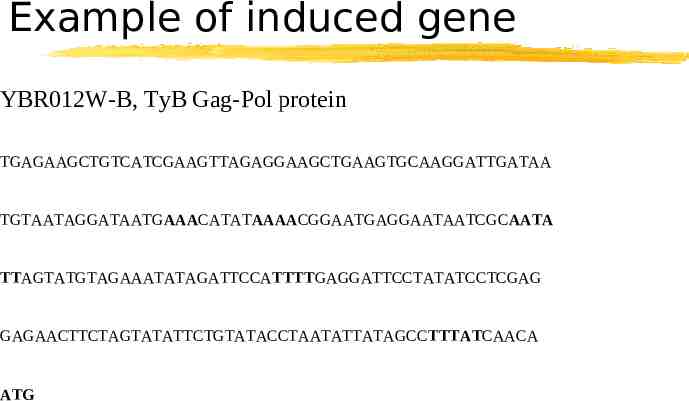
Example of induced gene YBR012W-B, TyB Gag-Pol protein TGAGAAGCTGTCATCGAAGTTAGAGGAAGCTGAAGTGCAAGGATTGATAA TGTAATAGGATAATGAAACATATAAAACGGAATGAGGAATAATCGCAATA TTAGTATGTAGAAATATAGATTCCATTTTGAGGATTCCTATATCCTCGAG GAGAACTTCTAGTATATTCTGTATACCTAATATTATAGCCTTTATCAACA ATG
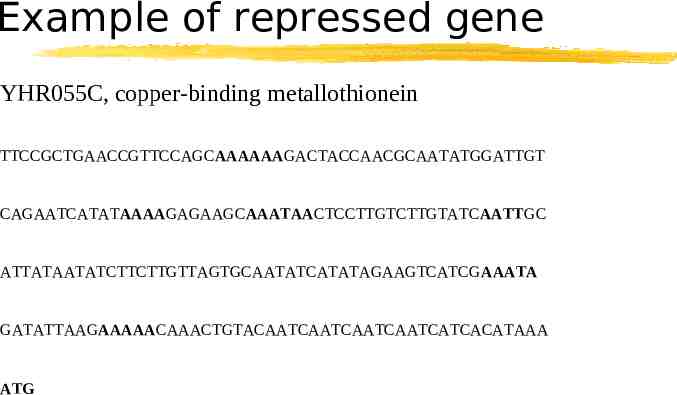
Example of repressed gene YHR055C, copper-binding metallothionein TTCCGCTGAACCGTTCCAGCAAAAAAGACTACCAACGCAATATGGATTGT CAGAATCATATAAAAGAGAAGCAAATAACTCCTTGTCTTGTATCAATTGC ATTATAATATCTTCTTGTTAGTGCAATATCATATAGAAGTCATCGAAATA GATATTAAGAAAAACAAACTGTACAATCAATCAATCAATCATCACATAAA ATG
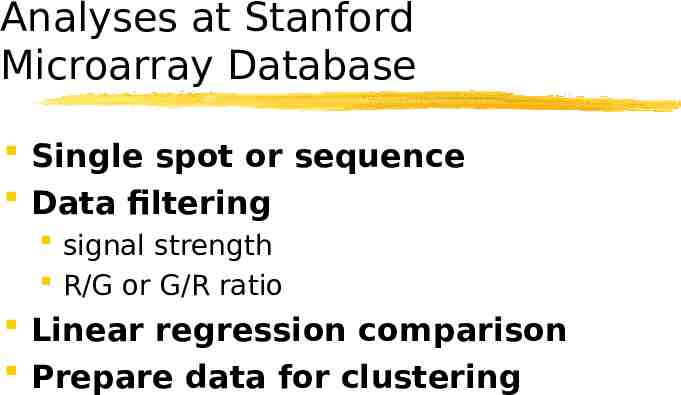
Analyses at Stanford Microarray Database Single spot or sequence Data filtering signal strength R/G or G/R ratio Linear regression comparison Prepare data for clustering
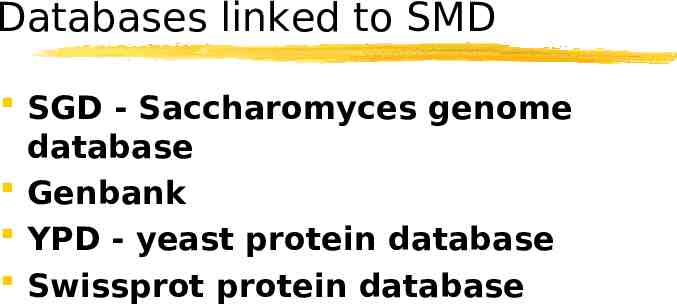
Databases linked to SMD SGD - Saccharomyces genome database Genbank YPD - yeast protein database Swissprot protein database
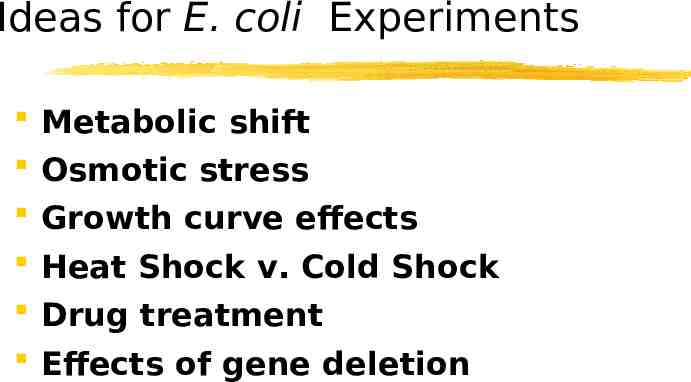
Ideas for E. coli Experiments Metabolic shift Osmotic stress Growth curve effects Heat Shock v. Cold Shock Drug treatment Effects of gene deletion
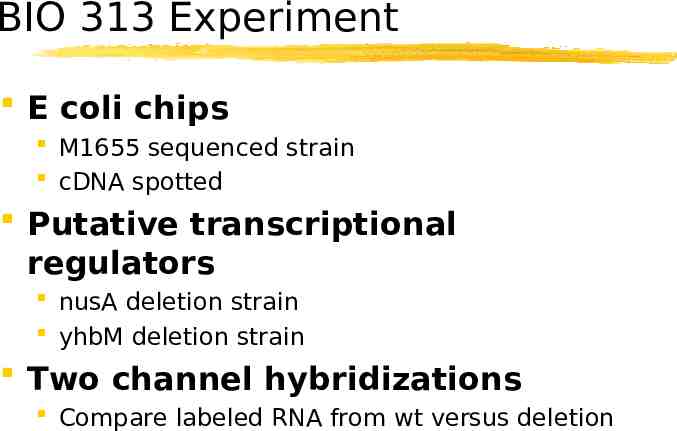
BIO 313 Experiment E coli chips M1655 sequenced strain cDNA spotted Putative transcriptional regulators nusA deletion strain yhbM deletion strain Two channel hybridizations Compare labeled RNA from wt versus deletion
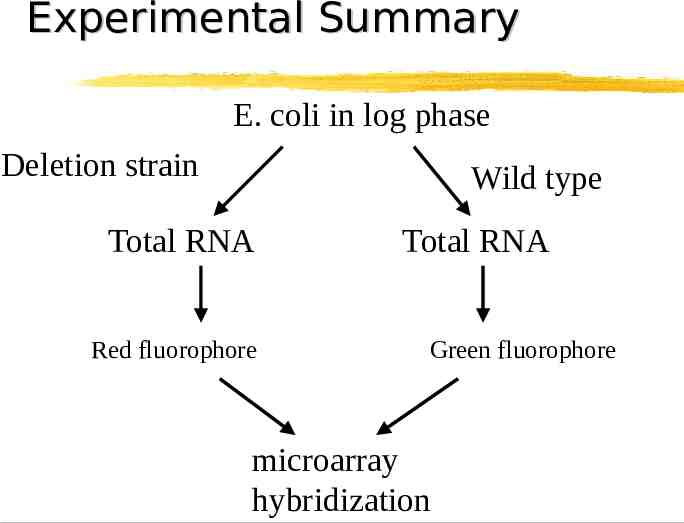
Experimental Summary E. coli in log phase Deletion strain Wild type Total RNA Red fluorophore Total RNA Green fluorophore microarray hybridization
E. coli culture Overnight culture Grown at 37 C to log phase OD at 600 nm to measure turbidity
RNA Isolation Sterile, RNase-free equipment and work area Total RNA SafeKit Total RNA Safe protocol used Lysis of E. coli done with mixture of TE and lysozyme
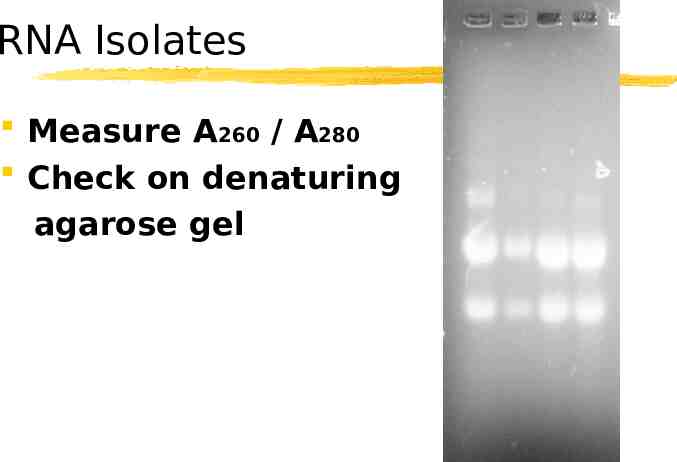
RNA Isolates Measure A260 / A280 Check on denaturing agarose gel
Labeling Labeling of isolated RNA done by use of ULYSIS Nucleic Acid Direct Labeling Kit ULYSIS protocol followed Fluorescent Dyes: Alexa Fluor 546 (green) and Alexa Fluor 660 (red)
Hybridization Microarray prehybridized Labeled RNA mixed together in hybridization buffer and added to slide Hyb at 55 C in dry incubator overnight Post-hyb washes
Microarray Controls Empty or 3X SSC Duplicate genes Duplicate experiments Cy3 and Cy5 dyes Genomic
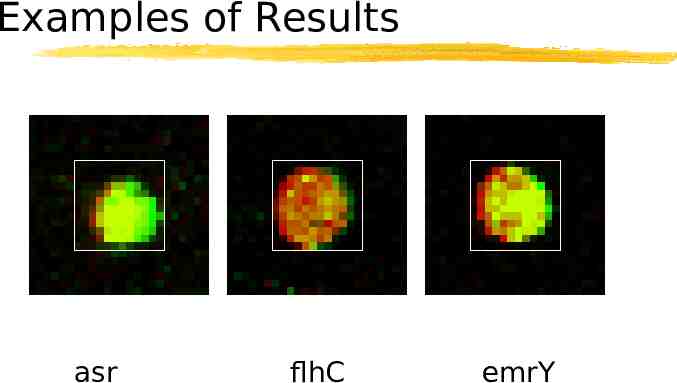
Examples of Results asr flhC emrY
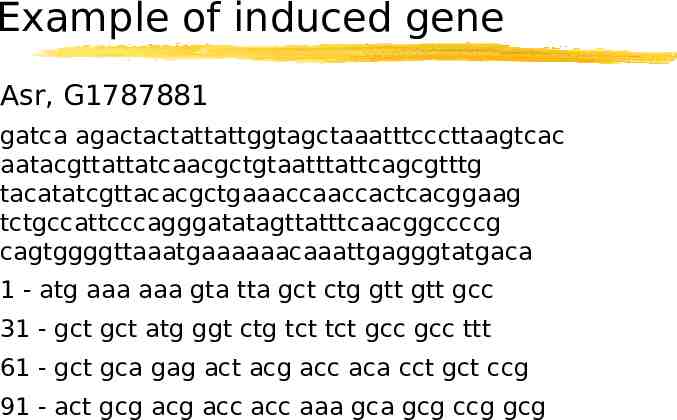
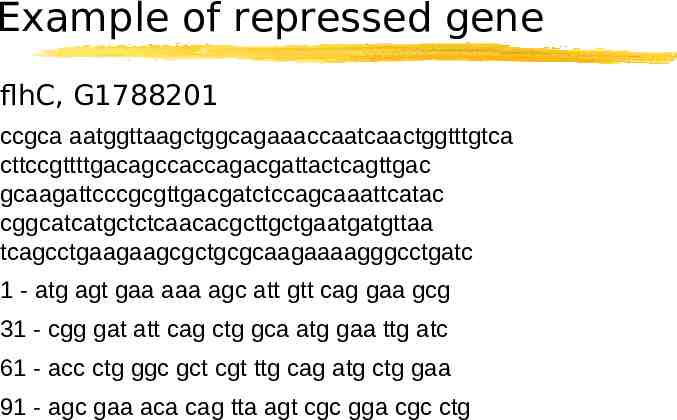
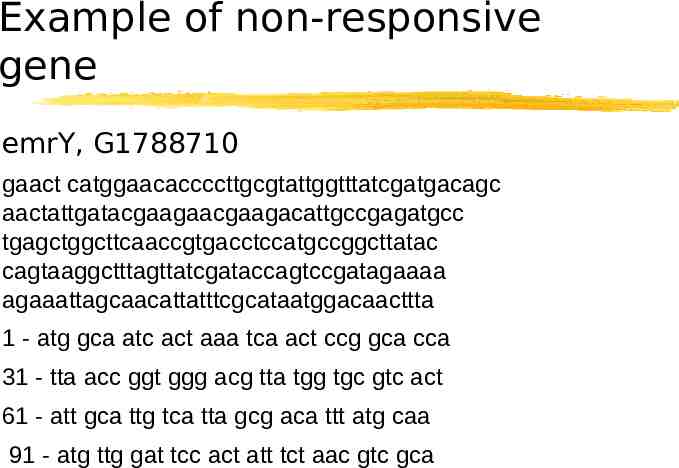
Examples Induced Asr, G1787881 acid shock protein Repressed flhC, G1788201 regulator of flagellar biosynthesis acting on class 2 operons Non-responsive emrY, G1788710 multidrug resistance protein Y putative transport
Example of induced gene Asr, G1787881 gatca agactactattattggtagctaaatttcccttaagtcac aatacgttattatcaacgctgtaatttattcagcgtttg tacatatcgttacacgctgaaaccaaccactcacggaag tctgccattcccagggatatagttatttcaacggccccg cagtggggttaaatgaaaaaacaaattgagggtatgaca 1 - atg aaa aaa gta tta gct ctg gtt gtt gcc 31 - gct gct atg ggt ctg tct tct gcc gcc ttt 61 - gct gca gag act acg acc aca cct gct ccg 91 - act gcg acg acc acc aaa gca gcg ccg gcg
Example of repressed gene flhC, G1788201 ccgca aatggttaagctggcagaaaccaatcaactggtttgtca cttccgttttgacagccaccagacgattactcagttgac gcaagattcccgcgttgacgatctccagcaaattcatac cggcatcatgctctcaacacgcttgctgaatgatgttaa tcagcctgaagaagcgctgcgcaagaaaagggcctgatc 1 - atg agt gaa aaa agc att gtt cag gaa gcg 31 - cgg gat att cag ctg gca atg gaa ttg atc 61 - acc ctg ggc gct cgt ttg cag atg ctg gaa 91 - agc gaa aca cag tta agt cgc gga cgc ctg
Example of non-responsive gene emrY, G1788710 gaact catggaacaccccttgcgtattggtttatcgatgacagc aactattgatacgaagaacgaagacattgccgagatgcc tgagctggcttcaaccgtgacctccatgccggcttatac cagtaaggctttagttatcgataccagtccgatagaaaa agaaattagcaacattatttcgcataatggacaacttta 1 - atg gca atc act aaa tca act ccg gca cca 31 - tta acc ggt ggg acg tta tgg tgc gtc act 61 - att gca ttg tca tta gcg aca ttt atg caa 91 - atg ttg gat tcc act att tct aac gtc gca
Microarrays in Courses: Lessons Learned Advance planning essential Controls for critical steps Reliability and Reproducibility Do Controls Make Sense? Do Results Make Sense? Potential for large amounts of data means extensive analysis time needed
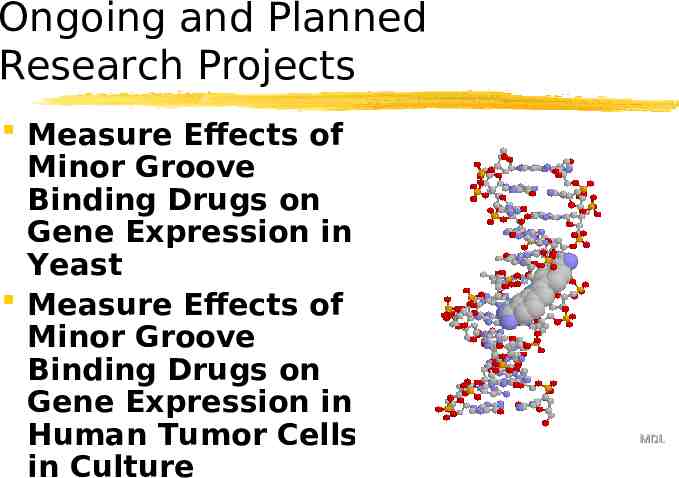
Ongoing and Planned Research Projects Measure Effects of Minor Groove Binding Drugs on Gene Expression in Yeast Measure Effects of Minor Groove Binding Drugs on Gene Expression in Human Tumor Cells in Culture
Big Ideas Sequence and structural requirements for MGBD binding A T rich sequences DNA bending Determination of optimal binding sites Effects of MGBDs on gene expression Preliminary data using RT-PCR Global patterns of gene expression Complementary in vitro and in vivo approaches
Acknowledgements Genome Consortium for Active Teaching Malcolm Campbell, Davidson College NSF DBI 0099720 MUE grant Dr. Barbara Dunn, Stanford University Dr. Fred Blattner lab, UW-Madison Dr. Bob Getts, Genisphere, Inc. Missouri Western Students