Transition to Google Analytics 4 (GA4)


31 Slides1.96 MB
Transition to Google Analytics 4 (GA4)
Key Changes New setup – Combines data from both apps and websites – No longer has property “views” New data model and event tracking – GA4 properties use a more flexible, event-based model focused on engagement versus the session-based, pageview model used in UA – Has predictive capabilities to work around increased privacy restrictions – Automatically tracks certain events New reporting tools 2
GA4 Setup & Organization 3
GA4 Organization Accounts Property Maximum of 100 accounts 100 properties per account Data Stream 50 data streams per property Accounts are the containers for the analytics properties. Properties are the containers for the reports on the data collected. Data streams (NEW!) are flows of data from a customer touchpoint (web user journey) to Analytics. Note: User Permissions can be set at the property or account levels. 4
Account Setup Example Tip: If common web journeys span multiple domains or apps but should be analyzed and reported together, use data streams under one property. Admissions website example: There are three admissions websites/apps that track the admissions journey: Admissions website, Portal (slate), and the Admitted Students site are all part of the admissions process. Two ways to setup this property: Admissions (Property) Admissions website (data stream 1) Admitted portal (data stream 2) Admitted students (data stream 3) Admissions (Property) One ID) data stream (measurement Admissions website Admitted portal Admitted students 5
Data Model & Events Tracking 6
GA4 Events In UA, an event was its own hit type that had a category, action and label. In GA4, there is no category, action or label. Every hit (even page views and social interactions) is an event. These events allow you to measure user interactions like loading a page, scrolling on a page and clicking a link. 7
Types of Events Automatically collected events – includes first visit, page views, sessions, and user engagement Enhanced measurement events (NEW!) – includes scrolls, file downloads, video engagement, and outbound clicks) Recommended events – Includes ad impressions, shares, sign-ups, online sales and gaming events Custom events 8
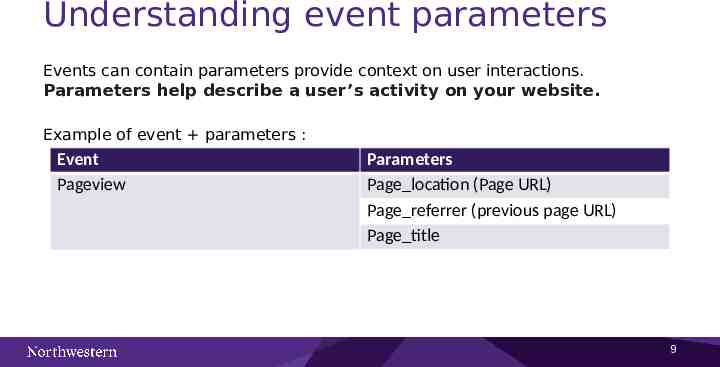
Understanding event parameters Events can contain parameters provide context on user interactions. Parameters help describe a user’s activity on your website. Example of event parameters : Event Pageview Parameters Page location (Page URL) Page referrer (previous page URL) Page title 9
Key Metric Changes Between UA & GA4 If you want to compare results in your Google Analytics 4 property against those in your Universal Analytics property, you should be aware that there are changes to the following metrics that may skew your data: Users Pageviews Sessions Bounce rate 10
Users The primary user metric has changed from Total Users to Active Users. UA Two user metrics: Total Users and New Users Total Users: This is the total number of users. This is the primary user metric in UA. New Users: Number of users who interacted with your site for the first time GA4 Three User metrics: Total Users, Active Users, and New Users. Total Users: This is the total number of users. New Users: Number of users who interacted with your site or app for the first time Active Users: Number of distinct users who visited your website or application. An active user is any user who has an engaged session. This is the primary user metric in GA4. 11
Pageviews Pageviews should be fairly close between UA and GA4 (within a few percentage points as long as no filters are applied to UA). UA GA4 Two metrics: Pageview and Unique Pageview Pageview: Total number of pages viewed. Repeated views of a single page are counted. Unique Pageview: Total number of pages viewed but duplicates are not counted One metric: Pageview (aka Views) Pageview: Total number of app screens/web pages your users saw. Repeated views of a single screen or page are counted. Unique pageviews do not exist in GA4! 12
Sessions There are slight changes to session calculations that COULD affect session numbers. UA Period of time a user is actively engaged with your website or app Session will end when there has been more than a 30-minute period of inactivity (depending on timeout settings), cut off at midnight or new campaign parameters are encountered. If a user comes back after a session timeout, it will start a new session If the user is on the website at midnight, a new session will be started If a user picks up new campaign parameters while on the website, a new session will be started GA4 aka Session Start To determine the session that each event comes from, the session start event generates a session ID and Analytics associates the session ID with each subsequent event in the session A session will end when there has been more than a 30-minute period of inactivity (depending on the timeout settings) Sessions are not restarted at midnight or when new campaign parameters are encountered If a user comes back after a session timeout, it will start a new session 13
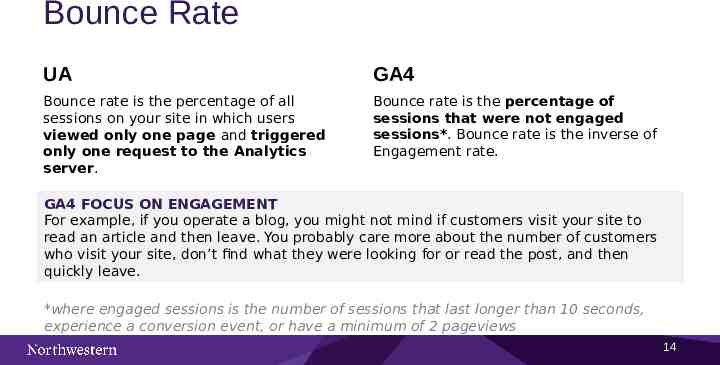
Bounce Rate UA GA4 Bounce rate is the percentage of all sessions on your site in which users viewed only one page and triggered only one request to the Analytics server. Bounce rate is the percentage of sessions that were not engaged sessions*. Bounce rate is the inverse of Engagement rate. GA4 FOCUS ON ENGAGEMENT For example, if you operate a blog, you might not mind if customers visit your site to read an article and then leave. You probably care more about the number of customers who visit your site, don’t find what they were looking for or read the post, and then quickly leave. *where engaged sessions is the number of sessions that last longer than 10 seconds, experience a conversion event, or have a minimum of 2 pageviews 14
Reporting & Exploring Data 15
Reports Analytics provides a set of default reports geared towards common reporting use cases. These are split into Lifecycle reports and User reports. Lifecycle reports include acquisition, engagement and retention information User reports include demographics and technology information 16
Where to find pageviews report in GA4 1. Go to Reports 2. Engagement 3. Pages and screens 17
“Explorations” This is a new collection of advanced techniques that go beyond standard reports to help you uncover deeper insights about behavior. This allows you to explore the data in more detail, but requires a deeper understanding of analytics metrics and dimensions. Variables and tab settings found in explorations. Filter and segment data by different metrics and dimensions. Explorations can be saved and shared out with others. 18
Metrics and Dimensions in GA4 Metrics are quantitative measurements of the data. The value of a metric is numerical. The scope of the metric is “event”. Dimensions provide context to a metric. The scope of a dimension can be “user” or “event.” The value of a dimension is text. These are descriptions or parameters of the data. These help describe and understand the data. Examples: device, source/medium, language, OS, etc. Pageviews: metric “views” dimension “page title” 19
Engagement Metrics Views are the total number of times a webpage or an app screen was viewed by users. This metric does not report on unique views. Users are the total number of unique users who interacted with your website/app for any non-zero amount of time. New users are the total number of users who interacted with your website/app for the first time. Views per user is the average number of screens viewed by each user. Average engagement time is the average length of time that the website/app had focused in the browser. 20
Explorations Example: Scenario: I want to see the page engaged people are visiting on their first visit to the Brand Tools site. Since first visits are tracked as events. I chose Event name and Page title as my dimensions and Event Count and Active users as my metrics. Since I am not interested in seeing all events, I narrowed the Event name to first visit to see only the top pages that triggered a first visit event. 21
Technical Implementation 22
Recommendations: 1. 2. 3. 4. 5. 6. Leave UA code in place and run GA4 in parallel Add OGMC combo code (example next slide) OGMC can assist in adding GA4 code to sites using a template region and base folder metadata field Activate Google Signals under Data Settings Add this meta tag to the head of pages: meta content "originwhen-crossorigin" name "referrer"/ If not using GTM, register custom events via JavaScript (example slide after next)
Combo code example Place directly after body script async "async" src "https://www.googletagmanager.com/gtag/js? id NEWCODE" /script script window.dataLayer window.dataLayer []; function gtag(){dataLayer.push(arguments);} gtag('js', new Date()); gtag('config', 'NEWCODE'); gtag('config', 'G-7XLBH2NC54'); // combo /script 24
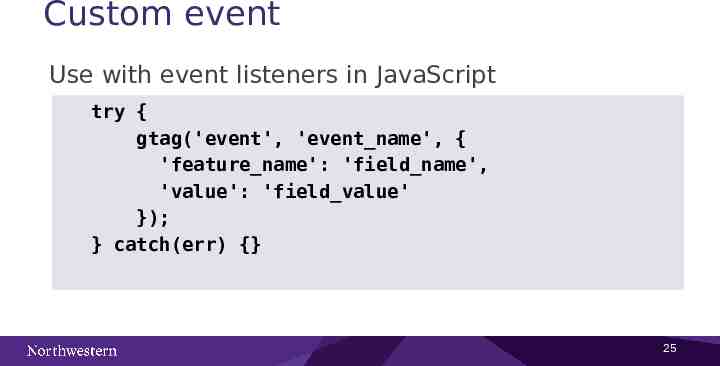
Custom event Use with event listeners in JavaScript try { gtag('event', 'event name', { 'feature name': 'field name', 'value': 'field value' }); } catch(err) {} 25
Brand Group: Shortened Version
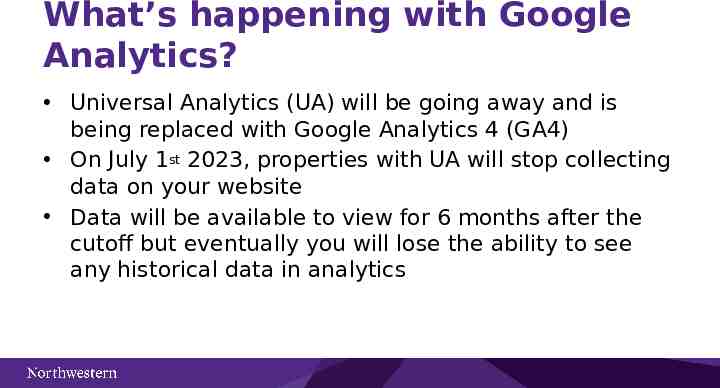
What’s happening with Google Analytics? Universal Analytics (UA) will be going away and is being replaced with Google Analytics 4 (GA4) On July 1st 2023, properties with UA will stop collecting data on your website Data will be available to view for 6 months after the cutoff but eventually you will lose the ability to see any historical data in analytics
What is GA4? What has changed? New setup: GA4 combines app and website data New data model: uses event based data instead of session based. GA4 is focused on engagement over pageviews New privacy controls: has predictive capabilities to work around increased privacy restrictions such as cookie-less measurement, and behavioral and conversion modeling New reporting: This is a new collection of advanced techniques that go beyond standard reports to help you uncover deeper insights about behavior. 28
What does this mean for you? New metrics available to track engagement like scrolls, outbound clicks, video engagement and file downloads GA4 comparisons to historical data in UA might be skewed. There are key changes to the way the following metrics are collected: Users, Pageviews, Sessions and Bounce Rate. Learning a new reporting interface. 29
What is OGMC doing? Creating new GA4 codes and placing them on the site Setting up a Northwestern analytics working group Identifying reporting needs for OGMC supported sites Providing documentation and helping explain GA4 changes Sharing access to data and reports 30
Next Steps Survey departments/units to determine reporting needs. Establish an analytics working group and set first meeting. Migrate sites to GA4. 31