The Role of Governments in the Insurance Industry Royal Institute for


40 Slides875.00 KB
The Role of Governments in the Insurance Industry Royal Institute for International Affairs London, U.K. 2 December 2002 If you would like a copy of this presentation, please give me your business card with e-mail address Download at http://www.iii.org Robert P. Hartwig, Ph.D., CPCU, Senior Vice President & Chief Economist Insurance Information Institute 110 William Street New York, NY 10038 Tel: (212) 346-5520 Fax: (212) 732-1916 [email protected] www.iii.org
Presentation Outline Changing Role of Government in Insurance Historical/Traditional Role of Government Is Role of Government Expanding/Contracting? Role & Rule of Government Beyond Direct Regulation Is ‘Insurance Regulation’ Obsolete or Marginalized? Summary & Conclusions Q & A
HISTORICAL ROLE OF GOVERNMENT IN INSURANCE Fundamentals of Insurance Regulation
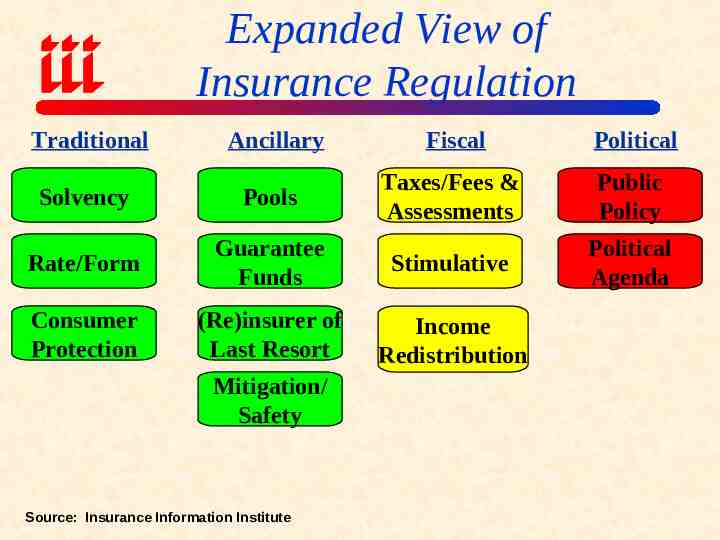
Expanded View of Insurance Regulation Traditional Ancillary Fiscal Political Solvency Pools Taxes/Fees & Assessments Public Policy Rate/Form Guarantee Funds Stimulative Political Agenda Consumer Protection (Re)insurer of Last Resort Income Redistribution Mitigation/ Safety Source: Insurance Information Institute
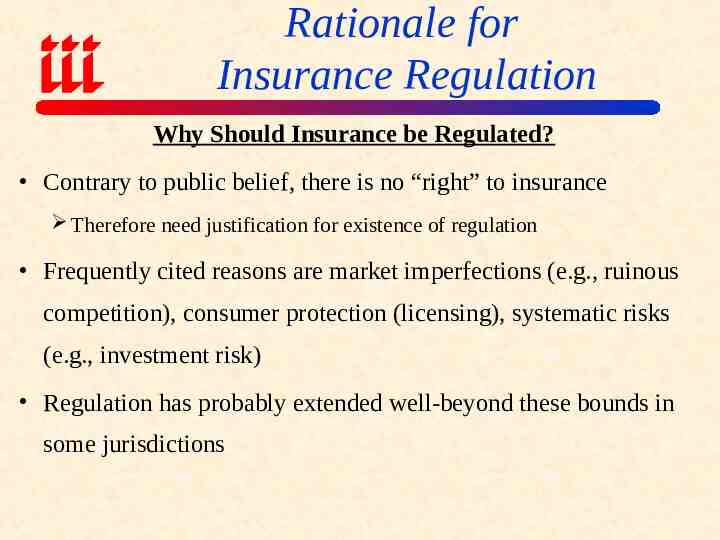
Rationale for Insurance Regulation Why Should Insurance be Regulated? Contrary to public belief, there is no “right” to insurance Therefore need justification for existence of regulation Frequently cited reasons are market imperfections (e.g., ruinous competition), consumer protection (licensing), systematic risks (e.g., investment risk) Regulation has probably extended well-beyond these bounds in some jurisdictions
IS ROLE OF GOVERNMENT IN INSURANCE EXPANDING OR CONTRACTING? Evidence of Expansion Evidence of Contraction
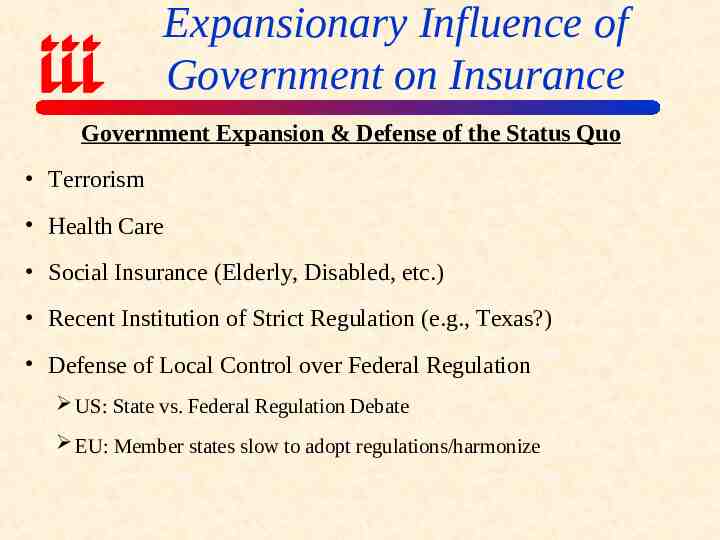
Expansionary Influence of Government on Insurance Government Expansion & Defense of the Status Quo Terrorism Health Care Social Insurance (Elderly, Disabled, etc.) Recent Institution of Strict Regulation (e.g., Texas?) Defense of Local Control over Federal Regulation US: State vs. Federal Regulation Debate EU: Member states slow to adopt regulations/harmonize
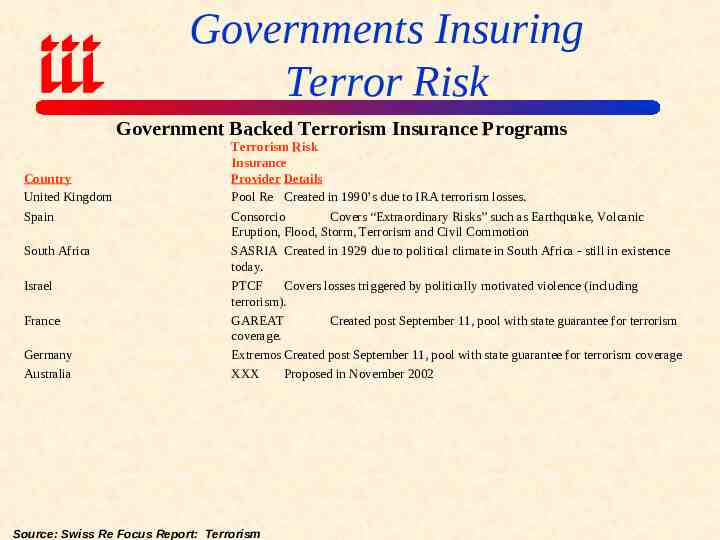
Governments Insuring Terror Risk Government Backed Terrorism Insurance Programs Country United Kingdom Spain South Africa Israel France Germany Australia Terrorism Risk Insurance Provider Details Pool Re Created in 1990’s due to IRA terrorism losses. Consorcio Covers “Extraordinary Risks” such as Earthquake, Volcanic Eruption, Flood, Storm, Terrorism and Civil Commotion SASRIA Created in 1929 due to political climate in South Africa - still in existence today. PTCF Covers losses triggered by politically motivated violence (including terrorism). GAREAT Created post September 11, pool with state guarantee for terrorism coverage. Extremos Created post September 11, pool with state guarantee for terrorism coverage XXX Proposed in November 2002 Source: Swiss Re Focus Report: Terrorism
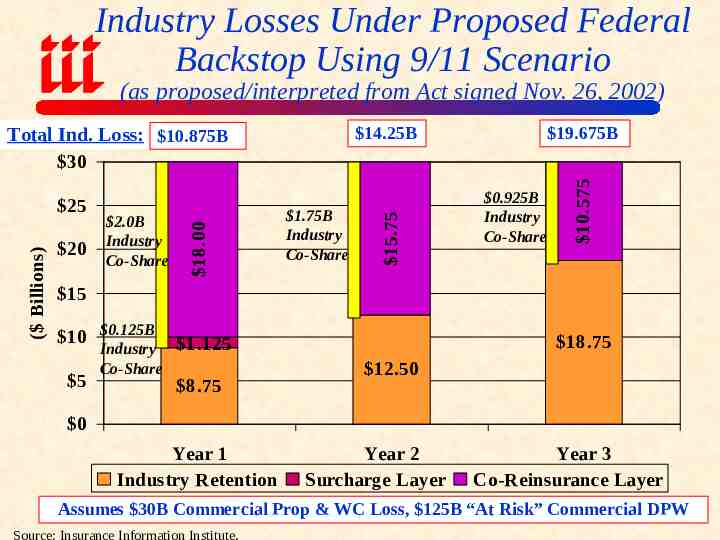
Industry Losses Under Proposed Federal Backstop Using 9/11 Scenario (as proposed/interpreted from Act signed Nov. 26, 2002) Total Ind. Loss: 10.875B 14.25B 19.675B 1.75B Industry Co-Share 0.925B Industry Co-Share 10.575 20 2.0B Industry Co-Share 15.75 ( Billions) 25 18.00 30 15 10 0.125B 5 Industry 1.125 Co-Share 8.75 18.75 12.50 0 Year 1 Industry Retention Year 2 Surcharge Layer Year 3 Co-Reinsurance Layer Assumes 30B Commercial Prop & WC Loss, 125B “At Risk” Commercial DPW Source: Insurance Information Institute.
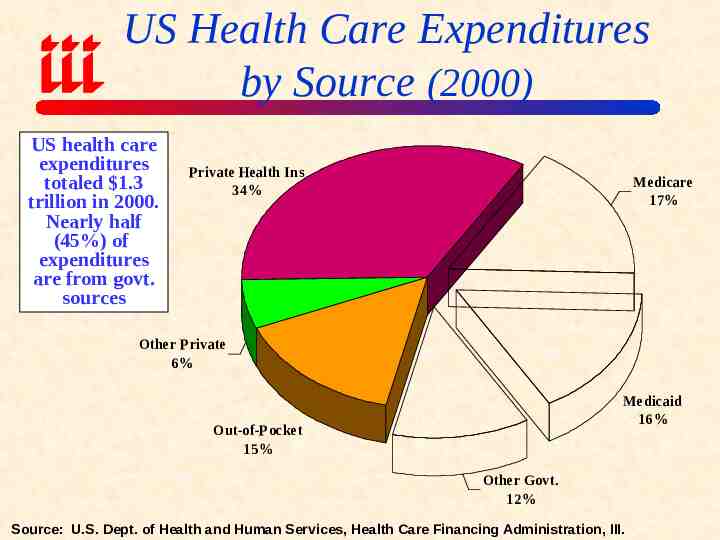
US Health Care Expenditures by Source (2000) US health care expenditures totaled 1.3 trillion in 2000. Nearly half (45%) of expenditures are from govt. sources Private Health Ins 34% Medicare 17% Other Private 6% Medicaid 16% Out-of-Pocket 15% Other Govt. 12% Source: U.S. Dept. of Health and Human Services, Health Care Financing Administration, III.
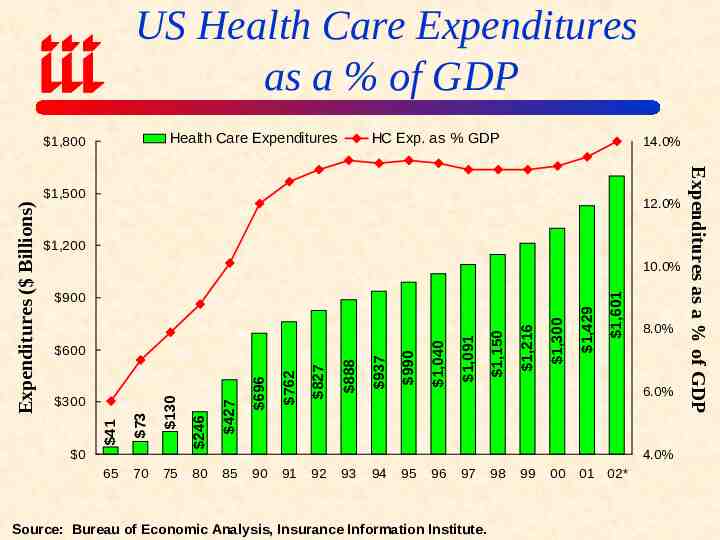
US Health Care Expenditures as a % of GDP Health Care Expenditures 1,800 HC Exp. as % GDP 14.0% 1,200 0 65 70 75 80 1,429 1,300 1,216 1,150 1,091 1,040 990 888 827 762 696 427 246 73 300 130 600 937 900 1,601 10.0% 41 Expenditures ( Billions) 12.0% 8.0% 6.0% 4.0% 85 90 91 92 93 94 95 96 97 Source: Bureau of Economic Analysis, Insurance Information Institute. 98 99 00 01 02* Expenditures as a % of GDP 1,500
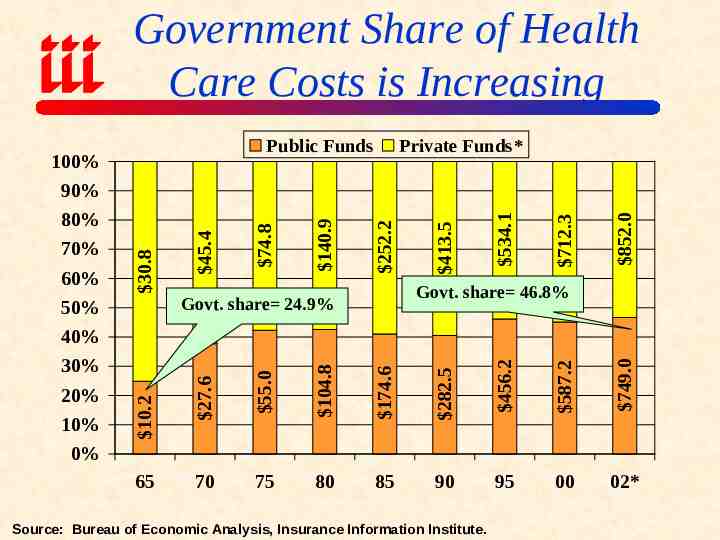
Government Share of Health Care Costs is Increasing 852.0 712.3 534.1 104.8 174.6 282.5 456.2 587.2 749.0 65 413.5 140.9 45.4 252.2 Govt. share 46.8% Govt. share 24.9% 55.0 20% 10% 0% Private Funds* 27.6 60% 50% 40% 30% 10.2 90% 80% 70% 30.8 100% 74.8 Public Funds 70 75 80 85 90 95 00 02* Source: Bureau of Economic Analysis, Insurance Information Institute.
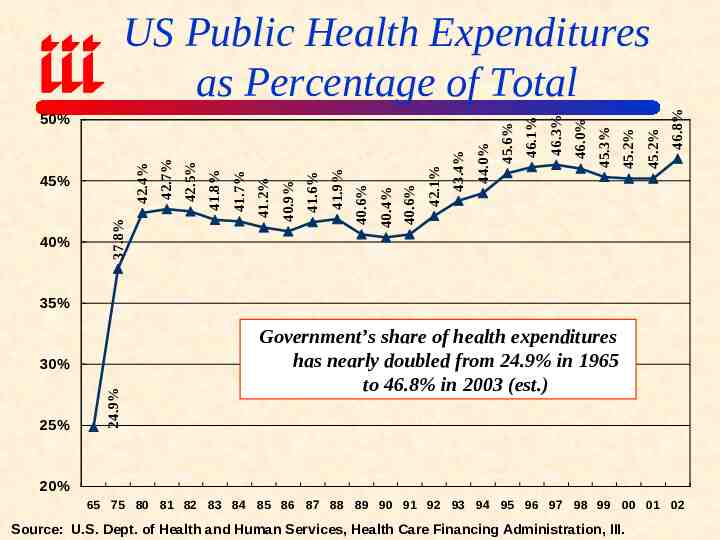
40% 46.8% 45.2% 45.2% 45.3% 46.0% 46.3% 46.1% 44.0% 43.4% 42.1% 40.6% 40.4% 40.6% 41.9% 41.6% 41.2% 41.7% 41.8% 42.5% 40.9% 37.8% 45% 42.7% 42.4% 50% 45.6% US Public Health Expenditures as Percentage of Total 35% 25% 24.9% 30% Government’s share of health expenditures has nearly doubled from 24.9% in 1965 to 46.8% in 2003 (est.) 20% 65 75 80 81 82 83 84 85 86 87 88 89 90 91 92 93 94 95 96 97 98 99 00 01 02 Source: U.S. Dept. of Health and Human Services, Health Care Financing Administration, III.
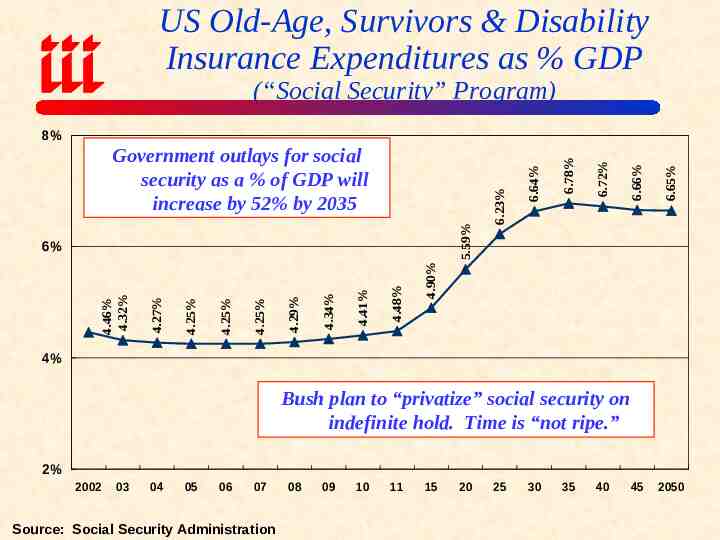
US Old-Age, Survivors & Disability Insurance Expenditures as % GDP (“Social Security” Program) 5.59% 6.65% 6.66% 6.72% 6.78% 4.90% 4.48% 4.41% 4.34% 4.29% 4.25% 4.25% 4.25% 4.27% 4.46% 4.32% 6% 6.64% Government outlays for social security as a % of GDP will increase by 52% by 2035 6.23% 8% 4% Bush plan to “privatize” social security on indefinite hold. Time is “not ripe.” 2% 2002 03 04 05 06 07 Source: Social Security Administration 08 09 10 11 15 20 25 30 35 40 45 2050
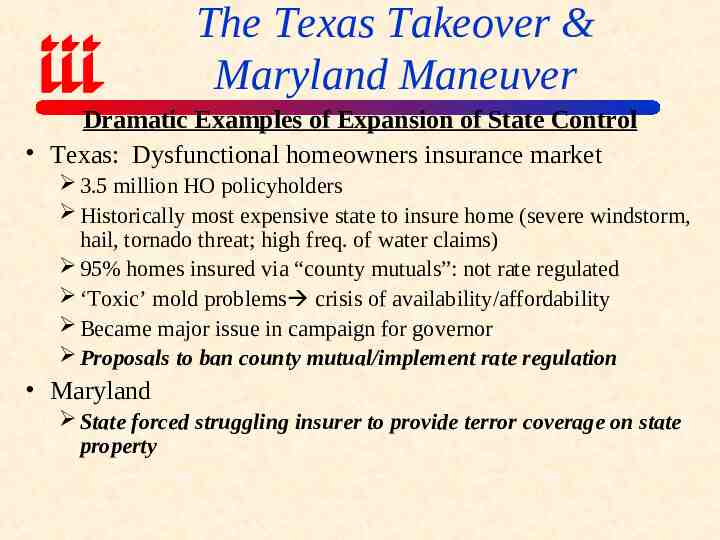
The Texas Takeover & Maryland Maneuver Dramatic Examples of Expansion of State Control Texas: Dysfunctional homeowners insurance market 3.5 million HO policyholders Historically most expensive state to insure home (severe windstorm, hail, tornado threat; high freq. of water claims) 95% homes insured via “county mutuals”: not rate regulated ‘Toxic’ mold problems crisis of availability/affordability Became major issue in campaign for governor Proposals to ban county mutual/implement rate regulation Maryland State forced struggling insurer to provide terror coverage on state property
Contractionary Influence of Government on Insurance Govt. Contraction/Liberalization/Harmonization EU Directives Japanese “Big Bang” (1996) Harmonization efforts in US after Gramm-Leach-Bliley Opening of Chinese market (esp. post-WTO) Support of ART (generally), esp. captives Strong interest in some states in domestic captives (e.g., Vermont)
ROLE/RULE OF GOVERNMENT BEYOND DIRECT REGULATION Monetary/Fiscal Policy Regulation of Securities Industry Judicial System Taxation Trade Policy National Security & Defense
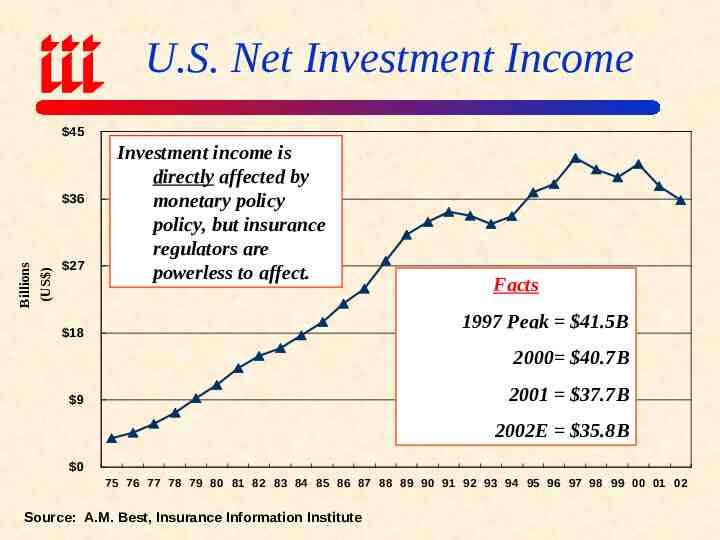
U.S. Net Investment Income 45 (US ) Billions 36 27 Investment income is directly affected by monetary policy policy, but insurance regulators are powerless to affect. Facts 1997 Peak 41.5B 18 2000 40.7B 2001 37.7B 9 2002E 35.8B 0 75 76 77 78 79 80 81 82 83 84 85 86 87 88 89 90 91 92 93 94 95 96 97 98 99 00 01 02 Source: A.M. Best, Insurance Information Institute
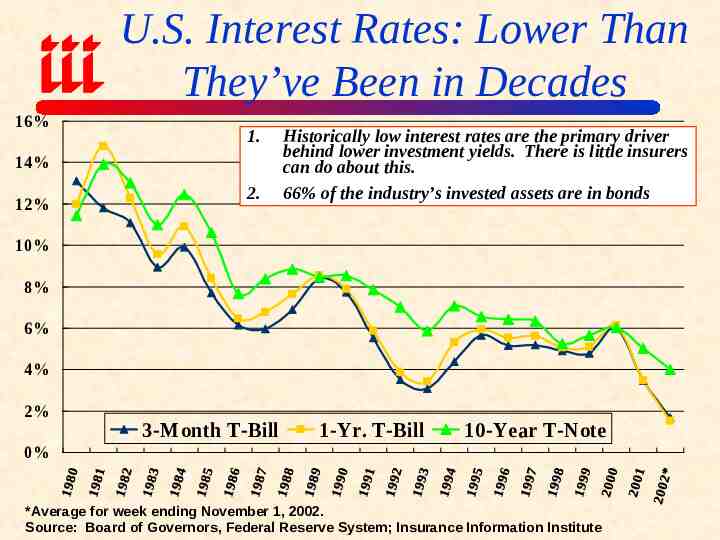
U.S. Interest Rates: Lower Than They’ve Been in Decades 16% 1. 14% 12% 2. Historically low interest rates are the primary driver behind lower investment yields. There is little insurers can do about this. 66% of the industry’s invested assets are in bonds 10% 8% 6% 4% 2% 3-Month T-Bill 1-Yr. T-Bill 10-Year T-Note 0% *Average for week ending November 1, 2002. Source: Board of Governors, Federal Reserve System; Insurance Information Institute
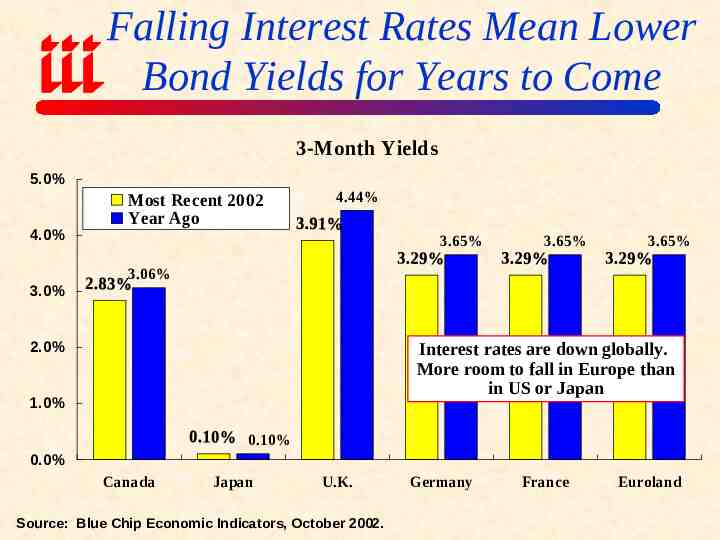
Falling Interest Rates Mean Lower Bond Yields for Years to Come 3-Month Yields 5.0% 4.0% 3.0% Most Recent 2002 Year Ago 4.44% 3.65% 3.65% 3.65% 3.06% 2.0% Interest rates are down globally. More room to fall in Europe than in US or Japan 1.0% 0.10% 0.0% Canada Japan U.K. Source: Blue Chip Economic Indicators, October 2002. Germany France Euroland
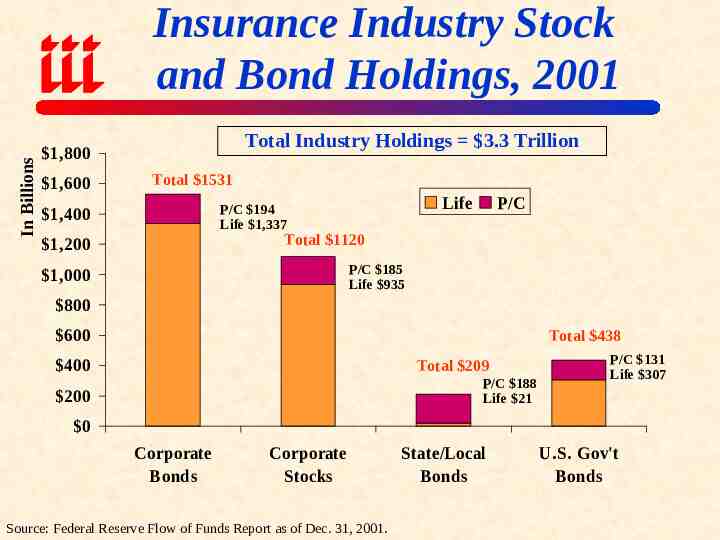
In Billions Insurance Industry Stock and Bond Holdings, 2001 Total Industry Holdings 3.3 Trillion 1,800 1,600 Total 1531 Life P/C 194 Life 1,337 1,400 P/C Total 1120 1,200 P/C 185 Life 935 1,000 800 600 Total 438 400 Total 209 P/C 188 Life 21 200 P/C 131 Life 307 0 Corporate Bonds Corporate Stocks Source: Federal Reserve Flow of Funds Report as of Dec. 31, 2001. State/Local Bonds U.S. Gov't Bonds
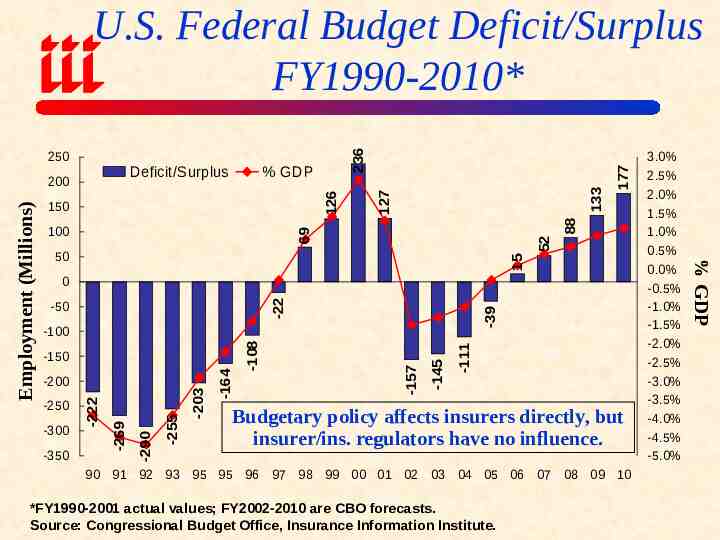
177 52 69 100 133 126 150 15 50 -50 -39 -22 0 -350 -255 -290 -300 -269 -111 -145 -157 -164 -250 -222 -200 -203 -150 -108 -100 Budgetary policy affects insurers directly, but insurer/ins. regulators have no influence. 90 91 92 93 95 95 96 97 98 99 00 01 02 03 04 05 06 07 08 09 10 *FY1990-2001 actual values; FY2002-2010 are CBO forecasts. Source: Congressional Budget Office, Insurance Information Institute. 3.0% 2.5% 2.0% 1.5% 1.0% 0.5% 0.0% -0.5% -1.0% -1.5% -2.0% -2.5% -3.0% -3.5% -4.0% -4.5% -5.0% % GDP Employment (Millions) % GDP 88 Deficit/Surplus 200 127 250 236 U.S. Federal Budget Deficit/Surplus FY1990-2010*
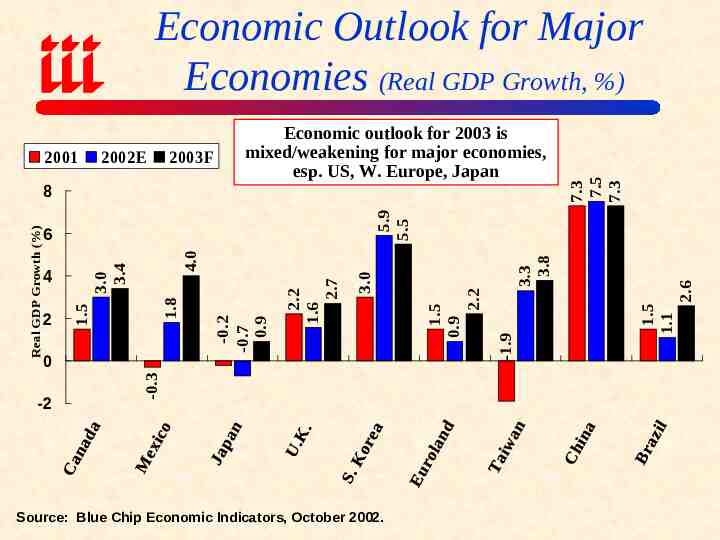
2001 2002E 2003F -2 Source: Blue Chip Economic Indicators, October 2002. 2.6 1.5 1.1 -1.9 1.5 0.9 2.2 3.3 3.8 5.9 5.5 3.0 2.2 1.6 2.7 -0.3 0 -0.2 -0.7 0.9 1.8 3.0 3.4 4 2 4.0 6 1.5 Real GDP Growth (%) 8 Economic outlook for 2003 is mixed/weakening for major economies, esp. US, W. Europe, Japan 7.3 7.5 7.3 Economic Outlook for Major Economies (Real GDP Growth, %)
U.S. Real GDP Growth Fiscal & Monetary policy have direct impact on pace of economic activity. 10% 8.3% 9% 8% 7% 6% 5% 4% 3% 2% 1% 5.7% 4.4% 3.5% 2.5% (first recession since 1990/91) 5.6% 4.8% 5.0% 2.7% 2.2% 1.0% 3.0% 2.4% 1.1% 0% -1% -2% -0.6% -0.3% -1.6% Source: US Department of Commerce, Blue Economic Indicators 10/02, Insurance Information Institute.
The Tragedy of Corporate Governance: Insurers Held Hostage Enron was tip of an iceberg Major implications for insurers (p/c and life)
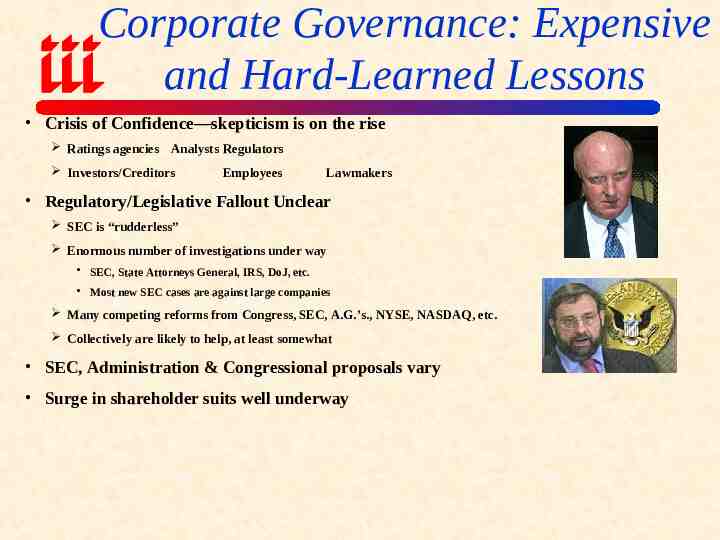
Corporate Governance: Expensive and Hard-Learned Lessons Crisis of Confidence—skepticism is on the rise Ratings agencies Analysts Regulators Investors/Creditors Employees Lawmakers Regulatory/Legislative Fallout Unclear SEC is “rudderless” Enormous number of investigations under way SEC, State Attorneys General, IRS, DoJ, etc. Most new SEC cases are against large companies Many competing reforms from Congress, SEC, A.G.’s., NYSE, NASDAQ, etc. Collectively are likely to help, at least somewhat SEC, Administration & Congressional proposals vary Surge in shareholder suits well underway
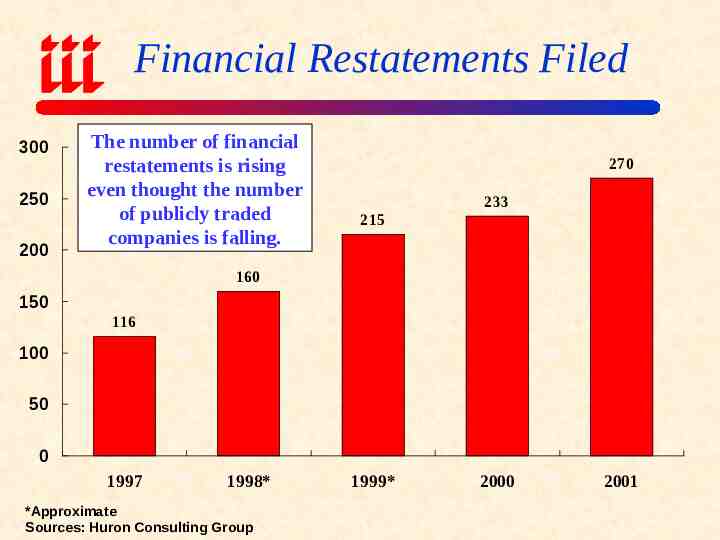
Financial Restatements Filed 300 250 200 The number of financial restatements is rising even thought the number of publicly traded companies is falling. 270 233 215 160 150 116 100 50 0 1997 1998* *Approximate Sources: Huron Consulting Group 1999* 2000 2001
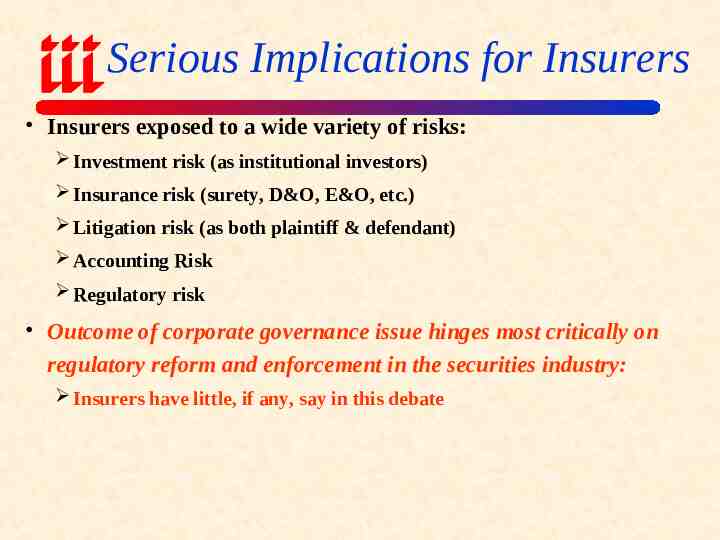
Serious Implications for Insurers Insurers exposed to a wide variety of risks: Investment risk (as institutional investors) Insurance risk (surety, D&O, E&O, etc.) Litigation risk (as both plaintiff & defendant) Accounting Risk Regulatory risk Outcome of corporate governance issue hinges most critically on regulatory reform and enforcement in the securities industry: Insurers have little, if any, say in this debate
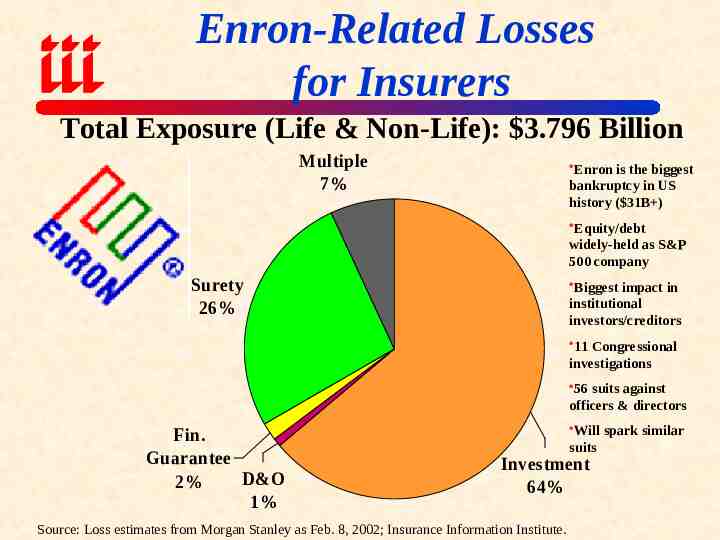
Enron-Related Losses for Insurers Total Exposure (Life & Non-Life): 3.796 Billion Multiple 7% Enron is the biggest bankruptcy in US history ( 31B ) Equity/debt widely-held as S&P 500 company Surety 26% Biggest impact in institutional investors/creditors 11 Congressional investigations 56 suits against officers & directors Fin. Guarantee D&O 2% 1% Will spark similar suits Investment 64% Source: Loss estimates from Morgan Stanley as Feb. 8, 2002; Insurance Information Institute.
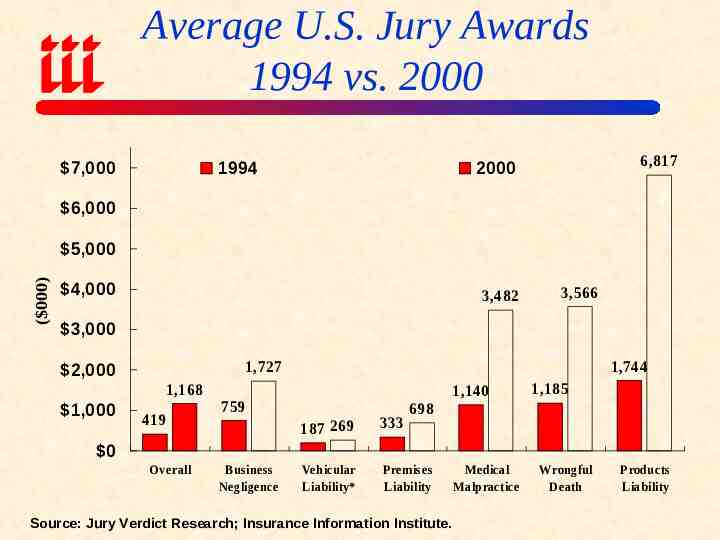
Average U.S. Jury Awards 1994 vs. 2000 7,000 1994 6,817 2000 6,000 ( 000) 5,000 4,000 3,482 3,566 3,000 1,168 1,000 1,744 1,727 2,000 419 1,140 759 1,185 698 187 269 333 Vehicular Liability* Premises Liability 0 Overall Business Negligence Source: Jury Verdict Research; Insurance Information Institute. Medical Malpractice Wrongful Death Products Liability
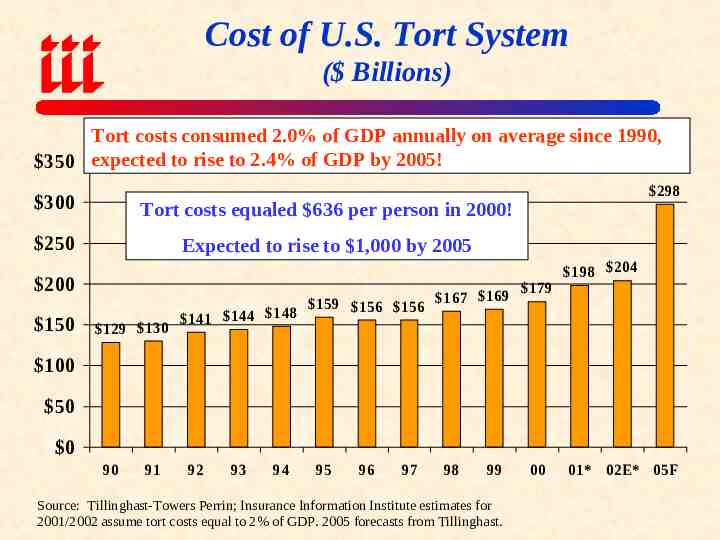
Cost of U.S. Tort System ( Billions) Tort costs consumed 2.0% of GDP annually on average since 1990, 350 expected to rise to 2.4% of GDP by 2005! 300 Tort costs equaled 636 per person in 2000! 250 Expected to rise to 1,000 by 2005 200 150 129 130 141 144 148 159 156 156 298 179 167 169 198 204 100 50 0 90 91 92 93 94 95 96 97 98 99 Source: Tillinghast-Towers Perrin; Insurance Information Institute estimates for 2001/2002 assume tort costs equal to 2% of GDP. 2005 forecasts from Tillinghast. 00 01* 02E* 05F
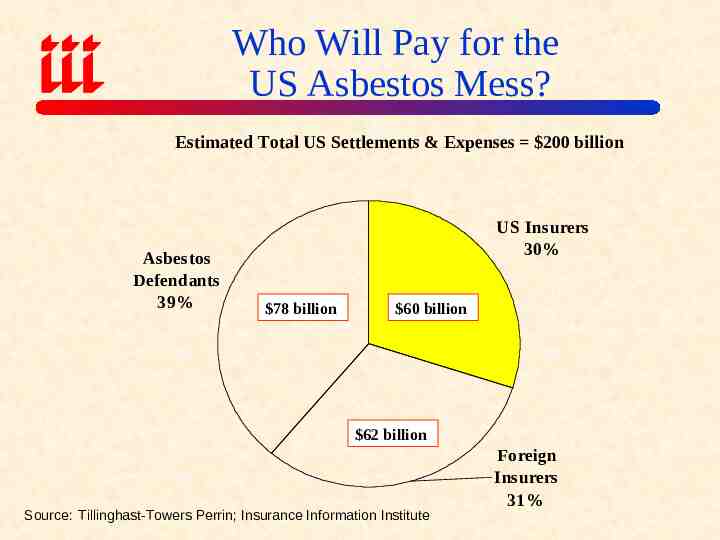
Who Will Pay for the US Asbestos Mess? Estimated Total US Settlements & Expenses 200 billion Asbestos Defendants 39% US Insurers 30% 78 billion 60 billion 62 billion Source: Tillinghast-Towers Perrin; Insurance Information Institute Foreign Insurers 31%
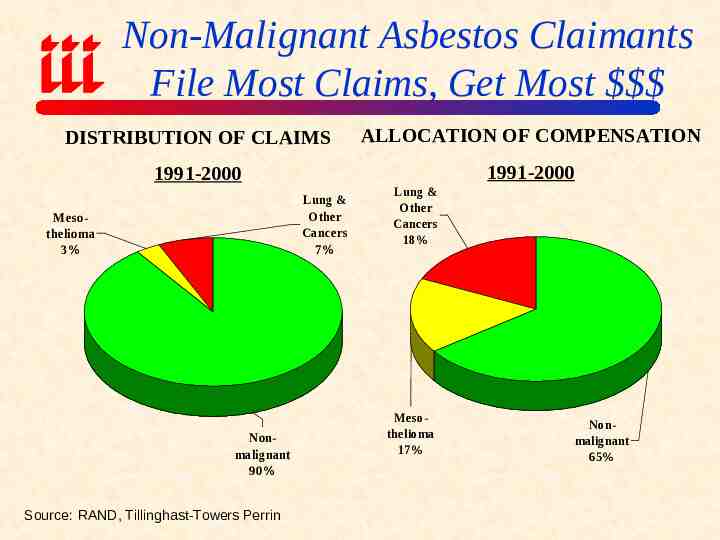
Non-Malignant Asbestos Claimants File Most Claims, Get Most DISTRIBUTION OF CLAIMS ALLOCATION OF COMPENSATION 1991-2000 1991-2000 Lung & Other Cancers 7% Mesothelioma 3% Nonmalignant 90% Source: RAND, Tillinghast-Towers Perrin Lung & Other Cancers 18% Mesothelioma 17% Nonmalignant 65%
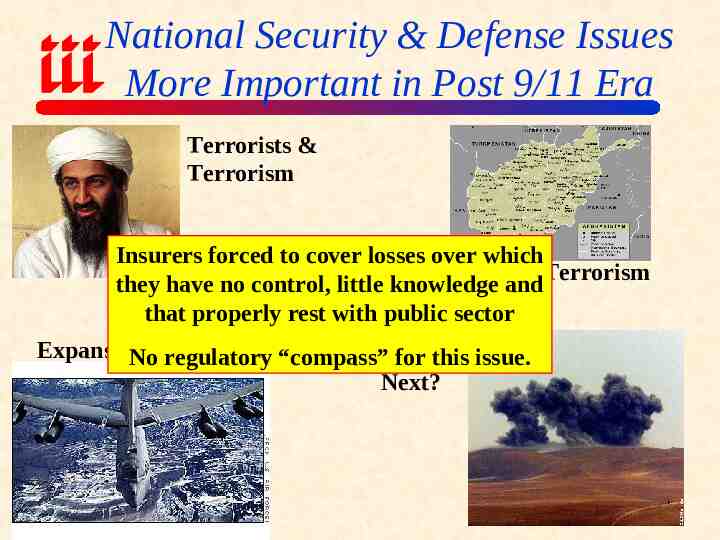
National Security & Defense Issues More Important in Post 9/11 Era Terrorists & Terrorism Insurers forced to cover losses over which War on Terrorism they have no control, little knowledge and that properly rest with public sector Expansion War Is for Iraq Noofregulatory “compass” this issue. Next?
THE ROLE OF GOVERNMENTS IN IN INSURANCE IN THE ST 21 CENTURY Is Traditional’ Regulation is Archaic? Focus on Convergence of Sectors Conclusions
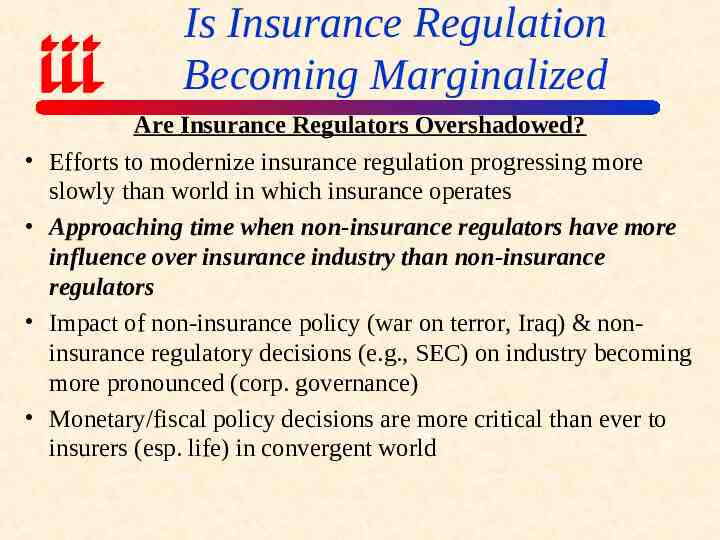
Is Insurance Regulation Becoming Marginalized Are Insurance Regulators Overshadowed? Efforts to modernize insurance regulation progressing more slowly than world in which insurance operates Approaching time when non-insurance regulators have more influence over insurance industry than non-insurance regulators Impact of non-insurance policy (war on terror, Iraq) & noninsurance regulatory decisions (e.g., SEC) on industry becoming more pronounced (corp. governance) Monetary/fiscal policy decisions are more critical than ever to insurers (esp. life) in convergent world
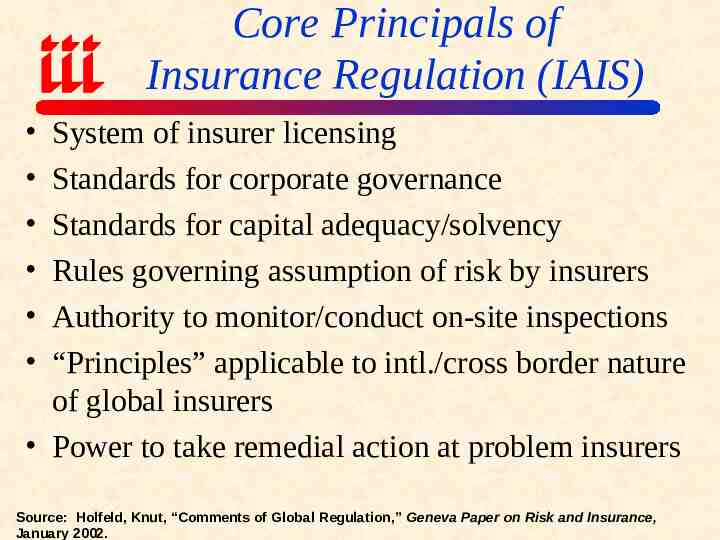
Core Principals of Insurance Regulation (IAIS) System of insurer licensing Standards for corporate governance Standards for capital adequacy/solvency Rules governing assumption of risk by insurers Authority to monitor/conduct on-site inspections “Principles” applicable to intl./cross border nature of global insurers Power to take remedial action at problem insurers Source: Holfeld, Knut, “Comments of Global Regulation,” Geneva Paper on Risk and Insurance, January 2002.
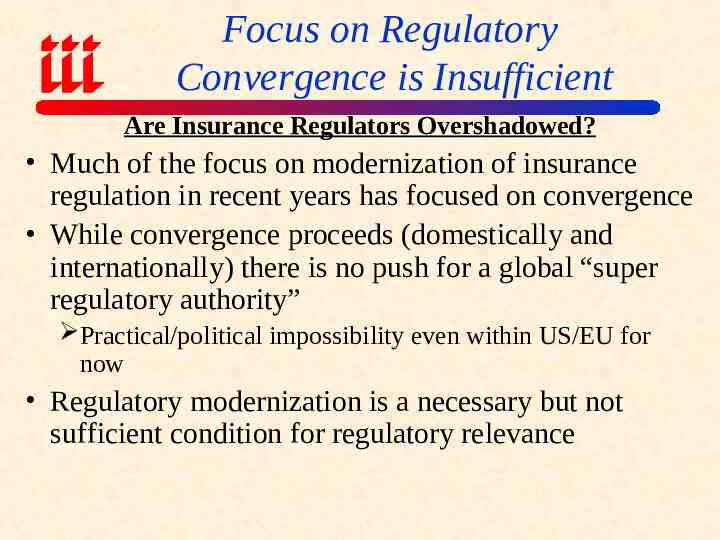
Focus on Regulatory Convergence is Insufficient Are Insurance Regulators Overshadowed? Much of the focus on modernization of insurance regulation in recent years has focused on convergence While convergence proceeds (domestically and internationally) there is no push for a global “super regulatory authority” Practical/political impossibility even within US/EU for now Regulatory modernization is a necessary but not sufficient condition for regulatory relevance
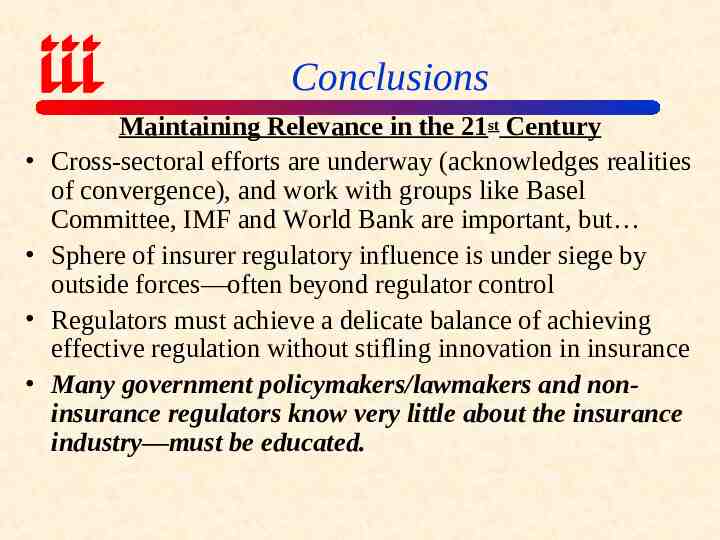
Conclusions Maintaining Relevance in the 21st Century Cross-sectoral efforts are underway (acknowledges realities of convergence), and work with groups like Basel Committee, IMF and World Bank are important, but Sphere of insurer regulatory influence is under siege by outside forces—often beyond regulator control Regulators must achieve a delicate balance of achieving effective regulation without stifling innovation in insurance Many government policymakers/lawmakers and noninsurance regulators know very little about the insurance industry—must be educated.
Insurance Information Institute On-Line Download or view this presentation at: http://www.iii.org